Nanofractal Analysis of Material Surfaces Using Atomic Force Microscopy
Mir Behdad Khamesee
*, Yasushi Kurosaki, Masahito Matsui and Kenichi Murai
Faculty of Engineering, Mie University, Tsu, 514-8507, Japan
The surface structures of four materials (a pure aluminum sheet, an aluminum alloy sash, a thickness gauge and a magnetic tape) are observed on the nanometer scale by atomic force microscopy (AFM) and analyzed by one-dimensional fractal analyses. It is confirmed for all the surfaces that they have a self-affined fractal property under a resolution of 1 nm. The two-dimensional fast Fourier transformation (2D-FFT) analysis is also applied to these surfaces and their characteristics are clarified. The power spectrum model for surface simulation is proposed and its validity is confirmed by experimental results. A method for simulating the surface structure of any materials is presented, and its validity is shown on some materials whether in-plane isotropic or anisotropic. A computer-aided engineering (CAE) system composed of 2D-FFT and inverse FFT (IFFT) for quantitative estimation of surface nanostructures is advanced and applied to various surface problems. It enables the mass data of a material surface to compress into only three parameters. This compressed information includes all surface waviness, complexity, irregularity, roughness and in-plane anisotropic properties.
(Received July 1, 2003; Accepted November 6, 2003)
Keywords: material testing, measurement, surface nanostructure, nanofractal analysis, nanotechnology, atomic force microscope, two-dimensional fast Fourier transformation, computer simulation, computer-aided engineering
1. Introduction
In metal forming operations, surface structures of metals and tools are closely related to various surface problems,i.e., forming limit, coating feasibility, galling and other tribolog-ical characteristics. Recently, the accuracy and quality of nanotechnology processes have markedly improved, and thus, information related to the detailed geometry of such surface structures on the nanometer scale has become necessary as well as their complexities. Although a number of investigations on material surface phenomena have been carried out,1–3) as of yet information on surface
nano-structures has been insufficient. One of the reasons is that, the surface structures involve various classes of randomness and are difficult to characterize quantitatively. In order to analyse these structures, the authors proposed a fractal approach, and verified its validity against our past researches,4,5)where
one-dimensional fractal analyses were employed under a micro/ meso scale.
Based on their results, the present study has been conducted to clarify the actual state of the surface nano-structure and to establish a computer-aided engineering (CAE) method for estimating them. At first, the surface structures of four materials (a pure aluminum sheet, an aluminum alloy sash, a thickness gauge and a magnetic tape) are observed on the nanometer scale by atomic force microscopy (AFM) and analyzed by one-dimensional fractal analyses. The self-affinity and fractal nature property of these surfaces are investigated. Next, the fractal approach is extended to the two-dimensional (2D) fractal method, and thus, the two-dimensional fast Fourier transformation (2D-FFT) analysis is also applied to these surfaces. Moreover, by modeling the 2D power spectrum distribution, a method for simulating the surface nanostructures of any materials is presented, and also its validity is examined for various materials with in-plane isotropic and anisotropic surfaces. In addition, based on these results, a CAE system composed of 2D-FFT and inverse FFT (IFFT) is advanced, and its
application is presented and discussed regarding the various surface problems.
2. One-Dimensional Fractal Analysis
A fractal is a complicated geometric figure, which does not have characteristic length, but has self-similarity. Since Mandelbrot advocated this concept in 1975, its applications have been tried by the quantification of a complicated phenomenon or an object in various fields.3) Generally, material surfaces are not self-similar, but self-affined. The term ‘self-affinity’ denotes that shapes are invariant under transformations that scale different coordinates by different amounts. The fractal dimension usually characterizes a fractal property.6)Although various methods for determining
it had been proposed in past investigations, the power spectrum and zeroset analyses were shown to be applicable to self-affined surfaces by the authors.4,5)They are regarded as
one-dimensional analyses and are also employed in the present research.
2.1 Power spectrum method
The power spectrum SP and the wavelength were
obtained by applying one-dimensional FFT analysis to the surface profile curves, and the following relation was assumed.
SP / ð1Þ
The fractal dimensionDPSwas determined from the slope of
thelogðSPÞvslogðÞplot, denoted by, as.6)
DPS¼2; 05 <1
DPS¼Eþ ð3Þ=2; 1553 ð2Þ
DPS¼1; 3<
whereEis the Euclidean dimension, andE¼1in this study.
2.2 Zeroset method
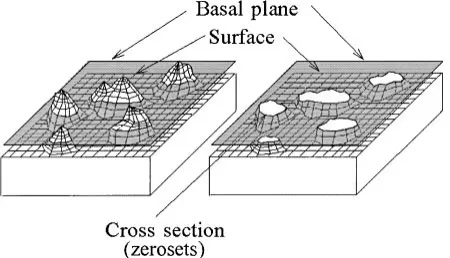
An explanation of the zeroset method is shown in Fig. 1. Intersections of surface irregularities and the basal plane,
*Graduate Student, Mie University.
shapes are directly observed. Even if surfaces are self-affined and isotropic in-plane, the resultant zeroset elements become self-similar and reduce their fractal dimensions by one. When the area and the peripheral length of each zeroset element are denoted byAzandLz, respectively, the fractal dimensionDz
is obtained from the following relation.
Az1=2/Lz1=Dz ð3Þ
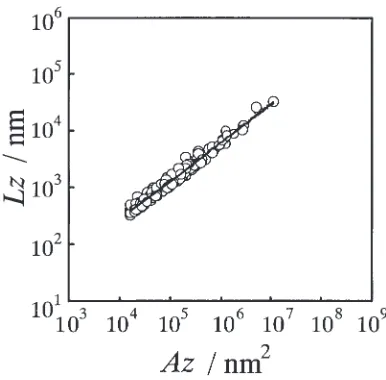
When the relation between Lz and Az is measured exper-imentally, the zeroset dimensionDzcan be determined by the following equation from the slope of thelogðLzÞvs logðAzÞ
plot, denoted byz.
Dz¼2z ð4Þ
2.3 Experimental procedure
The tested materials were commercially available pure aluminum sheets (A1100-O), aluminum alloy bars (A6063-T5 for sash), a thickness gauge and a magnetic tape. Since pure aluminum sheets are used in many metal forming processes, and aluminum alloy bars are the products of metal forming processes, an analysis of their respective surfaces will no doubt prove useful in such processes. Of course both pure aluminum sheets and aluminum alloy bars are consid-ered in-plane anisotropic materials. Also a thickness gauge was chosen because it is in-plane isotropic and has an extremely smooth surface. Magnetic particles give a special aspect to the tape surface, so a magnetic tape serves as another nonmetal material. The characteristics of the tested materials are shown in Table 1. Their surfaces were observed by AFM (Shimadzu Co. (SPM- 9500 J 3)). The scanning ranges (SR) used are20mm20mm(SR¼20mm),2mm
2mm (SR¼2mm) and 500nm500nm (SR¼500nm). Image resolution was set at512512pixels.
vertical sections are shown in three ranges of scanning, where the ratio of the vertical axis to the horizontal axis is ten to one. However, the wavelength and the wave amplitude increase relatively with decreasing SRin the same scaling. This means that the magnification factors are different, which denotes the self-affined property.
Detailed observation shows that eq. (5) stands for all the used materials, although not shown here. H was obtained; 0.76 for A1100-O, 0.47 for A6063-T5, 0.33 for the thickness gauge and 0.31 for the magnetic tape. Thus, it was confirmed that their surfaces are self-affined in the range down to at least
[image:2.595.58.283.73.202.2]SR¼500nm.
Table 1 Characteristics of tested meterials
Materials Roughness Specimen size and thickness Rz/mm for AFM/mm A1100-O sheets 0.22 86, 0.8 A6063-T5 bars for sash 0.24 86, 0.8 Thickness gauge 0.22 64, 0.5 Magnetic tape 0.05 76, 0.08
[image:2.595.322.528.446.768.2] [image:2.595.47.289.709.785.2]2.5 Nanofractal dimensions
The relationship between the power spectrum SP and
wavelengthof A1100-O was investigated, and is shown in Fig. 3, where a linear relationship was found betweenSPand
. Moreover the relationship between SP and for all the
tested materials was investigated. It was found that relation (1) holds for all materials, showing a fractal nature.
The relationship between power spectrum dimensionDPS
and scanning rangeSRis shown in Fig. 4. TheDPSof
A1100-O decreases gradually with increasing SR. Values of DPS
were determined in the range of 0.08 to 20mmfor when
SR¼20mm. This relationship was also observed in the other three materials.
The relationship betweenLzandAzfor A1100-O is shown in Fig. 5, where a linear relationship can be observed, and it denotes a fractal nature.
The relationship between the zeroset dimensionDzand the scanning rangeSRis shown in Fig. 6. WhenSRdecreases,Dz
also decreases, and when SR is 500 nm, Dz becomes approximately unity. The zeroset dimension Dz and the power spectrum dimensionDPShave different values.Dzis a
direct measure of the complexity of surface irregularities, whereasDPSis different from the physical viewpoint in that it
is a measure of wavelength dependability when the surface is viewed as a spectrum. If the magnifying power increases,Dz
decreases, indicating that the surface becomes smooth. On the other hand, DPS slowly increases with increasing
magnifying power, in contrast to Dz. This shows that the influence of the short-wavelength ingredient of a cross-sectional curve is reflected strongly, when the magnifying power increases.
According to the self-affinity and two fractal analyses, all the tested surfaces were found to be self-affined fractals in the range down to at least SR¼500nm, corresponding to a resolution of 1 nm.
3. Two-Dimensional FFT and Simulation of Surfaces
In order to quantify the irregularities of the whole surface, it is more important to grasp the three-dimensional features of the surface structure. In our previous research7) we suggested a method for surface simulation of in-plane isotropic materials. Here, we attempted to develop a
Fig. 3 Relationship betweenSPandin power spectrum method
(A1100-O,SR¼20mm).
Fig. 4 Relationship betweenSRandDPS(A1100-O).
Fig. 5 Relationship betweenLzandAzin zeroset method (A1100-O,SR¼
20mm).
[image:3.595.65.274.68.263.2] [image:3.595.329.522.70.260.2] [image:3.595.329.524.310.485.2] [image:3.595.70.272.313.499.2]comprehensive method of estimating and simulating any material surface, whether isotropic or anisotropic in the plane.
3.1 2D-FFT analysis on material surface
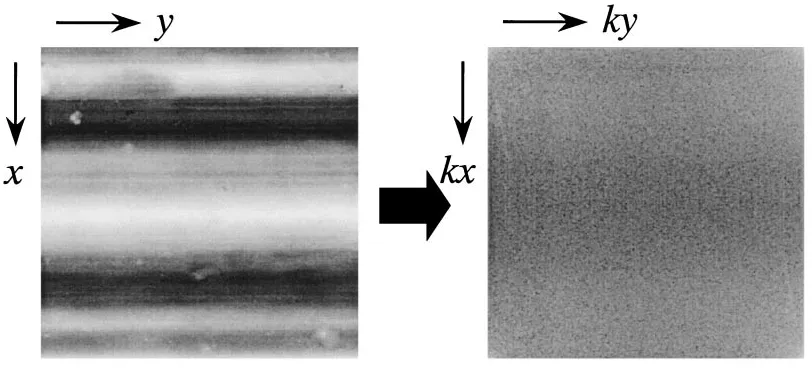
Employing one method, FFT was carried out on 2D-AFM images of in-plane anisotropic aluminum sheets (A1100-O), and their power spectra were examined. Exam-ples of the AFM and 2D-FFT images are shown in Fig. 7. The spectrum obtained by FFT shows the strength of the power spectrumSP in each (kx,ky). The relative depth is illustrated
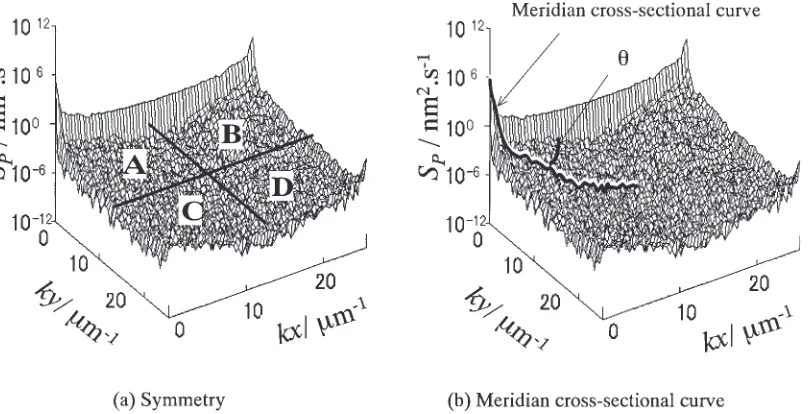
by the varying degree of brightness, and has the following characteristics. The values ofkxandkyare wave numbers of unit of length in thexandydirections, wherexcorresponds to the rolling direction andyis the direction perpendicular to it. The vertical section of the power spectrum image is shown in Fig. 8. Figure 8(a) shows that when ky is constant and equal to 12.8mm1, andkxis varies from 0 to 25.6mm1, the
curve is symmetrically shown relating to the midpoint (kx¼12:8mm1). The curves were examined using the other constant values ofky, and the result was the same. Also, Fig. 8(b) shows the vertical section of the power spectrum image whenkxis constant and equal to 12.8mm1, andkyis
variable. This curve is also symmetrical at the midpoint (ky¼12:8mm1). The curves using the other constant values
ofkxwere symmetrical at the midpoint, as well. Accordingly, it was concluded that the power spectrum image is sym-metrical through two midplanes, and thus, the image was divided into four portions (A, B, C, D), as shown in Fig. 9(a). Therefore, if the portion of A is modeled, the whole power spectrum image can be determined. In addition, a cross section of the power spectrum image was examined in the meridian direction. The meridian cross-sectional curve and its related angleare shown in Fig. 9(b). The meridian curve can be drawn at an arbitrary angle ofin the portion of A. An example of the curve is shown in Fig. 10, where the equivalent wave number K is defined by eq. (6). As it is difficult to define the characteristics using this graph,SPand
K have been displayed on a logarithmic graph in Fig. 11. Since the curve can be approximated by a straight line, eq. (7) can be applied. This equation shows a power rule of K, indicating a fractal nature.
K¼ ðkx2þky2Þ1=2 ð6Þ
SP ¼K ð7Þ
Here, the value of the coefficientand the slopefor each
were investigated using eq. (7). Consequently the values of
Fig. 7 An example of AFM and FFT images on A1100-O surface.
[image:4.595.92.498.71.257.2] [image:4.595.308.546.332.614.2]andwere found to be almost the same grade for all ranges of, except for¼0 and 90corresponding to thekx- and ky-axes.
3.2 Creation of a power spectrum image for simulation 3.2.1 Modeling of power spectrum distribution
A model was produced using the characteristics of the 2D-FFT analysis results and a spectrum was created. Based on the symmetry of the power spectrum distribution, the portion of A was modeled by rotating the curve mentioned in eq. (7) in0< <90, whenS
P-axis is the rotation axis, as shown
in Fig. 12. After constructing the portion of A, the portions of B, C and D were determined using their symmetric proper-ties. The whole spectrum thus obtained is referred to as the base spectrum.
An actual and a base spectrum are compared in Fig. 13. First, it turns out that the base spectrum is smoother. Accordingly, variation was given to the base spectrum by introducing the Gauss random number, and the result is shown in Fig. 14(a).
It was found from the results of the power spectrum analysis on aluminum A1100-O sheets that the power spectrum values on the kx- and ky-axes are respectively, singular and multiple of the values obtained by eq. (7), and dominate the in-plane anisotropic property of the sheets. Accordingly, an anisotropic parameter is introduced here, and the power spectrumSPis expressed by eqs. (8) and (9) on
thekx- andky-axes, respectively.
ðSPÞkx ¼K; on thekx-axis ð8Þ
ðSPÞky ¼1K; on theky-axis ð9Þ
depends on the type of material used, and a value of 93 was obtained in the case of aluminum A1100-O from the experimental results. Of course, is considered 1 for in-plane isotropic materials. The effect of on the power spectrum is shown in Fig. 14(b). Thus, the creation of a spectrum was carried out satisfactorily.
[image:5.595.102.506.72.279.2]Fig. 9 Feature of power spectrum image (A1100-O,SR¼20mm).
Fig. 10 Cross-sectional view of power spectrum image in meridian direction (A1100-O,SR¼20mm,¼45).
[image:5.595.341.509.316.480.2]Fig. 11 The logarithmic graph of cross-sectional curve (A1100-O,SR¼20mm,¼45).
[image:5.595.62.277.460.556.2]3.2.2 Determination method of parameters
In order to quantify the surface structure of an AFM image, eq. (7) was used andandwere determined for¼45in the spectrum image using the least-squares method. More-over, is calculated for¼0 in the spectrum image. The
obtained,and are used as the simulation parameters. An adequate range of the equivalent wave number K, which requires the parameters, was examined. Since the curvature radius of the stylus in AFM is originally limited to 20 nm, SP is unreliable in a range of the wavelength less
than 20 nm. In other words, considering the relation of¼ K1 these parameters were determined.
3.3 Simulation method for 3D surfaces
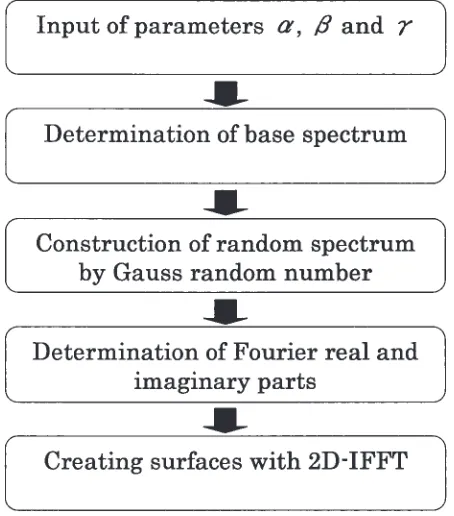
Based on the aforementioned results, a method for creating three-dimensional surfaces is presented here. The flow chart of this method is shown in Fig. 15.
[image:6.595.101.494.72.250.2]First, the material property is set up so that the simulated surface is in-plane anisotropic. Next, , and should be inserted, then the power spectrum is generated and random-ness is given to it. After the Fourier real and imaginary parts are calculated, 2D-IFFT is carried out, by which the surface feature is created.
[image:6.595.105.475.285.456.2]Fig. 13 Comparison between the actual and base spectrum images of aluminum (A1100-O,SR¼20mm).
Fig. 14 Consideration of the Gauss random number and parameteron the power spectrum image (A1100-O,SR¼20mm).
[image:6.595.314.541.500.758.2]3.4 Results of simulation
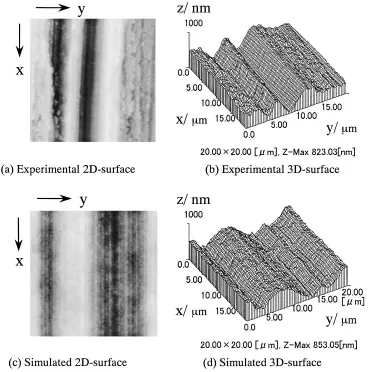
The simulation was carried out on in-plane anisotropic aluminum A1100-O sheets. The employed values for parameters are ¼0:52, ¼3:12 and ¼93, where the
value is expressed with the units nm2s1 forS
Pandmm1
forK. The experimental and simulated 2D and 3D surfaces in
SR= 20mmare shown in Fig. 16. As seen, the feature and anisotropic properties of experimental and simulated surfaces are well matched. Also, the value ofZ-Maxis approximately the same for both surfaces; therefore the validity of this method was confirmed.
4. Applications of 2D-FFT and IFFT to Analyzing Surface Structures
There are various applications of 1D-FFT to the engineer-ing process and the introduction of 1D-FFT into CAE systems was proposed in our past research.5) Here, a CAE
system for analyzing surface structures of any materials, which combines 2D-FFT with IFFT including modeling, has been constructed, and its applications are presented.
4.1 3D simulation of various engineering surfaces
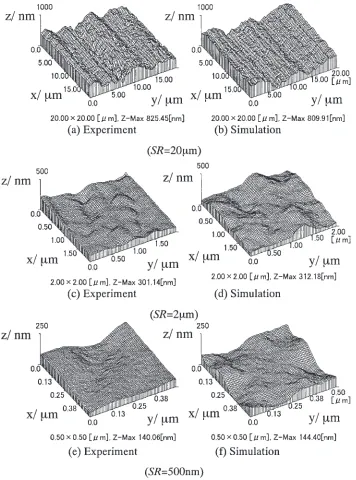
The aluminum alloy bar (A6063-T5 for a sash) is another anisotropic sample for material surface simulation. The parameter values employed for SR = 20mm are ¼0:49,
¼2:78and ¼96, forSR= 2mmare¼434,¼4:22
and ¼1, and forSR= 500 nm are¼5487,¼3:89and
¼1. As shown in Fig. 17, the surface features of the real and simulated surfaces are matched well. TheZ-Maxvalues of the simulation and the experimental surfaces are approx-imately the same. In the cases ofSR= 2mmand 500 nm, the anisotropic properties are not as clearly defined when compared with the case of SR = 20mm, for both the experimental and simulation surfaces.
As an example of in-plane isotropic and nonmetal materials, magnetic tape was used for the simulation. Although magnetic tape is considered to be an isotropic material, the magnetic particles give a special aspect to the tape surface. The simulation parameters for this material were calculated as¼0:2,¼2:08and¼1. Its surface features are shown in Fig. 18, and it is compared with the generated surface by simulation. As seen in Fig. 18, the roughness and surface complexity in addition to the surface features have been well matched.
4.2 Estimation of surface features usingand
Actually, and in eq. (7) denote surface character-izations. The effect ofon surface features was examined by simulation and shown in Fig. 19, when is variable under
[image:7.595.115.486.71.443.2]¼0:1 and ¼1. The surface complexity, including texture irregularities, decreases with increasing. Figure 20
Fig. 17 Comparison of surface feature between simulation and experiment (A6063-T5).
[image:8.595.110.488.581.772.2]shows the relationship ofwith surface roughness character-izations, when¼3and ¼1. TheZ-Maxcorresponding to roughness Rz increases with increasing . Thus, these two parameters serve to characterize the surface features.
4.3 Examination on surface smoothing in high-precision metal forming
One of the applications of the present CAE system is to confirm the possibility of its utilization to the nanotechnology process in metal forming. Here, we attempted to generate supersmooth aluminum surfaces by simple compression. Specimens of 10mm3mm, 0.8 mm thickness were made using the aforementioned A1100-O aluminum sheets, and paraffin mineral oil was used as a lubricant between the compression tool and the sheet.
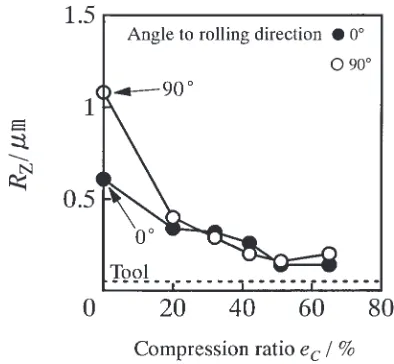
After pressing, the surface roughnessRzwas measured for each compression ratio eC in the cases of 0 and 90
directions, which is shown in Fig. 21. TheRzdecreases with increasing compression ratio, indicating that the plastic deformation causes the large-wavelength components to grow, which reduces the surface complexity. The roughness
of the tool surface was 50 nm, and the minimum Rzin the pressed surfaces was 140 nm at a compression ratio of 65%.
[image:9.595.97.498.75.281.2]and were obtained for each compression ratio by the
Fig. 19 Effect ofon surface features in the case of¼0:1and¼1.
[image:9.595.97.502.254.490.2]Fig. 20 Effect ofon surface features in the case of¼3and¼1.
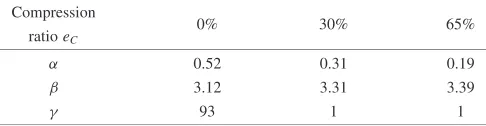
[image:9.595.326.523.535.717.2]aforementioned method and are shown in Table 2. The simulated surfaces based on these values are shown in Fig. 22. These simulation results were in good agreement with the experimental results. From Table 2 it is seen that , which expresses roughness characterizations, decreases with in-creasing compression ratio, and this tendency is matched with a variation of Rz. In addition, the surface complexity which decreases with increasing compression ratio is matched with a change in. Thus the quality of the deformed surface structure can be judged by these parameters. There-fore, the proposed system is regarded as useful for under-standing the surface nanostructures of products manufactured through high-precision press forming.
Finally, while the 3D surface information constitutes
512512elements, it can be reproduced through only three parameters , and using the advanced CAE system. Accordingly, the system is also regarded as applicable to so-called information compression.
5. Concluding Remarks
The results obtained in the present research are summa-rized as follows:
(1) From the results of the one-dimensional fractal analysis, it was found that the surfaces of all used materials are self-affined fractals at a resolution of 1 nm.
(2) The results obtained for two-dimensional FFT of AFM images showed that the meridian cross-sectional curve
had a fractal nature.
(3) The spectrum distribution could be modeled adequately by introducing its symmetry in the wave-number space and an anisotropic parameter.
(4) By using only three parameters a simulator was successfully developed, which can carry out the creation of three-dimensional surface features at the same level of complexity as that of the actual surface. (5) A CAE system composed of 2D-FFT and 2D-IFFT was
constructed for quantitative estimation of the surface structures and its various applications were shown to be valid.
(6) The mass data of surfaces could be compressed into only three parameters using this system. This com-pressed information includes all surface waviness, complexity, irregularity, roughness and anisotropic properties.
Acknowledgements
The authors would like to thank Mr. Y. Miyauchi of Nissan Motor Co., Ltd. for his cooperation in these experiments.
REFERENCES
1) O. Kienzle and K. Mietzner: Atlas Umgeformter Metallisher Ober-flachen, 19, (Springer-Verlag, 1967).
2) K. Yamaguchi, S. Nishimura, N. Takakura and M. Hukuda: J. Japan Soc. Technol. Plast. (in Japanese),21–237 (1980) 909–916.
3) H.O. Peitgen and D. Saupe: The Science of Fractal Images, 45, (Springer-Verlag, 1988).
4) Y. Kurosaki, M. Matsui, T. Takayama and A. Nakanishi: JSME Int. J., Ser. C41–3 (1998) 485–492.
5) M. Matsui, Y. Kurosaki, M. B. Khamesee and K. Murai: J. Japan Soc. Technol. Plast.43–498 (2002) 644–648.
6) B. B. Mandelbrot,The Fractal Geometry of Nature, (Freeman, 1982). 7) M. Matsui, Y. Kurosaki and Y. Miyauchi: Proceedings of the 104th
[image:10.595.113.484.71.264.2]Conference of the Japan Institute of Light Metals (in Japanese), (2003) pp. 119–120.
Table 2 Parameters of,andfor each compression ratioeC.
Compression
0% 30% 65%
ratioeC
0.52 0.31 0.19
3.12 3.31 3.39
[image:10.595.47.290.317.380.2]93 1 1