An Analytical Study of Financial Performance Using Ratio Analysis of
Public Sector Enterprises with Special Reference to “SAIL”
Jyoti Verma
Research Scholar, Department of Commerce, S.S.V. College (Hapur) C.C.S. University (Meerut), Uttar Pradesh, India
Email – [email protected]
1. INTRODUCTION OF STEEL AUTHORITY OF INDIA LTD:
The Steel Authority of India Limited (SAIL), a Central Public Sector Enterprise (CPSE) having a status of Maharatna Company registered under the Companies Act, 1956. SAIL was incorporated on January 24, 1973. The headquarter is located at New Delhi. The Government of India owns about 75% of the company's equity and retains voting control of the company. SAIL is a major steel making company in India. It produces a wide variety of iron and steel products for domestic and industrial purpose at its five integrated steel plants located at Bhilai, Rourkela, Durgapur, Bokaro and Burnpur and three special and alloy steels plants located at Durgapur, Salem and Bhadravati. SAIL has its own Central Marketing Organisation (CMO) which is located at Kolkata to manage the countrywide marketing and distribution network. They are also one of the seven Maharatnas of the Central Public Sector Enterprises of the country. The company's International Trade Division (ITD), New Delhi-an ISO 9001: 2000 accredited unit of CMO, deals with the export of mild steel products and pig iron from SAIL's five integrated steel plants. With technical and managerial expertise and more than four decades of knowledge in steel making, the company's Consultancy Division (SAILCON) in New Delhi provides worldwide services and consultancy to clients. It has a total production capacity of 11 million tons of steel per year, which represents more than four-fifths of India's total capacity. In the year 1995, the company ventured into setting up a power project at Bhilai by the form joint venture with Larsen & Toubro and CEA, USA Inc. During the year 2004-05, the company entered into an agreement with GAIL for supply of natural gas for its integrated steel plants. The company got, 'Business world-FICCI-SEDF Corporate Social Responsibility Award - 2006. During the year 2007-08, the company in association with Tata Steel Ltd formed a joint venture company to mine coal blocks for securing assured coking coal supply to meet their increasing production needs. During the year 2009-10, the company added two warehouses and two customer contact offices to their distribution network. With this, the company's marketing network has expanded to 37 branch sales offices (BSOs), 26 customer contact offices (CCOs) and 67 Warehouses. In February 13, 2011, the company formally acquired 50% of the shares held by the Government of Kerala (GoK) in Steel Complex Limited (SCL), Kozhikode and taken over the operations of SCL. In 2013, the company won PSE Excellence Award-2013 for CSR & Sustainability and SAIL Bhilai Steel Plant bags the National Energy Conservation Award 2013. In 2014, ICVL acquires Rio Tinto's 2.6 Billion Tonnes coal resource in Mozambique. SAIL was awarded by PHD Chamber the Good Corporate Citizen Award in 2014. The company's Bhilai Steel Plant wins National Energy Conservation Award 2014. The authorised capital of SAIL is 5000 crores while the paid-up capital was 4130.52 crore as on 31.03.2014, out of which 80% is held by the Government of India and rest 20% by the Financial
Institutions/GDR holders/Banks/ Employees/Individuals etc. SAIL’s provides an employment to approx. 97897 people
Abstract: This paper aims to access the position of SAIL from the year 2000 to 2015. The present study analyzes the profitability and working capital management of SAIL with the help of relevant ratios, statistical tools like mean, standard deviation, minimum, and maximum, coefficient of variation etc. Profitability is the financial measure of corporate ability to earn profit. It can be measured through profitability ratio such as gross profit ratio, net profit ratio, return on capital employed etc. Working capital management involves the relationship between a firm's short-term assets (Current Assets) and its short-term liabilities (Current Liabilities). It reflects the corporate ability to continue its operation. It can be accessed through current ratio, liquid ratio, Current Assets Turnover Ratio, Total Assets Turnover Ratio, working capital turnover ratio, debtor turnover ratio, and inventory turnover ratio. Hence it was concluded that the overall performance of Steel Authority of India Ltd.
regarding profitability was declining during the study period, though the company’s sales are growing, and its
profitability was declining. The paper makes an assessment of management of working capital, observes the liquidity position and areas of weakness and also gives suggestions for removal of the weaknesses of the public sector enterprises with special reference to SAIL.
as on April 1, 2014. In 2015, the company has completed the current phase of the modernisation and expansion of the Bokaro Steel Plant with an investment of Rs 6,325 crore.
2. REVIEW OF LITERATURE:
Prof. K. Rajeshwar Rao (1998) undertook a study named “Project Planning in Public Enterprises in India”. It
introduces various intricacies in project management of public enterprises. The author has made an attempt to disclose the prevailing practices in public enterprises regarding project management with the identification of loopholes in them. Also a suitable model has been suggested at each stage.
Mohanlal (2004) studied working capital management in five non-profit organizations of Durban South Area-Chasasworth with the help of case study methodology. The researcher found that financial managers of the non-profit organizations under study were inadequately trained to manage the working capital due to which they did not implement the policies of the management to achieve the goals of the organizations.
Chris (2010) suggests that public sector compensation is becoming a high-profile policy issue. While private sector wages and benefits have stagnated during the recession, many govrnements continue to increase compensation for public sector workers. At the same time, concerns about heavy underfunding are increasing in public sector retirement schemes across the nation.
3. OBJECTIVES OF THE STUDY:
To analyze the profile of SAIL.
To evaluate the profit margins in relation to sales.
To study the profitability and working capital management of SAIL. To inspect liquidity conditions and areas of weakness.
To give suggestions on the basis of findings.
4. RESEARCH METHODOLOGY:
Method of Data Collection: The research is present entirely based upon secondary data and the data was collected from the official directory of the Bombay Stock Exchange, Iron and Steel Industry in India Reports, official website of SAIL (Annual Reports) and money control.
Time Period of the Study: The selected study is based on data during the period from 2000 to 2015, covering a time period of 15 years.
Selection of the Sample: The sample was drawn from the list of companies coming under the top 10 steel sector companies listed at the Bombay Stock Exchange and one amongst them is Steel Authority of India.
Statistical Tools and Techniques: for the purpose of statistical analysis, Average, Standard deviation, Variance, Coefficient of variations, minimum, maximum & graphical analysis is done with the use of MS excels.
5. LIMITATIONS OF THE STUDY:
This study had the following limitations:
The selected company SAIL is a public sector company based in different states of India.
The study covers only 15 years period i.e. 2000-2001 to 2014-2015 for financial analysis of SAIL. The data used in this study is secondary.
The study covered only one out of all large size public sector companies in India.
6. DATA ANALYSIS AND INTERPRETATION:
This section presents the results of the profitability ratios and discussion on them. The financial ratios like gross profit margin, net profit margin, ROCE, D/E RATIO, Current Ratio, QUICK RATIO, Various turnover ratios were used and the significant relationship between them were tested by using the mean, standard deviation, minimum & maximum, Variance, coefficient of variance.
Gross profit Ratio
Table No.1
Year
Gross Profit (Crore)
Sales (Crore)
GP Ratio (In %)
2000-01 -729 16233 -4.49
2001-02 -1707 15502 -11.01
2002-03 -316 19207 -1.65
2004-05 9365 31805 29.45
2005-06 5706 32280 17.68
2006-07 9423 39189 24.05
2007-08 11469 45555 25.18
2008-09 9399 48738 19.28
2009-10 10132 43935 23.06
2010-11 7194 47041 15.29
2011-12 5151 50348 10.23
2012-13 3241 49350 6.57
2013-14 3225 51866 6.22
2014-15 2359 50627 4.66
Mean 5102.67 37723.60 11.69
S.D 4278.19 13410.82 11.80
Variance 18302901.7 179850020.1 139.24
Figure No.1
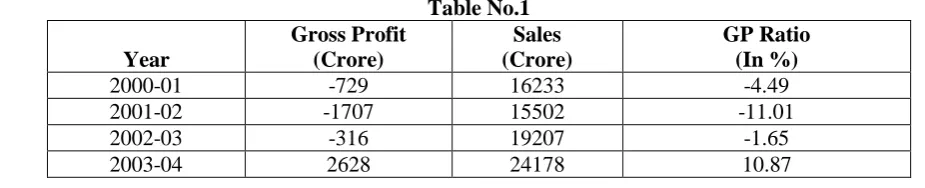
Based on Table No.1 & Figure No.1, it is observed that GP ratio showed fluctuating trend of GP and sales for the period from 2000-01 and 2014-15,the lowest ratio (-11.01) was observed in the year 2001-02, and the highest ratio (about 29.45) was evidenced in the year 2004-05. The coefficient of variance was 139.24%. The average GP was 11.69% during the study period. It can be seen that the gross profit is fluctuated form the year 2000 to 2015.
Net Profit Ratios
Table No.2
Year
Net Profit (Crore)
Sales (Crore)
NP Ratio (In %)
2000-01 -729 16233 -4.49
2001-02 -1707 15502 -11.01
2002-03 -304 19207 -1.58
2003-04 2512 24178 10.39
2004-05 6817 31805 21.43
2005-06 4013 32280 12.43
2006-07 6202 39189 15.83
2007-08 7537 45555 16.54
2008-09 6170 48738 12.66
2009-10 6754 43935 15.37
2010-11 4905 47041 10.43
2011-12 3543 50348 7.04
2012-13 2170 49350 4.40
-10000 0 10000 20000 30000 40000 50000 60000 70000
20
00-01
20
01-02
20
02-03
20
03-04
20
04-05
20
05-06
20
06
-07
20
07-08
20
08-09
20
09-10
20
10-11
20
11-12
20
12-13
20
13-14
20
14-15
GP &
N
e
t
Sal
e
s
(i
n
R
s.
Cr
)
&
GPR
in
% Gross Profit Ratio
Sales
2013-14 2616 51866 5.04
2014-15 2093 50627 4.13
Mean 3506.13 37723.60 7.91
S.D 2921.97 13410.82 8.74
Variance 8537886.55 179850020.1 76.32
Figure No.2
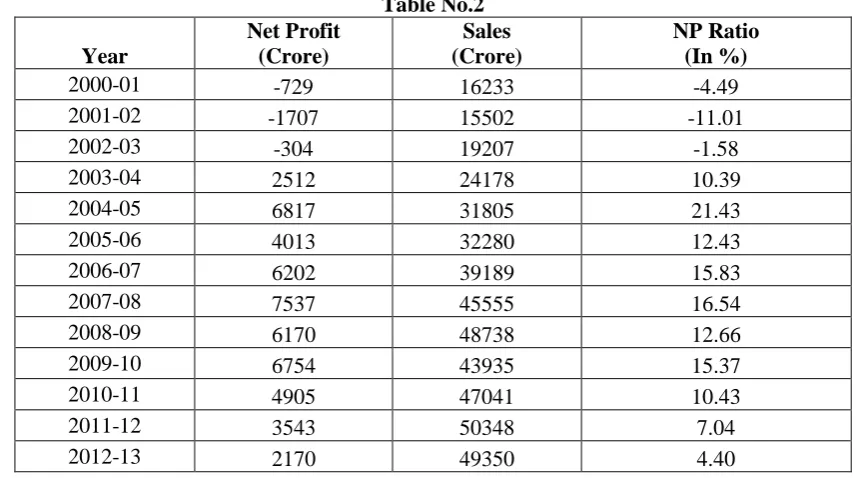
Based on Table No.2 & Figure No.2, it is observed that the NP ratio of the company was volatile during the study period. The lowest NPR percent was observed in the year 2001-02,where it was -11.01%,and the highest value was observed during the year 2004- 05,when it was 21.43%. The average NPR stood at 7.91%. The coefficient of variation was 76.32%. It showed a fluctuating trend during the study period and a poor performance was observed for years.
RETURN ON CAPITAL EMPLOYED (ROCE)
(A)ROCE (Based on G.P.)
Table No.3 (A)
Year
Gross Profit (Crore)
Capital Employed
(Crore) ROCE (In %)
2000-01 -729 18265 -3.99
2001-02 -1707 17056 -10.01
2002-03 -316 16541 -1.91
2003-04 2628 15218 17.27
2004-05 9365 20064 46.68
2005-06 5706 21782 26.20
2006-07 9423 25476 36.99
2007-08 11469 28450 40.31
2008-09 9399 34704 27.08
2009-10 10132 41696 24.30
2010-11 7194 39431 18.24
2011-12 5151 32921 15.65
2012-13 3241 31381 10.33
2013-14 3225 38450 8.39
2014-15 2359 48314 4.88
Mean 5102.67 28649.93 17.36
S.D 4278.19 10460.16 16.60
Variance 18302901.7 109415025.2 275.58
-10000 0 10000 20000 30000 40000 50000 60000
20
00-01
20
01-02
20
02-03
20
03-04
20
04-05
20
05-06
20
06-07
20
07-08
20
08-09
20
09-10
20
10-11
20
11-12
20
12-13
20
13-14
20
14-15
N
e
t
Pr
o
fi
t
&
N
e
t
Sal
e
s
(i
n
R
s.
C
r)
&
N
PR
in
% Net Profit Ratio (In %)
Sales (Crore)
Figure No.3(A)
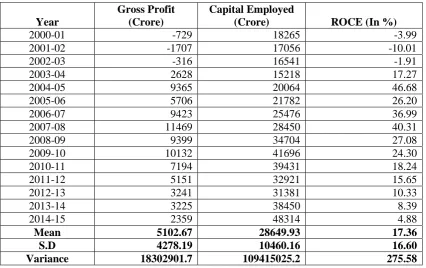
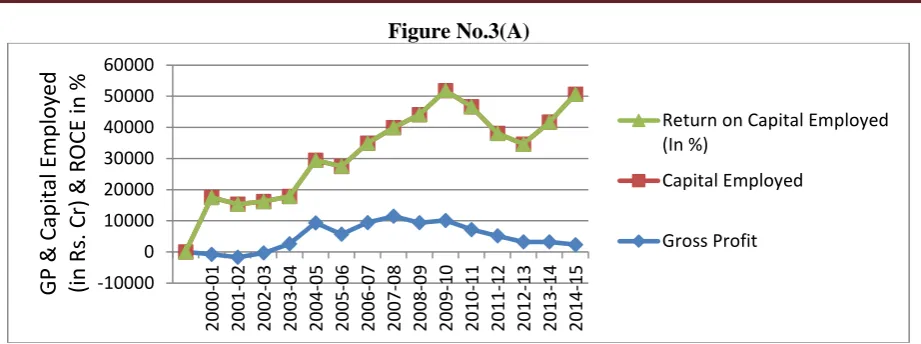
Based on Table No.3(A) & Figure No.3(A), it is observed that The ratio varies from -3.99% in 2000-01 to 4.88% in 2014-15 during the period. The lowest ROCE percent was observed in the year 2001-02 where it was -10.01%,and the highest value was observed during the year 2004- 05,when it was 46.68%. The average NPR stood at 17.36%. The coefficient of variation was 275.58%.
ROCE (Based on N.P)
Table No.3(B)
Year
Net Profit (In Crore)
Capital
Employed(Crore)
ROCE (In %)
2000-01 -729 18265 -3.99
2001-02 -1707 17056 -10.01
2002-03 -304 16541 -1.84
2003-04 2512 15218 16.51
2004-05 6817 20064 33.98
2005-06 4013 21782 18.42
2006-07 6202 25476 24.34
2007-08 7537 28450 26.49
2008-09 6170 34704 17.78
2009-10 6754 41696 16.20
2010-11 4905 39431 12.44
2011-12 3543 32921 10.76
2012-13 2170 31381 6.92
2013-14 2616 38450 6.80
2014-15 2093 48314 4.33
Mean 3506.13 28649.93 11.94
S.D. 2921.97 10460.16 11.96
Variance 8537886.552 109415025.2 143.06
Figure No.3(B) -10000 0 10000 20000 30000 40000 50000 60000 20 00-01 20 01-02 20 02-03 20 03-04 20 04-05 20 05-06 20 06-07 20 07-08 20 08-09 20 09-10 20 10-11 20 11-12 20 12-13 20 13-14 20 14-15
GP
&
C
ap
it
al
Emp
lo
yed
(in
Rs
. C
r) &
R
OC
E
in
%
Return on Capital Employed (In %) Capital Employed Gross Profit -10000 0 10000 20000 30000 40000 50000 60000 20 00 -01 20 01-02 20 02-03 20 03-04 20 04-05 20 05-06 20 06-07 20 07-08 20 08-09 20 09-10 20 10-11 20 11-12 20 12-13 20 13-14 20 14-15
N
et
Pr
of
it
& Cap
it
al
Emp
lo
yed
(in
Rs
. Cr) &
R
OC
E
in
%
Return on Capital Employed(In %)Capital Employed(Crore)
Based on Table No.3(B) & Figure No.3(B), it is observed that the ROCE witnessed a fluctuating trend during the period. The ratio ranges from -3.99% in 2000-01 to 4.33% in 2014-15 with the mean of 11.94% during the period with coefficient of variation 143.06%. The lowest ROCE percent was observed in the year 2001-02,where it was -10.01%,and the highest value was observed during the year 2004- 05,when it was 33.98%.
DEBT-EQUITY RATIO
Table No.4
Year Debt Equity D/E Ratio (in Times)
2000-01 14251 4165 3.42
2001-02 14019 2252.10 6.23
2002-03 12928 1988.93 6.50
2003-04 8690 4659.17 1.87
2004-05 5770 10010.72 0.58
2005-06 4298 12386 0.35
2006-07 4181 17184 0.24
2007-08 3045 23004 0.13
2008-09 7563 28148 0.27
2009-10 16511 33317 0.50
2010-11 19375 37069 0.52
2011-12 16320 39811 0.41
2012-13 21597 41025 0.53
2013-14 25281 42666 0.59
2014-15 29898 43505 0.70
Mean 13581.8 22746.06 1.52
S.D 8127.583793 16086.63 2.14
Variance 66057618.31 258779768 4.56
Figure No.4
Based on Table No.4 & Figure No.4, it is observed that the table registered a fluctuating trend during the period. The decreasing trend from 2004-05 onwards demonstrates a sound long-term solvency position of SAIL. It indicates the fact that the SAIL has generated its own funds for further expansion,instead of relying on the external equity for its growth. This is a favourable situation with decreased burden of interest and increased profitability,the dividend payment and the retained earnings. The lowest ratio is -0.13Times in 2007-08 to and the highest is 6.50Times in 2002-03 with the mean of 1.52Times during the period with coefficient of variation 4.56Times.
CURRENT RATIO
Table No.5
Year
Current Assets (Crore)
Current Liabilities (Crore)
Current Ratio (In Times)
2000-01 8362 5274 1.59
2001-02 7107 4849 1.47
0 1 2 3 4 5 6 7
20
00-01
20
01-02
20
02
-03
20
03-04
20
04-05
20
05-06
20
06-07
20
07-08
20
08-09
20
09
-10
20
10-11
20
11-12
20
12-13
20
13-14
20
14-15
D
eb
t/
Eq
u
it
y
Ra
tio
of
SAIL
(No
in
Tim
es)
2002-03 7282 4777 1.52
2003-04 8075 6025 1.34
2004-05 14187 6608 2.15
2005-06 17384 8108 2.14
2006-07 20379 6500 3.14
2007-08 26318 9439 2.79
2008-09 34676 12277 2.82
2009-10 39154 11073 3.54
2010-11 36544 12172 3.00
2011-12 28431 12252 2.32
2012-13 27616 13012 2.12
2013-14 26891 15212 1.77
2014-15 28482 16338 1.74
Mean 22059.2 9594.4 2.23
S.D 11107.26 3869.88 0.68
Variance 123371165.2 14975935 0.47
Figure No.5
Based on Table No.4 & Figure No.4, it is observed that In case of current ratio,SAIL also registered a fluctuating trend during the period. The ratio varies from 1.59Times in 2000-01 to 1.74Times in 2014-15 with the average ratio of 2.23Times with the coefficient of variation 0.47Times during the period. The ratio has been well above 2Times in all years except in the years 2000-01,2001-02,2002-03,2003-04,2013-14 and 2014-15 respectively. Except these six years, the ratio has been somewhere on the path of achieving a satisfactory ratio. The management should try to stick to the general norm of 2:1 only.
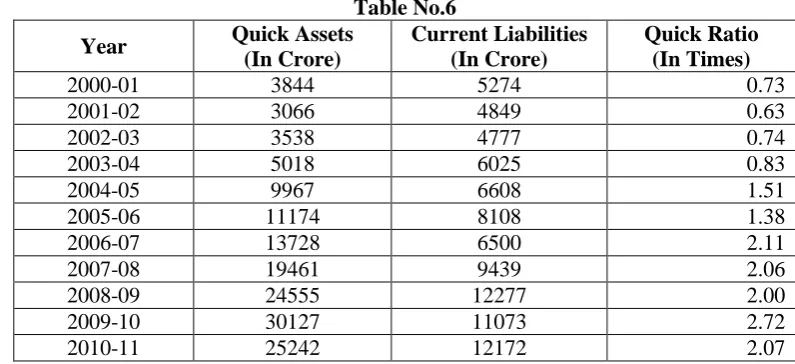
ACID TEST OR QUICK RATIO
Table No.6
Year Quick Assets
(In Crore)
Current Liabilities (In Crore)
Quick Ratio (In Times)
2000-01 3844 5274 0.73
2001-02 3066 4849 0.63
2002-03 3538 4777 0.74
2003-04 5018 6025 0.83
2004-05 9967 6608 1.51
2005-06 11174 8108 1.38
2006-07 13728 6500 2.11
2007-08 19461 9439 2.06
2008-09 24555 12277 2.00
2009-10 30127 11073 2.72
2010-11 25242 12172 2.07
0 10000 20000 30000 40000 50000 60000
20
00-01
20
01
-02
20
02-03
20
03-04
20
04-05
20
05-06
20
06-07
20
07-08
20
08-09
20
09-10
20
10-11
20
11-12
20
12-13
20
13-14
20
14-15
Curr
en
t
As
se
ts
&
Cu
rre
n
t
Lia
b
ili
ties
(in
Rs
. Cr)
&
CR
in
T
im
es
Current Ratio (In Times)
Current Liabilities (Crore)
2011-12 14689 12252 1.20
2012-13 11608 13012 0.89
2013-14 11691 15212 0.77
2014-15 10747 16338 0.66
Mean 13230.33 9594.4 1.35
S.D. 8358.35 3869.88 0.68
Variance 69862080.1 14975934.83 0.47
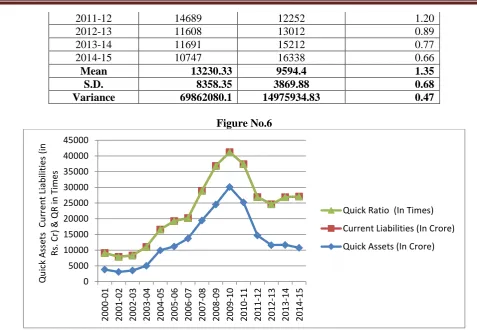
Figure No.6
Based on Table No.6 & Figure No.6, it is observed that In SAIL the ratio varies from 0.73Times in 2000-01 to 0.66Times in 2014-15 with the average ratio of 1.35Times with the coefficient variance of 0.47Times during the period. Here,the ratio has been well above 1 in the years 2004-05 to 2011-12. It clearly indicates the excess of liquid assets over the current liabilities during the period. It is a good sign as far as the short-term liquidity of the firm concerned. But,it indicates over-investment in the liquid assets too. The quick ratio considered as ideal is 1:1.
TOTAL ASSETS TURNOVER RATIO
Table No.7
Year
Sales (In Crore)
Total Assets (In Crore)
Total Assets Turnover Ratio
(In Times)
2000-01 16233 23539 0.69
2001-02 15502 21905 0.71
2002-03 19207 21318 0.90
2003-04 24178 21243 1.14
2004-05 31805 26672 1.19
2005-06 32280 29546 1.09
2006-07 39189 31976 1.23
2007-08 45555 37889 1.20
2008-09 48738 46981 1.04
2009-10 43935 52769 0.83
2010-11 47041 51603 0.91
2011-12 50348 45173 1.11
2012-13 49350 44393 1.11
2013-14 51866 53662 0.97
2014-15 50627 64652 0.78
Mean 37723.60 38221.4 0.99
S.D 13410.82 14127.96 0.18
Variance 179850020.1 199599150 0.033
0 5000 10000 15000 20000 25000 30000 35000 40000 45000
20
00-01
20
01-02
20
02-03
20
03-04
20
04-05
20
05-06
20
06-07
20
07-08
20
08-09
20
09
-10
20
10-11
20
11-12
20
12-13
20
13-14
20
14-15
Qu
ick
As
se
ts
Cu
rre
n
t
Lia
b
ili
ties
(in
Rs
. Cr)
&
Q
R in
Ti
m
es
Quick Ratio (In Times)
Current Liabilities (In Crore)
Figure No.7
Based on Table No.4 & Figure No.4, it is observed that the ratio varies from 0.69Times in 2000-01 to 0.78Times in 2014-15 with the average ratio of 0.99Times with the coefficient variance of 0.033Times during the period. This ratio measures a firm's efficiency in the use of its assets. A high ratio represents the efficient use of total assets in generating sales. So it is clear that the company has a good position in the year 2003-04 to 2008-09 and 2011-12 to 2012-13 as the company is utilizing the total assets in generating sales efficiently. The ratio is lowest 0.69Times in the year 2000-01.The ratio is highest in 2006-07 with the figure of 1.23 times showing that the total assets are turning into sales very swiftly.
CURRENT ASSETS TURNOVER RATIO
Table No.8
Year Sales (In
Crore)
Current Assets (In Crore)
Current Assets Turnover Ratio (In Times)
2000-01 16233 8362 1.94
2001-02 15502 7107 2.18
2002-03 19207 7282 2.64
2003-04 24178 8075 2.99
2004-05 31805 14187 2.24
2005-06 32280 17384 1.86
2006-07 39189 20379 1.92
2007-08 45555 26318 1.73
2008-09 48738 34676 1.41
2009-10 43935 39154 1.12
2010-11 47041 36544 1.29
2011-12 50348 28431 1.77
2012-13 49350 27616 1.79
2013-14 51866 26891 1.93
2014-15 50627 28482 1.78
Mean 37723.60 22059.2 1.91
S.D 13410.82 11107.26 0.48
Variance 179850020.1 123371165.2 0.23
0 20000 40000 60000 80000 100000 120000 140000
20
00-01
20
01-02
20
02-03
20
03-04
20
04-05
20
05-06
20
06-07
20
07-08
20
08-09
20
09-10
20
10-11
20
11
-12
20
12-13
20
13-14
20
14-15
Sale
s
& T
otal
Asse
ts
(in
Rs
. C
r) &
Total
Asse
ts
Tu
rn
ov
er
Ra
tio
(in
Tim
es)
Total Assets Turnover Ratio (In Times)
Total Assets (In Crore)
Figure No.8
Based on Table No.8 & Figure No.8, it is observed that the ratio varies from 1.94Times in 2000-01 to 1.78Times in 2014-15 with the average ratio of 1.91Times with the coefficient variance of 0.23Times during the period. This ratio measures a firm's efficiency in the use of its current assets. A high ratio represents the efficient use of current assets in generating sales. The ratio is lowest 1.12Times in the year 2009-10. The ratio is highest in 2003-04 with the figure of 2.99Times showing that the current assets are turning into sales very swiftly.
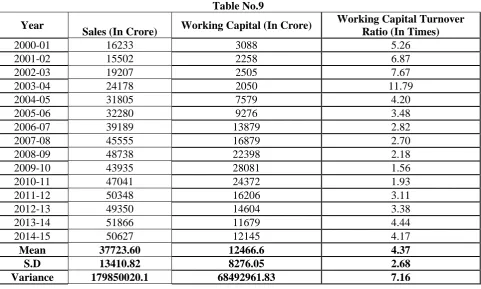
WORKING CAPITAL TURNOVER RATIO
Table No.9
Year
Sales (In Crore) Working Capital (In Crore)
Working Capital Turnover Ratio (In Times)
2000-01 16233 3088 5.26
2001-02 15502 2258 6.87
2002-03 19207 2505 7.67
2003-04 24178 2050 11.79
2004-05 31805 7579 4.20
2005-06 32280 9276 3.48
2006-07 39189 13879 2.82
2007-08 45555 16879 2.70
2008-09 48738 22398 2.18
2009-10 43935 28081 1.56
2010-11 47041 24372 1.93
2011-12 50348 16206 3.11
2012-13 49350 14604 3.38
2013-14 51866 11679 4.44
2014-15 50627 12145 4.17
Mean 37723.60 12466.6 4.37
S.D 13410.82 8276.05 2.68
Variance 179850020.1 68492961.83 7.16
0 10000 20000 30000 40000 50000 60000 70000 80000 90000
20
00-01
20
01-02
20
02-03
20
03-04
20
04-05
20
05-06
20
06-07
20
07-08
20
08-09
20
09
-10
20
10-11
20
11-12
20
12-13
20
13-14
20
14-15
Sale
s
& Cu
rr
en
t
Asse
ts
(in
Rs
. Cr) &
C
u
rr
en
t
Asse
ts
Tu
rn
ov
er
Ra
tio
(in
Tim
es)
Current Assets Turnover Ratio (In Times)
Current Assets (In Crore)
Figure No.9
Based on Table No.9 & Figure No.9, it is observed that the ratio varies from 5.26Times in 2000-01 to 4.17Times in 2014-15 with the average ratio of 4.37Times with the coefficient variance of 7.16Times during the period. This ratio measures a firm's efficiency in using its working capital. A high ratio represents the efficient use of working capital in generating sales. The ratio is lowest 1.56Times in the year 2009-10. The ratio is highest in 2003-04 with the figure of 11.79Times showing that working capital is turning into sales very swiftly.
RECEIVABLES TURNOVER RATIO
Table No.10
Year Receivables
(In Crore)
Turnover (In Crore)
Receivables Turnover Ratio (No in Times)
2000-01 1687 16233 9.62
2001-02 1389 15502 11.16
2002-03 1660 19207 11.57
2003-04 1549 24178 15.61
2004-05 1908 31805 16.67
2005-06 1881 32280 17.16
2006-07 2314 39189 16.94
2007-08 3048 45555 14.95
2008-09 3024 48738 16.12
2009-10 3493 43935 12.58
2010-11 4161 47041 11.31
2011-12 4748 50348 10.60
2012-13 4424 49350 11.16
2013-14 5481 51866 9.46
2014-15 3192 50627 15.86
Mean 2930.60 37723.60 13.38
S.D 1307.47 13410.82 2.85
Variance 1709473 179850020.1 8.16
0 10000 20000 30000 40000 50000 60000 70000 80000
20
00-01
20
01-02
20
02-03
20
03-04
20
04-05
20
05-06
20
06-07
20
07-08
20
08-09
20
09-10
20
10-11
20
11
-12
20
12-13
20
13-14
20
14-15
Sale
s
& W
or
kin
g
C
ap
it
al
(in
Rs
. Cr) &
W
or
kin
g
C
ap
it
al
Tu
rn
ov
er
Ra
tio
(in
Tim
es)
Working Capital Turnover Ratio (In Times)
Working Capital
Figure No.10
Based on Table No.10 & Figure No.10, it is observed that the ratio registered a fluctuating trend during the period that varies from 9.62Times in 2000-01 to 15.86Times in 2014-15 with the average ratio of 13.38Times with the coefficient variance of 8.16Times during the period. This ratio assists the company to know the collection and credit policies of the firm. It measures how efficiently management is managing its accounts receivable. A higher ratio represents a better debt policy than a lower ratio. The ratio is lowest 9.46Times in the year 2013-14.The ratio is highest in 2005-06 with the figure of 17.16Times showing that receivables are turning into sales very swiftly.
INVENTORY TURNOVER RATIO
Table No.11
Year
Inventory (In Crore)
Turnover (In Crore)
Inventory Turnover Ratio (in Times)
2000-01 4518 16233 3.59
2001-02 4041 15502 3.84
2002-03 3744 19207 5.13
2003-04 3057 24178 7.91
2004-05 4220 31805 7.54
2005-06 6210 32280 5.20
2006-07 6651 39189 5.89
2007-08 6857 45555 6.64
2008-09 10121 48738 4.82
2009-10 9027 43935 4.87
2010-11 11302 47041 4.16
2011-12 13742 50348 3.66
2012-13 16008 49350 3.08
2013-14 15200 51866 3.41
2014-15 17735 50627 2.85
Mean 8828.87 37723.60 4.84
S.D 4934.02 13410.82 1.58
Variance 24344547.7 179850020 2.49
0 10000 20000 30000 40000 50000 60000 70000
20
00-01
20
01-02
20
02-03
20
03-04
20
04-05
20
05-06
20
06-07
20
07-08
20
08-09
20
09-10
20
10-11
20
11-12
20
12
-13
20
13-14
20
14-15
R
eceiv
ab
les
&
Sales (in
R
s.
C
r)
&
R
eceiv
ab
les
Tu
rn
ov
er
Ra
tio
(in
Tim
es)
Receivables Turnover Ratio (No in Times)
Turnover
Figure No.11
Based on Table No.11 & Figure No.11, it is observed that in SAIL the ratio varies from 3.59Times in 2000-01 to 2.85Times in 2014-15 with the mean of 4.84Times and the coefficient of variance 2.49Times during the study period. The ratio is the lowest 2.85Times in 2014-15. The ratio is highest in 2003-04 with the figure of 7.91Times showing that inventory is turning into sales very swiftly. This ratio describes the relationship between goods sold in trade and the cost of inventory. This ratio indicates how fast inventory/ Stock is sold. A high ratio is good for the company. Low ratio indicated that stock is not sold or remains in a warehouse for a longer period of time.
7. FINDINGS AND SUGGESTIONS:
Ratio analysis enables stockholders,lenders,and the firm‟s mangers to evaluate the firm‟s performance. To achieve the main purpose of this study,the graphical analysis was used to find the profitability ratios of SAIL. The results are as follows:
The Company achieved a turnover of Rs.50,627 crore during 2014-15,which is lower by 2% over previous year,mainly on account of lower sales volume. In the beginning of the financial year 2014-15,steel prices which were at a high level started falling gradually every month from September 2014 onwards. At the end of the financial year 2014-15,steel prices reached the lowest level for the financial year.
The average gross profit was 11.69% during the study period. The net sales initially slowed down but again it started increasing. The average NPR stood at 7.91%. The coefficient of variation was 76.32%. It showed a fluctuating trend during the study period and a poor performance was observed for years.
In case of ROCE (based on G.P.),though SAIL has satisfied the requirement with the average of 17.36%. SAIL shows some promising future in this regard. In case of ROCE (based on N.P.), SAIL is the unit which has average ROCE of 11.94% and has been utilizing the resources more efficiently over all the years. SAIL has showed quite a sufficient amount of ROCE during the period.
The debt equity ratio of the company increased to 0.69:1 as on 31st March 2015 from 0.59:1 as on 31st March 2014 mainly on account of increase in borrowings during the year. The net worth of company improved from Rs. 42,666 crore as on 31st March 2014 to Rs. 43,505 crore as on 31st March 2015 and this helped in generation of internal resources for funding expansion plans of SAIL. During the Financial Year 2014-15,the capital expenditure incurred was Rs. 6,840 crore.
SAIL registered a fluctuating trend of current ratio during the period. The ratio varies from 1.59Times in 2000-01 to 1.74Times in 2014-15. The management should try to stick to the general norm of 2:1 only. The quick Ratio varies from 0.73Times in 2000-01 to 0.66Times in 2014-15. The quick ratio considered as ideal is 1:1.
8. CONCLUSION AND RECOMMENDATIONS:
There should be more efficient utilization of current assets by the management. The increase in sales should correspond to the increase in current assets. Individual attention should be paid to the management of each component of current assets, viz. inventories, receivables and cash etc. A proper combination of long-term and short-term sources should be employed to finance working capital requirements, both of permanent and temporary nature. The accepted norms should also be considered with the personal choices while financing of working capital. As a rule, the permanent working capital should be financed from long-term sources, preferably the equity, while the variable working capital should be financed from short-term sources only. Earnings after taxes, which are available for common stockholders, were also low as compared to the sales volume of the company. This is due to the effect of high expenses on the costs of goods sold and other expenses. There should be strict adherence to following the standard norms of debt-equity ratio. Ceiling should be imposed on raising loans and debt to reduce the dependence on debt capital and avoid possible
0 10000 20000 30000 40000 50000 60000 70000 80000
20
00-01
20
01-02
20
02-03
20
03-04
20
04-05
20
05-06
20
06-07
20
07-08
20
08-09
20
09
-10
20
10-11
20
11-12
20
12-13
20
13-14
20
14-15
In
ven
tor
y
& S
ale
s
(in
Rs
.
C
r) &
In
ven
tor
y
Tu
rn
ov
er
Ra
tio
(in
T
ime
s)
Inventory Turnover Ratio (Noin Times)Turnover (In Crore)
insolvency in future. As far as the above analysis is concerned though SAIL is one of Maharatnas in PSUs, its profitability graph has fallen down that is producing a threat in front of the public sector enterprises of India.
REFERENCES: Journal Papers:
1. Khatik S. K., Varghese Titto (Jan.2013) “Financial Analysis of Steel Authority of India Limited (SAIL)” Research Journal(Madhya Bharti), pp.57-76.
2. Pandey, S.(2012). “Financial Structure and Profitability of IFCI Ltd.: An Empirical Analysis.” Indian Journal of
Finance, 6(10), pp.32-38.
3. Singh, D.P., (2012). “Working Capital Management and Profitability in the IT and Telecom Industry in India,
“Indian Journal of Finance, 6(3), pp.54-60.
Books:
4. Maheshwari, S.N. (2008). “ Cost and Management Accounting” Thirteenth Edition Reprint, Sultan Chand & Sons,
New Delhi. P.B31.
5. Pandey, I.M. (2006). “ Financial Managemet Text and Cases.” 9th Edition, Vikas Publishing House, New Delhi,
pp.43-49.
6. Chandra, B., Chouhan, V., & Goswami, S. (2012). “Analyzing Trends and Profitability Vis – A – Vis Working
Capital Management (WCM): A Study of Select Information Technology (IT) Organizations in India.” Indian Journal of Finance, 6 (7), pp.13-26.
Web References:
https://sail.co.in/financial-list/103