mandipine dihydrochloride. This paper describes three simple spectrophotometric methods for the estimation of manidipine using para-dimethylamino benzaldehyde (PDAB), N-napthylethylenediamine dihydrochloride (NEDD), and 3-methyl-2-benzothiazoniumhydrazone hydrochloride (MBTH) in the presence of ferric chloride.
Three visible spectrophotometic methods have been developed for the estimation of manidipine dihydrochloride in bulk and synthetic mixtures. The Þ rst method (A) was based on the formation of a yellow chromogen with 1% para-dimethylaminobenzaldehyde
INTRODUCTION
Manidipine dihydrochloride (1, 4-Dihydro-2, 6-dimethyl– 4-(3-nitrophenyl)-3, 5–pyridine dicarboxylic acid-2 -[4-(diphenylmethyl)-1-piperazinyl] ethyl methyl ester hydrochloride)[1] is a dihydropyridine type, long-acting
antihypertensive, calcium antagonist vasodilator drug.[2]
A literature survey revealed only a few HPLC methods reported for the determination of manidipine in biological ß uids.[3-6] Efforts were hence made to develop a simple,
sensitive, and selective visible spectrophotometric analytical procedure for bulk and synthetic mixtures containing
ABSTRACT
The present work describes three visible spectrophotometric methods for the quantitative estimation of Manidipine in bulk and synthetic mixtures. Method A is based on the reaction of the drug with para-dimethylaminobenzaldehyde
(PDAB) and methanolic sulfuric acid at room temperature to form a green chromogen measured at 436.97 nm. Method B is based on the reaction of the diazotized drug with N-napthylethylenediamine dihydrochloride
(NEDD) to form a pink chromogen measured at 550.20 nm. Method C utilizes the reaction of manidipine with 3-methyl-2-benzothiazoniumhydrazone hydrochloride (MBTH) in the presence of ferric chloride to form a product measured at 480.21 nm. Under optimized reaction conditions, the proposed methods were validated as per ICH guidelines. Linearity was obeyed in the concentration ranges of 25–125 μg/mlwith the following linear regression equations for methods A, B, and C, respectively: Y = 0.002829 X + 0.01319, Y = 0.002325 X + 0.004275, Y = 0.0035 X + 0.001039. The limits of detection and limits of quantiÞ cation for methods A, B and C were 1.2024 and 1.212 µg/mL; 0.9798 and 3.6451 µg/mL, and 3.672 and 2.969 µg/mL respectively. Recovery studies were carried out by using the standard addition method and the results were found to be satisfactory. All methods have been applied successfully for the estimation of manidipine dihydrochloride in bulk and synthetic mixtures.
Key words: 3-Methyl-2-benzothiazonium hydrazone hydrochloride, manidipine dihydrochloride, N-napthyl ethylene diamine dihydrochloride, para-diaminobenzaldehyde, visible Spectrophotometry
DOI: 10.4103/0975-1483.55752
Quantitative Analysis of Manidipine Dihydrochloride in Bulk and
Synthetic Mixtures by Visible Spectrophotometry
Lakshmi Sivasubramanian, Manikandan K, Venkatesan M, Lakshmi KS
Department of Pharmaceutical Analysis, SRM College of Pharmacy, SRM University, Kattankulathur-603 203, Tamilnadu, India
(PDAB) and methanolic sulphuric acid, which showed an absorbance maximum at 436.97 nm. The second method was based on the formation of a pink chromogen with N-napthylethylenediamine dihydrochloride (NEDD) which showed an absorbance maximum at 550.20 nm. Method C utilizes the reaction of manidipine with 3-methyl-2-benzothiazoniumhydrazone hydrochloride (MBTH) in the presence of ferric chloride to form a colored chromogen estimated at 480.21 nm. Beer’s law was obeyed in the concentration range of 25-125 µg/ mL. The results of analysis were validated statistically for all the methods and by recovery studies.
EXPERIMENTAL
Manidipine dihydrochloride (Torrent Laboratories, Gujarat), para-dimethylamino benzaldehyde (PDAB) (S.D. Fine Chem. India, certiÞ ed to be 98.5%), N-(1-naphthyl) ethylenediamine dihydrochloride (NEDD) (Central Drug house LTD, India, certiÞ ed to be 99.0%), and 3-methylbenzothiazolin-2-one hydrazone (MBTH) (Himedia Laboratories Pvt. Ltd., India, certiÞ ed to be 99.0%) were used. All other chemicals and solvents used were of analytical reagent grade. Spectral and absorbance measurements were made on PERKIN ELMER’s Lamda 25 UV/Vis spectrophotometer with 1 cm matched cuvettes. A standard stock solution was prepared by dissolving 25 mg of manidipine dihydrochloride in 5-6 mL of methanol and diluted to the mark in a 25 mL volumetric ß ask.
Method A
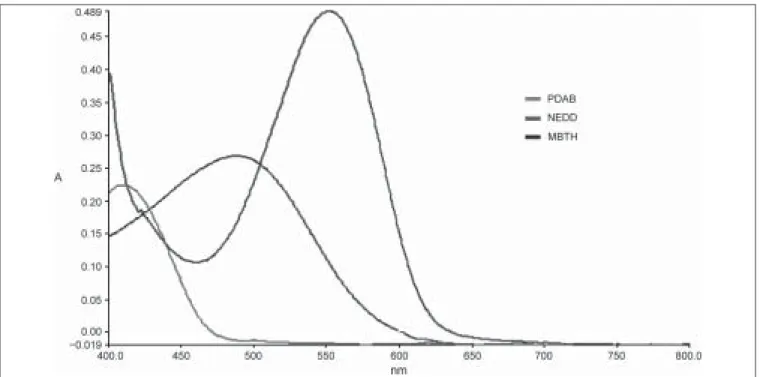
To a series of 10 mL volumetric ß asks, aliquots of a standard drug solution ranging from 0.25 to 1.25 mL (25-125 µg/mL) were added. This was followed by the addition of 1 mL of PDAB (1%) and 0.5 mL of methanolic sulphuric acid (0.1 M). The solutions were kept aside for three minutes and the volume was made up to 10 mL with methanol. The resulting yellow chromogen was measured at 436.97 nm against the reagent blank [Figure 1].
Method B
Aliquots of a standard drug solution ranging from 0.25 to 1.25 mL (25-125 µg/mL) were taken in a series of 10 mL volumetric ß asks. To each volumetric ß ask were added 1 mL of Hydrochloric acid, 1 mL of an aqueous solution of NaNO2, and 0.5 mL of an aqueous solution of ammonium sulfamate. The mixture was stirred for Þ ve min and the volume made up to the mark after adding 1 mL of NEDD solution. Solutions were then mixed thoroughly and the absorbance was measured at 550.90 nm agains thet reagent blank [Figure 1].
Method C
Aliquots of the standard drug solution ranging from 0.25 to 1.25 mL (25-125 µg/mL) were transferred into different 10 mL volumetric ß asks. To each, an aqueous solution of FeCl3 (1 mL, 0.1%) and an aqueous solution of MBTH
(1 mL, 0.2%) were added. The solutions were swirled and allowed to stand for Þ ve minutes and the Þ nal volume made up to the mark with the diluent, methanol: water (1:1). The absorbance was measured at 480.21 nm against the corresponding reagent blank [Figure 1].
RESULTS AND DISCUSSION
The primary nitro group of the drug, manidipine dihydrochloride, was subjected to reduction using zinc dust and 0.1 M hydrochloric acid. Reduction of the nitro group to an amino group was achieved after heating the solution at 70°C for ten minutes. The solution was then Þ ltered through Whatman Þ lter paper No. 41 for further analysis.
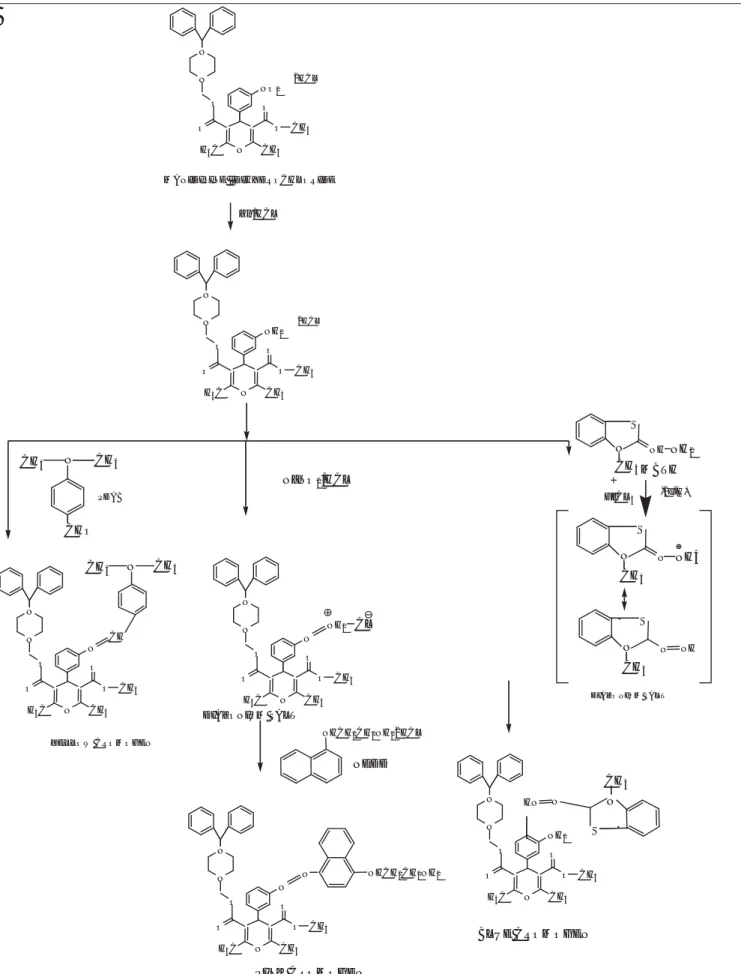
In method A, the primary amino group reacts with para- dimethylaminobenzaldehyde and methanolic sulphuric acid to yield a yellow chromogen showing maximum absorption at 436.97 nm. The second method includes diazotization of the primary amino group to form a diazonium salt. The resultant product was then coupled with NEDD to yield a purple azo dye. In the third method, the drug reacts with MBTH in the presence of FeCl3 to give a blue product. This is an iron-catalyzed, oxidative coupling reaction of MBTH with the drug. Under the oxidative reaction conditions, MBTH loses two electrons and one proton, forming an electrophilic intermediate that is the active coupling species. This intermediate undergoes electrophilic substitution with the drug to form the colored product. The reaction mechanisms for all methods are shown in Figure 2.
Optimization of reaction condition
Effect of reaction time
The inß uence of the reaction time on the absorbance of the product was studied on 75 µg/mL of manidipine dihydrochloride with different chromogenic reagents as mentioned under methods A, B and C. The optimum reaction time was found to be 15, 10, and 5 minutes for methods A, B and C respectively [Figure 3].
Effect of the concentration of reaction mixture
The inß uence of the reaction mixture on the absorbance of the colored product was investigated with 75 µg/mL of manidipine dihydrochloride for all the three methods. The optimum concentration of the reaction mixture was found to be 1% of PDAB and NEDD and 0.2% of MBTH for methods A, B and C respectively [Figure 4].
Validation of the proposed methods
Specifi city
The speciÞ city of the proposed methods was ascertained by the analysis of synthetic mixtures that were prepared with excipients such as lactose (100 mg), starch (40 mg), talc (240 mg), and magnesium stearate (120 µg).
Linearity
For evaluation of linearity, the contents of Manidipine dihydrochloride were determined at Þ ve concentration levels: 25, 50, 75, 100, and 125 µg/ml for methods A, B and C. Each concentration was independently analyzed (Þ ve times). The instrumental absorbance was plotted against each concentration of Manidipine dihydrochloride and the linear regression equation was evaluated by statistical treatment of calibration data. The other regression characteristics were calculated using an Excel worksheet. The limits of detection and quantitation were calculated using the relations:
LOD = 3.3 × S0/b
LOQ = 10 × S0/b
Where S0 is the standard deviation of the calibration line and b is the slope.
Precision
Three concentration levels of a reference Manidipine dihydrochloride solution were selected within the linearity range of methods A, B and C: 50, 75, and 100 µg/mL. Five independent analyses at each concentration level were performed within one day (intraday precision). This analysis was repeated for Þ ve consecutive days (interday precision).
Accuracy
The accuracy of the method was evaluated by the standard addition technique. A known amount of standard was added to the preanalyzed sample and the mixture was reanalyzed by all the proposed methods.
CONCLUSION
Figure 2: Reaction mechanism for methods A, B and C chromogen
N N
N O
O O
O
CH3
H3C
NO2
CH3
2HCL
Zn/HCL
N N
N O
O O
O
CH3
H3C
NH2
CH3
2HCL
CHO
N CH3
CH3
PDAB
N N
N O
O O
O
CH3
H3C
N
CH3
CH
N CH3
CH3
YELLOW CROMOGEN
NHCH2CH2NH2
N N
N O
O O
O
CH3
H3C
N
CH3
NH2
NaNO2/HCL
CL
N N
N O
O O
O
CH3
H3C
N
CH3
N
PINK CROMOGEN
NHCH2CH2NH22HCL
MANIDIPINE DIHYDROCHLORIDE
N S
NH NH2
CH3MBTH
FeCL3
N S
N
CH3
NH4
N∗
S
N
CH3
NH
DIAZONIUM SALT
-2e,-H+
N N
N O
O O
O
CH3
H3C
NH2
CH3
N∗
S
N
CH3
HN
BLUE CROMOGEN NEDD
REFERENCES
1. Budavari S, editor. In: The Merck Index, 13th ed. Whitehouse Station, NJ: Merck and Co., Inc; 2001. p. 917.
2. Otero ML. Manidipine-delapril combination in the management of hypertension. Vasc Health Risk Manage 2007;3:255-63.
3. Jing J, Ren W, Chen X, He H, Zhou W, Zhu X, et al. Determination and pharmacokinetics of manidipine in human plasma by HPLC/ESIMS. Biomed Chromatogr 2007;21:836-40.
4. Ragno G, Aiello F, Garofalo A, Ioele G, Sinicropi MS. Multivariate least squares regression applied to the spectrophotometric analysis of manidipine and its main photoproduct. Farmaco 2003;58:909-15.
5. Ohkubo T, Uno T, Sugawara K. Liquid chromatographic determination of manidipine in serum with electrochemical detection. J Chromatogr B 1996;687:413-8.
6. Tokuma Y, Noguchi H. Stereoselective pharmacokinetics of dihydropyridine calcium Antagonists. J Chromatogr A 1995;694:181-93.
Source of Support: Nil, Confl ict of Interest: None declared.
0 0.1 0.2 0.3 0.4 0.5
2
0 4 6 8 10 15 20 25 30 40 50 Time (min)
Absorbance
NEDD PDAB MBTH
Figure 3: Effect of time on absorbance for methods A, B and C
0 0.1 0.2 0.3 0.4 0.5
0.1 0.2 0.3 0.5 0.75 1 1.5 2 2.5 3 Concentration(% w/v )
Absorbance
PDAB NEDD MBTH
Figure 4: Effect of concentration on absorbance for methods A, B and C
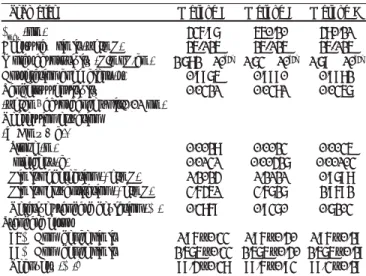
Table 1: Optical characteristics and other parameters
Parameter Method A Method B Method C
λmax (nm) 436.97 550.20 480.21
Beer’s law limit (µg/mL) 25-125 25-125 25-125
Molar absorptivity (L/moL.cm) 2.782 × 10[4] 1.73 × 10[4] 1.79 × 10[4]
Correlation coefÞ cient (r) 0.9975 0.9990 0.9982
Sandell’s sensitivity 0.0321 0.0381 0.0357
(µg/cm2 absorbance unit/0.01 nm)
Regression equation (Y = mx + c)*
Slope (m) 0.0028 0.0023 0.0035
Intercept (c) 0.0131 0.00427 0.00103
Limit of detection (μg/mL) 1.2024 1.2121 0.9798
Limit of quantitation (μg/mL) 3.6451 3.6727 2.9692
Relative standard deviation (%) 0.3869 0.9370 0.7203
Standard error
95% ConÞ dence limit 1.96 ± 0.33 1.96 ± 0.40 1.96 ± 0.29 99% ConÞ dence limit 2.575 ± 0.33 2.575 ± 0.40 2.575 ± 0.29
Recovery (%)a 99.4 ± 0.38 99.6 ± 0.93 99.3 ± 0.29
* With respect to Y = mx + c, where ‘c’ is intercept, ‘x’ is the concentration in µg/mL and ‘m’ is the Slope a With respect to Mean ± SD (n = 3)
INPHARM ASSOCIATION – MEMBERSHIP INFORMATION
Concrete benefi ts of membership include:
• A membership certiÞ cate and identity card
• The services provided throughout one’s lifetime (for life members).
• The experience gained by working with InPharm is excellent for building up a right career.
• InPharm is a step ladder for your professional growth. Opportunities are made available to the members for promoting their research, receiving national and international recognition, meeting and interacting with leaders in their Þ eld and meeting InPharm members of other chapters, who will also be future leaders.
Advantages
• InPharm provides national recognition for academic excellence in Pharmacy, a honor which can be noted on employment applications and resumes.
• Through membership in InPharm, students can gain a sense of community with others in Pharmacy discipline. InPharm provides a local, regional and national forum for obtaining information and developing perspectives about the Þ eld of Pharmacy, learning about educational and career opportunities and forming meaningful professional networks.
• On the national level, InPharm membership facilitates leadership development, interaction with other students who have similar interests and service to the institution sponsoring InPharm
• Members receive a membership card, certiÞ cate, and free communiqué, free webpharm CD, and regular e-mail notiÞ cations.
• InPharm chapter activities provide students with valuable opportunities to develop one-on-one relationships with teachers who can stimulate their interest in Pharmacy, involve them in research projects and write meaningful letters of recommendation for them. • InPharm encourages student research at the regional and national as well as local levels through undergraduate and graduate research
award competitions and recognizing their accomplishments at regional and national conferences.
• InPharm provides over Rs. 50,000/- annually as awards and grants to its Professional/student members, faculty advisors, and chapters. • InPharm sponsors outstanding programs at regional and national meetings.
• Members beneÞ t not only from the programs, but also from the opportunity to meet leading pharmacists and students from other chapters.