ACCESSIBILITY, TRAVEL BEHAVIOR, AND URBAN FORM CHANGE
Louis Ari Merlin
A dissertation submitted to the faculty of the University of North Carolina at Chapel Hill in partial fulfillment of the requirements for the degree of Doctor of
Philosophy in the Department of City and Regional Planning
Chapel Hill 2014
iii ABSTRACT
Louis Ari Merlin: Accessibility, Travel Behavior, and Urban Form Change (Under the direction of Dr. Yan Song)
Accessibility is a central concept for urban planning both from theoretical and practical perspectives. Theoretically, accessibility is a major driver of patterns of land value and residential density in metropolitan urban regions. Practically, planning for accessibility offers the opportunity to shift away from transportation planning’s historic focus on mobility (speed) and towards a focus on greater land use-transportation
integration. This dissertation takes as its premise that transportation planners ought to be planning for higher accessibility and traces some of its implications. Does higher
regional accessibility lead to the travel patterns that planners and travel behavior researchers expect? How are US metropolitan regions performing with regard to an accessibility-based performance benchmark over time?
There is broad consensus among transportation researchers that accessibility measures indicate the ease of access to opportunities across space. Theoretically, we expect households in such high accessibility areas to travel less in distance on a per trip basis, but with greater trip frequency and with a greater range of choices than similar households in lower accessibility areas. This dissertation explores the connection
between high accessibility locations and such types of travel patterns. In specific, two of the three dissertation papers explore the accessibility-travel behavior relationship:
iv
Participation? These two papers ask what types of built environments are associated with more localized travel and more frequent travel. Interestingly, both of these papers find that local accessibility may be more important for supporting these desired travel patterns than regional accessibility.
Furthermore, if planners should be planning for higher regional accessibility for households, how are metropolitan planning agencies performing based upon this metric? This is the question asked by the third dissertation paper, Changing Accessibility in US Metropolitan Areas. This paper examines the accessibility performance of four
v
ACKNOWLEDGEMENTS
Thanks to my wife, Ki-Wing, for allowing this no-longer-young man to pursue his dreams of a Ph.D. and an academic career. Thanks to my boys, Isaac and Sam, for
providing a constantly available and ready-made distraction from the doldrums of doctoral student existence!
Thanks to my many advisors, without whom I could not have made it this far. First, my dissertation advisor, Dr. Yan Song, whom I could reliably turn to for thoughtful advice. Then Dr. Daniel Rodriguez, who also frequently provided a listening ear for my meandering musings. Thanks to the rest of my dissertation committee, Dr. Noreen McDonald, Dr. David Godschalk, and Dr. Thomas Lester, who each provided valuable feedback on the dissertation as a whole as well as on specific papers and helping to get them in shape for publication.
Thanks to the many doctoral students who provided advice and support along the way. Dr. Ward Lyles, Dr. Hye-Sung Han, soon-to-be Dr. Danielle Spurlock, Ke Peng, David Fuente, Allan Freyer, Gwen Kash, Joshu Shih, Erik Vergel, and Tony Sease.
Thanks to the Royster Society of Fellows, for invaluable financial and moral support. Thanks to Dr. David Pfenning for his leadership of the Royster Society over the last two years.
vi
TABLE OF CONTENTS
List of Tables ... x
List of Figures ... xii
Chapter 1: Accessibility, Travel Behavior, and Urban Form ... 1
1.1 Accessibility in Contemporary Planning Practice... 1
1.1.a Accessibility vs. Mobility Debate ... 1
1.1.b Accessibility and New Planning Goals ... 4
1.2 Three Views on Accessibility: Bid Rent, Travel Behavior, and Performance Measures ... 6
1.2.a Bid Rent Theory: Accessibility as a Descriptor of Urban Form ... 8
1.2.b Accessibility and Travel Behavior ... 10
1.2.c Accessibility as a Performance Measure ... 11
1.2.d Excess Commuting: The Urban Form-Travel Behavior Connection ... 13
1.3 Research Questions ... 15
1.4 Defining and Measuring Accessibility ... 17
1.5 The Monocentric Model in a Polycentric Era ... 18
1.6 Accessibility and Travel Behavior Research ... 23
1.7 Summary of Research Questions for the Three Papers ... 24
1.7.a Measuring Complete Communities... 24
1.7.b Does Accessibility Influence Nonwork Activity Participation ... 25
1.7.c Changing Accessibility in US Metropolitan Areas ... 27
vii
Chapter 2: Measuring Community Completeness: Jobs-Housing Balance,
Accessibility, and Convenient Local Access to Nonwork Destinations ... 30
2.1 Abstract ... 30
2.2 Introduction ... 30
2.2.a Literature Review ... 34
2.3 Methods... 38
2.3.a Geographies under Analysis ... 38
2.3.b Measuring Urban Form ... 40
2.3.c Internal Tour Capture/Internal Trip Capture ... 46
2.3.d Analysis ... 47
2.4 Results ... 48
2.4.a Descriptive Statistics ... 48
2.4.b Regression Results ... 52
2.5 Discussion and Conclusions ... 57
Chapter 3: Does Accessibility Influence Nonwork Activity Participation? An Analysis with National Data ... 62
3.1 Abstract ... 62
3.2 Introduction ... 63
3.3 Literature Review ... 65
3.4 Methods and Measures ... 70
3.5 Results ... 81
3.5.a Descriptive Statistics ... 81
3.5.b Directional Influence of Built Environment Variables ... 86
3.5.c Aggregate Effect of Built Environment Variables ... 90
3.6 Discussion ... 95
viii
Chapter 4: Changing Accessibility in US Metropolitan Areas:
The Influence of Changing Urban Form and Travel Times ... 99
4.1 Abstract ... 99
4.2 Introduction ... 99
4.2.a Literature Review ... 101
4.2.b Research Questions and Hypotheses ... 105
4.3 Methods... 106
4.3.a Urban Form: Residential and Employment Locations ... 111
4.3.b Accessibility Measures and Decomposition ... 112
4.3.c Travel Times ... 114
4.3.d Impedance of Travel Time ... 115
4.4 Results ... 116
4.4.a Changing Metropolitan Accessibility over Time ... 116
4.4.b Accessibility Decomposition ... 117
4.4.c Spatial Patterns of Accessibility Change ... 120
4.5 Discussion ... 123
4.5.a Accessibility Trends for Transit vs. Auto Modes ... 125
4.5.b Coordination of Land Use and Transportation ... 126
4.5.c Implications for Policy ... 127
4.5.d Study Limitations ... 128
4.6 Conclusion ... 129
Chapter 5: Conclusion: Implications and Future Research ... 132
5.1 Introduction ... 132
5.2 Summary of Findings ... 134
5.2.a Measuring Complete Communities... 134
ix
5.2.c Changing Accessibility in US Metropolitan Areas ... 135
5.2.d Research Limitations ... 136
5.3 Implications for Practice and Research ... 137
5.3.a Implications for Planning Practice ... 137
5.3.b Barriers to Planning for Denser Infill Development ... 141
5.3.c Implications for Planning Research ... 142
5.3.d Additional Research Inquiries into the Value Accessibility ... 144
Appendix I – Coefficients for Categorical Built Environment Variables ... 146
Appendix II – Negative Binomial vs. Quasi-Poisson Model ... 150
x
LIST OF TABLES
Table 1-1: Papers Applying Bid Rent Theory to Polycentric/Dispersed Urban Areas ... 21
Table 2-1: NAICS Job Types Associated with NHTS Trip Purposes ... 44
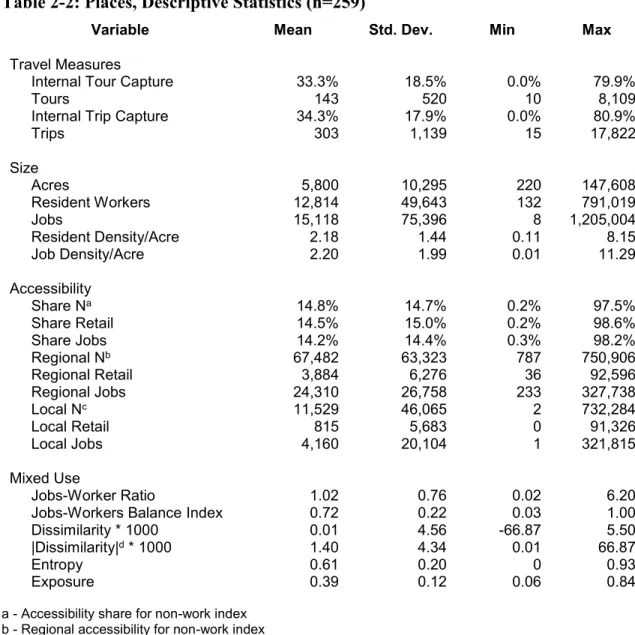
Table 2-2: Places, Descriptive Statistics (n=259) ... 50
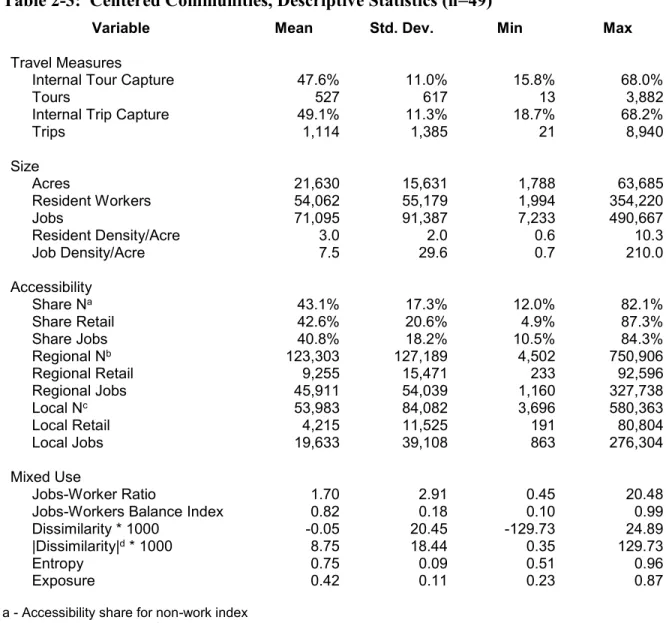
Table 2-3: Centered Communities, Descriptive Statistics (n=49) ... 51
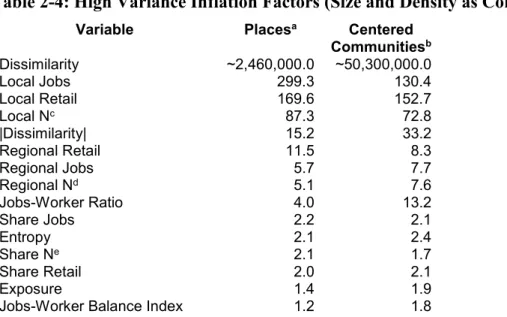
Table 2-4: High Variance Inflation Factors (Size and Density as Controls) ... 52
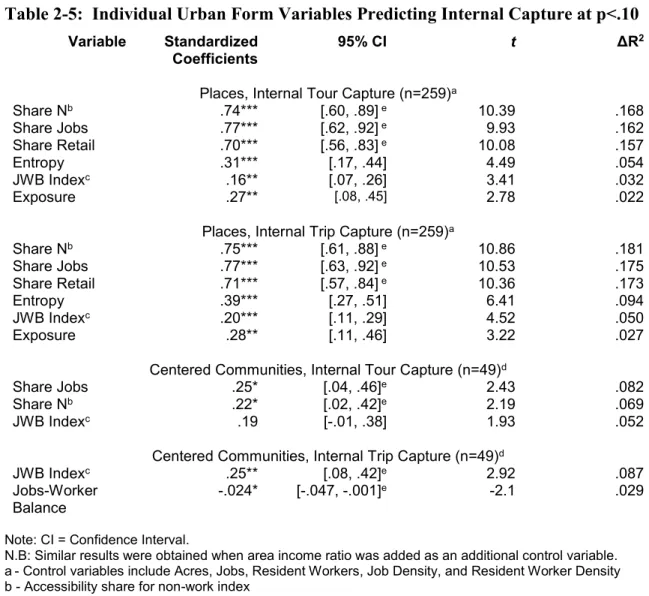
Table 2-5: Individual Urban Form Variables Predicting Internal Capture at p<.10 ... 54
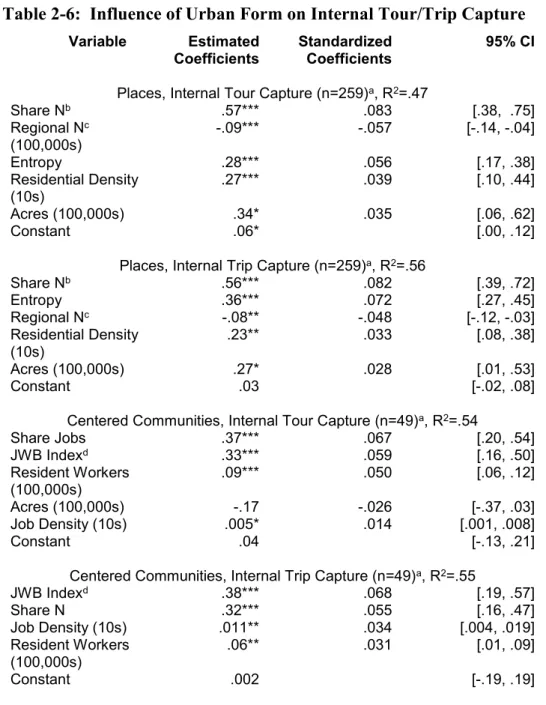
Table 2-6: Influence of Urban Form on Internal Tour/Trip Capture ... 58
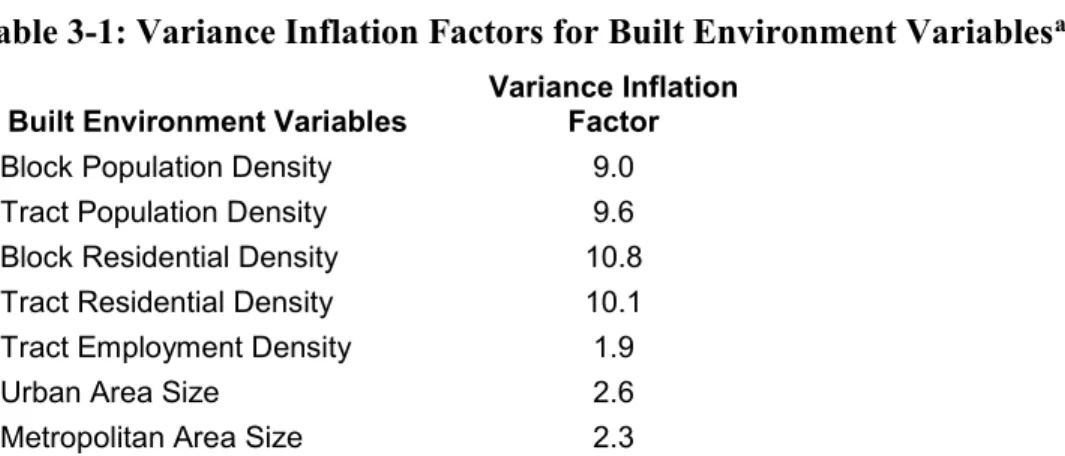
Table 3-1: Variance Inflation Factors for Built Environment Variablesa ... 76
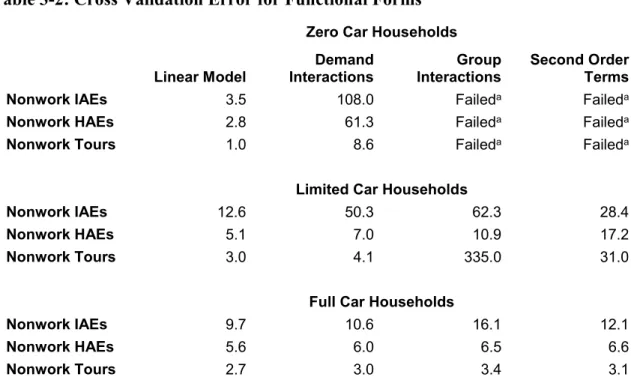
Table 3-2: Cross Validation Error for Functional Forms ... 80
Table 3-3: Mean Values for three Household Types ... 83
Table 3-4: Distributions of Built Environment for three Household Types ... 84
Table 3-5: Distributions of Demographic Characteristics for three Household Types ... 85
Table 3-6: Distributions of Travel Activity for three Household Types ... 86
Table 3-7: Average Directional Influence of Built Environment Variables on Household Activity Participation ... 88
Table 3-8: Variation in Nonwork Activity Participation Associated with Built Environment ... 93
Table 3-9: Built Environments Associated with Highest (95th Percentile) and Lowest (5th Percentile) levels of Nonwork Activity Participation ... 94
Table 4-1: Four Metropolitan Areas Representing Contrasting Trends ... 107
Table 4-2: Selected Metropolitan Areas for Study ... 109
Table 4-3: Key Statistics for Four Metros, 2000-2010 ... 111
Table 4-4: Determining the Influence of Individual Variables on Accessibility Change ... 114
Table 4-5: Percent Change in Accessibility, 2000-2010, median or 90th percentile ... 117
Table 4-6: Decomposition of Accessibility Change ... 120
xi
Table 6-2: Influence of Categorical Built Environment Variables
on Individual Activity Episodes, Limited Vehicle Households ... 148 Table 6-3: Influence of Categorical Built Environment Variables on Individual Activity
xii
LIST OF FIGURES
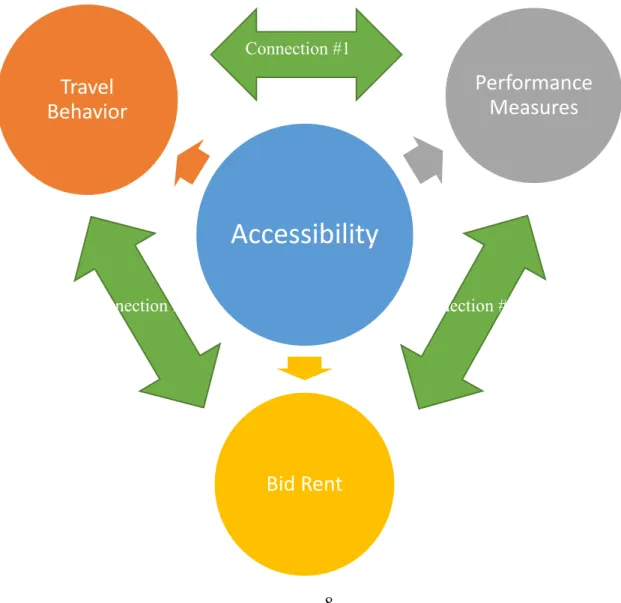
Figure 1-1: Three Views on Accessibility ... 8
Figure 1-2: Accessibility as Part of a Causal Chain Between Policies and Travel Behavior ... 16
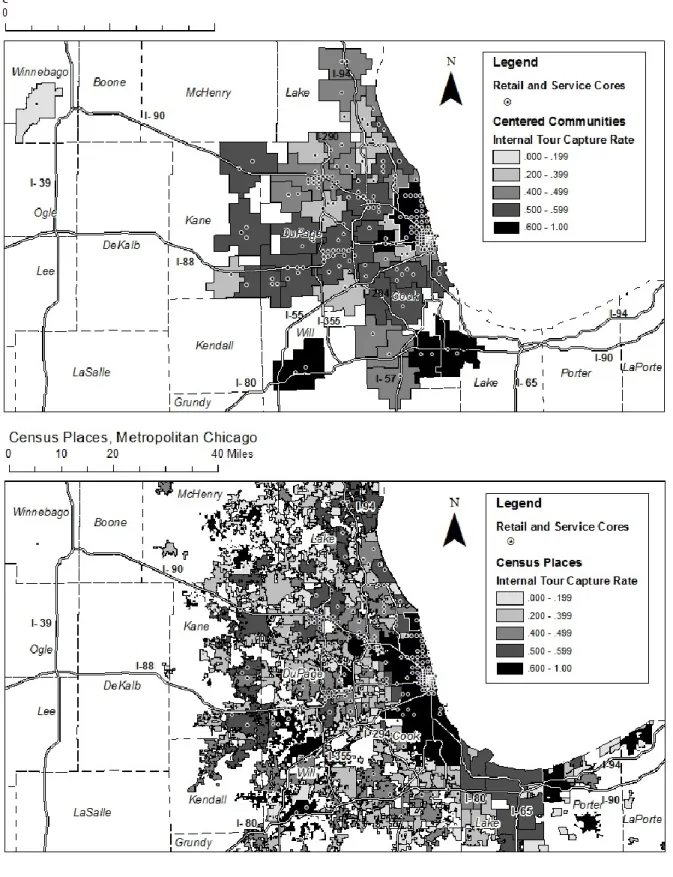
Figure 2-1: Maps of Complete Communities and Census Places for Metropolitan Chicago ... 49
Figure 3-1: Effect of Categorical Built Environment Variables on IAEs ... 89
Figure 4-1: Changes to Auto Accessibility to Employment, 2000-2010 ... 119
Figure 4-2: Changes to Transit Accessibility to Work, 2000-2010 ... 119
Figure 4-3: Changes to Auto Accessibility to Work, 2000-2010, by TAZ ... 121
Figure 4-4: Changes in Transit Accessibility to Work, 2000-2010, by TAZ ... 122
Figure 5-1: A Polycentric Urban Form to Promote Complete Communities ... 138
1
Chapter 1 Accessibility, Travel Behavior, and Urban Form
1.1Accessibility in Contemporary Planning Practice 1.1.aAccessibility vs. Mobility Debate
A group of transportation researchers and analysts have been promoting the use of accessibility measures to evaluate urban transportation systems going back at least 20 years. Among the researchers who have taken this tack are Cervero (1996), Handy (1997), Bertolini (2005), Levine (2010), and Guers (2010). These researchers have all highlighted the contrast between measure of accessibility and measures of mobility, arguing that although mobility measures dominate the current practice of metropolitan transportation planning, accessibility measures are superior for assessing the true purpose of transportation systems: Enabling people to reach their destinations of interest. In short, these proponents have argued that accessibility measures should be preferred over mobility measures for evaluating the performance of metropolitan (and larger scale) transportation systems.
The need for focusing on accessibility measures rather than mobility measures is more acute than ever in 2014. First, urban transportation systems in the US seriously contribute to carbon emissions, which are exacerbating global climate change. Recent estimates of carbon emissions suggest that 28% of total US carbon emissions are from the transportation sector, while US transportation contributes as much as 5% of total global greenhouse gas emissions (Sieferlein & et.al., 2009). Improving mobility in a
2
exacerbating both auto dependence and increased reliance on long-distance vehicular travel and petroleum use. Improving accessibility, on the other hand, often results in more compact development patterns and reduced vehicle miles traveled, therefore reducing the greenhouse gas emissions from transportation (Ewing, Bartholomew,
3
Despite two decades of promotion from the academics listed above, most metropolitan planning organizations do not focus on accessibility measures in their regional transportation planning efforts. At the beginning of my dissertation research I examined the long range transportation plans and spoke to the staff of six leading metropolitan planning organizations: Atlanta Regional Commission, Chicago Metropolitan Area for Planning, the Puget Sound Regional Council, the San Diego Association of Governments, the Southwestern Pennsylvania Commission (Pittsburgh), and the Wasatch Regional Council (Salt Lake City). What I found was that the dominant performance measurements for long range transportation planning are still primarily congestion and mobility-based measures. Other measures considered to be important by these MPOs included transit mode share and future land consumed by development. Accessibility measures were generally a distant third or in some cases were not present as performance measures. This was true even though many of these same plans explicitly call for using existing transportation infrastructure more efficiently. Therefore it appears that the staff of many MPOs do not understand the connection between accessibility measures and making the best use of existing transportation infrastructure. Furthermore, many MPOs do not distinguish clearly between the concept of accessibility and the concept of mobility as distinct planning goals. So despite the repeated strong arguments made by transportation academics on planning for accessibility, there remains in 2014 a gap between the state of the theory and the state of the practice. Contemporary
4
Counter to the overall trend, a few metropolitan planning organizations do stand out over others with regard to incorporating accessibility-based performance measures. For example, the Puget Sound Regional Council (PSRC) applies a wide range of
accessibility measures in its evaluation of its long range transportation plan and in its regional scenario planning. The PSRC’s accessibility metrics include measures of accessibility by multiple modes, including auto, transit, bicycling, and walking. In addition, the PSRC has made broad conceptual use of accessibility measures, applying them for such distinct concepts as transportation performance, economic development opportunity, and equity. As such, the PSRC’s Vision 2040 Plan represents the state of the art for incorporating accessibility performance measures into regional scenario planning.
1.1.bAccessibility and New Planning Goals
Accessibility and its links to theories of urban form and agglomeration economies are some of the oldest ideas in urban planning. However some new dialogues within contemporary planning have also focused on the importance of accessibility as a critical concept. In particular, accessibility has emerged as an important factor in promoting active living and in providing healthful access to nature, two relatively new areas of focus within urban planning. This is because accessibility as a concept is central to the purpose of cities in their most general sense – offering residents more convenient access to a variety of socially important opportunities. Recent research, events, and trends have highlighted some new needs, i.e. the need for physical activity and the need for access to nature within cities. While the needs that have been identified may be new, the
5
A raft of recent research has explored the relationship between built environments and physically active travel (Panter, Jones, & van Sluijs, 2008; Pont, Ziviani, Wadley, Bennett, & Abbott, 2009; Sugiyama, Neuhaus, Cole, Giles-Corti, & Owen, 2012). While there are many individual characteristics and aspects of the social environment which influence active travel, the built environment appears to play a significant role as well. The advantage of the built environment as a public health intervention tool, in particular, is that it can influence the health or activity behaviors of a large population at the same time. And one of the most important aspects of the built environment which can serve to promote physically active travel is the accessibility of destinations of interest (Pont et al., 2009; Saelens & Handy, 2008; Sugiyama et al., 2012). That is, the availability of a variety of destinations of interest nearby one’s home is a critical feature for promoting active travel (however, other neighborhood features are associated with walking or biking in one’s neighborhood for recreational purposes). So accessibility at the local scale turns out to be important in advancing more physically active health behaviors. Interestingly, from the public health perspective, accessibility is not simply about the availability of opportunities in space but also about minimizing the barriers that are in the way of active travel and about maximizing the convenience of active travel opportunities. The
“accessibility” that is relevant to active travel is a very broad concept, going beyond simple spatial measurements into the detailed physical experience of one’s local built environment.
6
for physical activity and reduce mental stress (Louv, 2008). Innovative urban thinkers such as Beatley and Louv draw upon a growing body of psychological and behavioral research to suggest that access to nature is a fundamental human right. Their arguments imply the need for a new kind of accessibility in cities, one that focuses not just on access to employment and services but that is equally focused on providing access to nature. Importantly, many of these benefits are most crucial for those with the least mobility and/or the least opportunity – the young, the old, and the infirm. Therefore the goal of cities should be to provide as ubiquitous access to nature as possible – it is not enough to have one or two large centrally located parks. The importance of physical proximity, a variety of choices, and freedom of movement are crucial to a range of human needs – including access to nature. This new understanding is both deepening and complicating planners understanding of accessibility as a function of livable, sustainable cities.
1.2Three Views on Accessibility: Bid Rent, Travel Behavior, and Performance Measures
Accessibility measures feature prominently in three bodies of planning literature which for the most part have had little overlap. One body of literature connects
7
arguments that travel is a derived demand. Although these three bodies of literature are certainly conceptually related, explicit connections between these literatures have not frequently been made (See Figure 1-1). One of the goals of this dissertation is to see how connections between these various perspectives on accessibility measures can be
improved.
In addition to building upon these bodies of literature, the dissertation also serves as a critique of these same bodies of literature. The dissertation explores the practical and conceptual insights which flow from thinking about these different connections.
Connection #1 (Figure 1-1) highlights the relationship between accessibility-based performance measures and travel behavior. If higher accessibility environments are beneficial, this should be reflected in different travel patterns for those living in such environments. Connection #2 focuses on the relationship between bid rent theory and performance measures. Bid rent theories often claim that real-world urban forms are close to efficient, but accessibility-based performance measures provide a concrete way for testing this hypothesis. In particular, tracking accessibility-based performance
measures over time helps to answer the question of whether urban forms are evolving in a manner consistent with bid rent theory. Connection #3 examines how bid rent
perspectives on urban form are directly reflected in travel behaviors. This third
8
1.2.aBid Rent Theory: Accessibility as a Descriptor of Urban Form
There is a lengthy literature over several decades linking accessibility measures with bid rent descriptions of urban form. In recent years, the literature on accessibility as a descriptor of urban form has successfully taken on the challenge of extrapolating bid rent theory from simpler monocentric forms to polycentric forms (for a full discussion of this in Section 1.5 below). However this literature has satisfied itself with a descriptive stance relative to metropolitan urban form, and has therefore neglected to make the
Figure 1-1: Three Views on Accessibility
Accessibility
Travel
Behavior
Performance
Measures
Bid Rent
Connection #1 #1#1#1#1#1nect ionn
9
connection between the accessibility measures embedded within it and their alternative interpretation as measures of urban system performance.
The origins of linking gravity accessibility measures to patterns of urban form can be traced back to Hansen (1959) among others. More recently, Helling (1992) compared gravity accessibility measures with distance to the central business district in describing land use patterns, finding the gravity measure to be the superior descriptor. Song (1996) compared gravity measures, cumulative opportunity measures, and distance to the central business district, and found that gravity measures were best at describing regional
patterns of population density. Ahlfeldt (2011) conducted a similar exercise, concluding that gravity measures of accessibility to employment opportunities describe patterns of land rents better than simple distances to major transportation infrastructure. In summary gravity measures have consistently been confirmed as superior for describing regional patterns of urban form relative to other, simpler models for understanding urban form, such as straight line distance to the CBD.
10
Areas, which examines how accessibility changes over time for four major metropolitan areas in the US. This paper finds that metropolitan urban forms are evolving in way that is consistent with bid rent theory, but the results are not conclusive.
Accessibility measures integrate information about both changes to travel times and changes to spatial patterns, and therefore allow the analyst to evaluate the
performance of a particular urban system over time. Because accessibility measures incorporate within them the benefits of increased speeds, they allow for an even-handed comparison of urban system performance over time; that is a “sprawling” urban system could outperform a compact one if increases in speeds compensate adequately for
decreases in proximity. In contrast, changing patterns of residential density alone are not readily interpreted as a transportation performance measure and therefore cannot tell us whether the urban system is performing better or worse over time. In addition because accessibility measures can be developed at fairly disaggregate scales, the researcher can use them to examine how accessibility is changing for particular populations, or
differentially across space or for different modes. Therefore one way to evaluate the claim that urban systems are evolving efficiently is to apply accessibility measures to them and track the trends of accessibility change in aggregate, by mode, and by location. As mentioned before, this is the subject of the third dissertation paper, Changing
Accessibility of US Metropolitan Areas.
1.2.bAccessibility and Travel Behavior
11
environment in reducing VMT across their two literature reviews of the built
environment and travel behavior (Ewing & Cervero, 2001, 2010). In particular, living in a higher accessibility environment has been associated with shorter commutes (Levinson, 1998; Manaugh, Miranda-Moreno, & El-Geneidy, 2010). Also, residential locations in higher accessibility environments have been associated with higher property values, although these effects on property values are often relatively marginal (Giuliano, Gordon, Pan, & Park, 2010; Srour, Kockelman, & Dunn, 2002).
An alternative way to examine the influence of accessibility on travel behavior patterns is to examine its influence on the size of a household’s activity space. Here again the results are fairly consistent, with most research finding that those who live in higher accessibility environments have smaller activity spaces (Buliung & Kanaroglou, 2006; Cerda, 2009). However despite this smattering of activity pattern research which extends beyond the commute, the influence of accessibility on VMT for trips other than commuting is not well understood. One of the ways this dissertation contributes to this body of research on travel behavior is to examine the influence of accessibility on non-work travel in two of the three dissertation chapters (0 and 0). Interestingly, it appears that the recent increased emphasis by researchers on exploring accessibility as a performance measure has led to reduced attention to the accessibility-travel behavior relationship.
1.2.cAccessibility as a Performance Measure
Some of the key papers arguing for the increased use of accessibility as a
12
to focus on accessibility rather than auto-based mobility. Handy and Neimeier (1997) reviewed various kinds of accessibility measures and contrasted the concepts of local and regional accessibility. Bertolini (2005) highlighted how accessibility measures could be used in applied projects to integrate transportation and land use planning considerations. Grengs and Levine (2010) applied gravity accessibility measures to compare and contrast Washington DC and San Francisco, emphasizing accessibility as a comparative measure as well as one one that could be used to track transportation system performance over time. Guers et al. (2010) discuss how logsum measures can be used to perform a
monetized cost-benefit analysis of future transportation-land use scenarios. Each of these papers provides insight into how transportation planners can use accessibility measures as performance measures and how these measures can be interpreted in a practical setting.
13
Therefore one of the purposes of this dissertation is to explore the connection between various proposed measures of accessibility and their influence on specific travel behaviors. The dissertation investigates whether the influence of high accessibility environments on travel behaviors is in accordance with theoretical expectations and policy preferences.
Furthermore, the view of accessibility as a performance measure for the urban form-transportation system has some conceptual limitations. Thusfar, the implicit view in this literature is that the accessibility around a person’s home location should be as high as possible in order to provide transportation system benefits. However, by
definition, accessibility cannot be high everywhere. What kind of regional urban form is suitable for taking best advantage of accessibility patterns? Here the bid rent literature provides a complementary perspective. A regional urban form where patterns of
residential density roughly correlate with patterns of accessibility allows the most people to take advantage of regional accessibility patterns while also incorporating the trade-offs between access and space which are integrated into the bid rent model. The bid rent perspective allows us to conceive of accessibility as not a single criteria to be optimized but rather as a regional spatial pattern of opportunity.
1.2.dExcess Commuting: The Urban Form-Travel Behavior Connection
14
workers will travel to the closest appropriate job available to minimize commuting costs, or alternatively, that workers will seek residential locations as close as possible to their work location, while taking into account the land cost gradient (Hamilton, 1982; Small & Song, 1992). Over time the excess commuting literature has arrived at the conclusion that commute cost minimization alone does not well explain residential location choice (Giuliano & Small, 1993; Small & Song, 1992). However the theoretical minimum commute has remained an important research measure for understanding local jobs housing balance (Horner, 2008). Some have claimed that the weakness of the theoretical minimum commute in explaining actual commutes means that urban form is unimportant in explaining commutes. However, Yang has established that generalized regional access to employment is an important factor in explaining average commute lengths (Yang, 2008; Yang & Ferreira, 2008). As a result of these findings, i.e. the importance of regional job access and the relative unimportance of the theoretical minimum commute, the literature has gradually shifted its focus from matching workers with individual job locations towards matching workers with a broad set of choices of possible jobs (Yang & Ferreira, 2008). This movement is underscored by the practical reality that workers often change jobs (and households often have more than one worker) and therefore households should not rationally decide their residential location based upon their current job
15 1.3Research Questions
As stated above, accessibility measures can be viewed as a window into the performance of the combined urban form and transportation system, or the “urban system” for short. Accessibility measures are objective measures which integrate a variety of information about the urban system into one or more succinct measures. Because of their ability to summarize a wide range of information succinctly, they provide some insight into the transportation and land use policies applied and their influence on desired travel behavior, social, and economic outcomes. For example, it is difficult to evaluate the costs and benefits of a new piece of transportation infrastructure in isolation because it is inherently connected with the whole transportation infrastructure network. Accessibility measures provide us with one approach for assessing before and after benefits.
A simplified causal chain of influence can be traced in this way (See Figure 1-2: Accessibility as Part of a Causal Chain Between Policies and Travel Behavior): Land use policies influence urban form change. Transportation policies influence investments in infrastructure and the management of transportation infrastructure and therefore travel times. Urban form combined with the mobility provided by transportation infrastructure together result in spatial patterns of accessibility across a metropolitan region. Then these accessibility patterns in turn influence travel behavior in interesting and significant ways. Therefore part of the value of accessibility measures is that they provide insight into how complex patterns of urban form and transportation infrastructure are likely to influence activity patterns and travel behavior. Of course there are several feedbacks within this causal chain – travel behaviors influence travel times and the policy
16
key relationships we wish to understand about how policies influence travel behavior outcomes. This sequence of causal events is summarized in Figure 1-2.
The dissertation examines the last two pieces of this causal chain. The first two papers from the dissertation explore the relationship between accessibility patterns and travel behavior, or the third and fourth boxes in the Figure 1-2 diagram. The first paper,
Measuring Complete Communities, examines whether different aspects of accessibility as well as other urban form features can make travel patterns more localized. This is similar to research which has been done linking high accessibility environments to smaller activity spaces (El-Geneidy, 2010). The second paper, Does Accessibility Influence Activity Participation, examines whether a more accessible built environment can promote greater participation in nonwork activities. Both of these papers focus on connecting specific accessibility measures to travel behaviors that are theoretically expected but which have not necessarily been well documented empirically.
The third paper of the dissertation, Changing Accessibility in US Metropolitan Areas, examines accessibility patterns over time and how they are influenced by both urban form change and transportation system change. Therefore here the focus is on the connection between the second and third boxes of Figure 1-2. The innovation in this paper is to examine urban system change over time from the perspective of accessibility. This yields a prescriptive rather than a descriptive analysis of urban system change, i.e., it
Land Use and Transportation
Policies
Urban Form + Travel Times
Accessibilty
17
answers the question of whether or not the urban system is performing better or worse over time. The various urban form and travel time components which influence
accessibility change are also identified and described in this paper. This helps to identify how much of accessibility change is due to changes in urban form, and how much is due to changes in mobility provided by the transportation system.
1.4Defining and Measuring Accessibility
The definition I propose for accessibility is the ease and scope of opportunities for interaction across space within the urban environment. This definition is based upon previous similar definitions, but I add an emphasis on the role of increased scope or choice (Geurs & Van Wee, 2004; Handy & Niemeier, 1997). In this dissertation, accessibility measures are place-focused: they reflect how much a particular location is connected with opportunities which may be distributed throughout the metropolitan area.
One reason accessibility measures are particularly informative is that they form a connection between the local and the regional. As opposed to more conventional
measures of urban form such as density or mixed use, accessibility measures provide information about how much the entire regional built environment influences a particular location.
A great deal of recent research on how the built environment can influence travel behavior has focused on relatively small-scale urban form features. Much of this
18
accessibility, density, diversity, and design – destination accessibility has the largest influence on reducing vehicle miles traveled (Ewing & Cervero, 2010). To some extent, planning researchers have been focusing on the incorrect scale for understanding how urban form influences the amount of vehicular travel. One of the reasons a focus on accessibility measures is warranted is that thinking about accessibility sharpens our focus on how regional-scale urban form features influence travel behavior.
Two of the three dissertation papers examine one particular type of accessibility measure – gravity measures of accessibility to employment opportunities from residential locations. There are many strengths and weaknesses of this particular measure, a
thorough discussion of which goes beyond the scope of this introduction. Some of the strengths of this measure are that it accounts for regional patterns of opportunity; that the data are often available to compute such measures; that as measures of spatial
opportunity they reflect patterns of land use; and that these measures aggregate a great deal of spatial information into a succinct summary. Some of the weaknesses of these measures are that they do not reflect variations in individual capabilities or time
constraints; that they do not reflect different attitudes about the inconvenience of travel time; and that they do not incorporate the patterning of activity spaces based on habitual travel behaviors. In summary, it could be said that these types of gravity accessibility measures are both powerful but also have their drawbacks.
1.5The Monocentric Model in a Polycentric Era
19
traditional regional center of downtown LA in 2000 (Giuliano, Redfearn, Agarwal, & He, 2012). However considering the general principals of urban bid rent theory, i.e. that urban land values and density patterns are derived primarily from access to urban opportunities, then the “monocentric” model remains relevant to this day. The key to adapting traditional bid rent theories to contemporary urban environments is to move away from the traditional measurement of urban access, i.e. distance to the central business district, and to adopt in its place accessibility measures which are generalizable to polycentric or dispersed urban forms.
Bid rent theories suggest that households tradeoff between the desire for greater housing and space consumption and their preference for lower commuting costs in time or money (Anas, Arnott, & Small, 1998; Brueckner, 1987). The implications of bid rent theory within the traditional monocentric framework are that land rents and residential densities rise with proximity to the CBD, or alternatively stated, that rents and residential and population densities vary inversely with distance. The relationship between distance to the CBD and population density has generally been assumed to take on a negative exponential form, and density gradients have often been used to compare the relative concentration of population between various urban areas and for particular urban areas over time (Anas et al., 1998; Mieszkowski & Mills, 1993). Density gradients describe metropolitan-scale urban forms through the use of a single parameter from the negative exponential function, and therefore allow a succinct description of the relative
20
explanation for this continued decentralization trend has been declining travel costs and increased travel speeds, linked with the spread of the auto in particular but also linked with faster transit travel as well (Ahlfeldt & Wendland, 2011; Mieszkowski & Mills, 1993).
There are several weaknesses in the assumptions behind the traditional
monocentric model, but in particular the assumption that most employment is contained within the CBD is increasingly out of date (Garreau, 1991; Glaeser & Kahn, 2001; Weitz & Crawford, 2012). The trend of employment decentralization is particularly
pronounced in the United States, where development patterns are often guided primarily by development interests and with only a weak influence from public policy. In the US, lower land prices and high levels of auto access provided by an expanded interstate system have resulted in the development of numerous major employment centers outside the central city in most major metropolitan areas (Garreau, 1991). The study of
metropolitan employment subcenters, their locations, sizes, functions, and commuting patterns, has become an academic subject of interest in its own right, with a
corresponding growth in the literature (Giuliano & Small, 1991; McDonald & Prather, 1994; McMillen & Lester, 2003; Redfearn, 2007).
However a number of carefully constructed studies have confirmed the continued relevance of urban bid rent theories to a dispersed or polycentric era. Helling compared integral, gravity, and cumulative opportunity accessibility measures with distance to the CBD for explaining residential location patterns, and found that gravity-based
21
households, and found that a dispersed model, based upon gravity accessibility measures, fitted worker residence distribution best (S. F. Song, 1994). Ahfeldt studied the
residential land rent gradient in Berlin, Germany, and, making use of gravity-based accessibility measures to employment, found that these variables explain the residential land rent gradient better than simple distances to transportation infrastructure (Ahlfeldt, 2011). Taken together, these studies strongly suggest that monocentric descriptions of urban form no longer work well across much of the western world. In addition these studies suggest that accessibility measures can still be used to describe regional urban form because these measures capture the geographic dispersion of destinations across space. Table 1-1 illustrates the various accessibility measures used in these studies and how they have been operationalized.
Table 1-1: Papers Applying Bid Rent Theory to Polycentric/Dispersed Urban Areas
Author, Year Accessibility Measure Impedance Measures Ahlfeldt, 2011 Gravity Travel Times, Multiple Modes
Straight Line Distance, Multiple Modes Helling, 1998 Gravity, Integral,
Cumulative Travel Times, Auto Song, 1994 Gravity Travel Times, Auto
Distance, Auto
The primary difference between these updated versions of the bid rent model and the traditional monocentric model is that these approaches take into account that
22
explanatory power of the model. However, there is an important mathematical
distinction between the use of distance to the CBD and the use of accessibility measures. Accessibility increases with decreasing distance, so land rents and population densities increase with higher levels of accessibility.
The functional form of the relationship between residential density and accessibility is not necessarily determined by theory. Ahfeldt assumes a log-log
relationship between land price and work accessibility (See Equation 1 below). Song and Helling both assume that accessibility is linearly related to the log of residential density (See Equation 2).
1) 𝑙𝑜𝑔(𝑙𝑎𝑛𝑑 𝑝𝑟𝑖𝑐𝑒) = 𝑙𝑜𝑔(𝑎𝑐𝑐𝑒𝑠𝑠𝑖𝑏𝑖𝑙𝑖𝑡𝑦 𝑡𝑜 𝑗𝑜𝑏𝑠)
2) 𝑙𝑜𝑔(𝑟𝑒𝑠𝑖𝑑𝑒𝑛𝑡𝑖𝑎𝑙 𝑑𝑒𝑛𝑠𝑖𝑡𝑦) = 𝛽0+ 𝛽1(𝑎𝑐𝑐𝑒𝑠𝑠𝑖𝑏𝑖𝑙𝑖𝑡𝑦 𝑡𝑜 𝑗𝑜𝑏𝑠)
So what are the implications of these results? Firstly, that urban bid rent theory continues to be relevant in the contemporary era of polycentric or dispersed urban forms. This means that both land values and residential density patterns are expected to correlate with measures of urban accessibility for polycentric urban areas. In fact, theoretically accessibility should be the primary variable explaining patterns of urban land values, though amenities and public goods could also be significant influences depending upon the context. Secondly, that distance to the center of the urban area is second best as a predictor of urban form. Once urban accessibility is adequately accounted for, distance to the CBD may not contribute significantly as an explanatory factor (Ahlfeldt, 2011). Thirdly, gravity measures of accessibility have proven to be widely effective in
23
though sometimes apocryphally referred to as the “monocentric” model, remains relevant in a polycentric urban era.
Furthemore, it is noteworthy that urban bid rent theory has been used not just to describe urban forms, but also to argue whether observed urban forms are efficient (Brueckner, 2000b; McGrath, 2005; Mieszkowski & Mills, 1993). Specifically, some urban economists have argued that if bid rent theory explains urban forms well, then this suggests that urban forms are responding in an efficient manner to transportation costs. This dissertation deepens this line of analysis by connecting it to travel behavior theories which advocate for accessibility as an outcome measure. It is this way of thinking about accessibility that is explored in the next section.
1.6Accessibility and Travel Behavior Research
Accessibility can also be considered for its travel impacts, i.e. in increasing the level of travel opportunity available to a particular individual or household. According to Handy and Niemeier, accessibility is defined as “the potential for interaction, both social and economic, the possibility of getting from home to a multitude of destinations offering a spectrum of opportunities for work and play (Handy & Niemeier, 1997).”
Accessibility measures have been empirically associated with shorter vehicular travel distances, higher residential property values, and preferred residential location choices. Several comparative studies of urban form measures have suggested that accessibility to jobs is the built environment variable most associated with reduced vehicle miles traveled (Cervero & Duncan, 2006; Ewing & Cervero, 2001, 2010;
24
Research has also connected higher accessibility with higher residential land values (Ahlfeldt, 2011; Cerda, 2009; El-Geneidy & Levinson, 2006; Giuliano et al., 2010; Iacono & Levinson, 2010; Srour et al., 2002). Some of these studies conclude that other factors are more important than accessibility in determining residential land values, but in each of these studies, accessibility to jobs has a statistically significant and positive influence on land values. Finally, accessibility has also been strongly linked residential location choice (Cervero & Wu, 1997; Cho, Rodriguez, & Song, 2008; Levine, Inam, & Torng, 2005; Srour et al., 2002; Waddell et al., 2003). Taken together, this research suggests that accessibility is linked to higher land values, reduced dependence upon vehicular travel, and preferred residential locations.
1.7Summary of Research Questions for the Three Papers
The following sections detail the research questions and methods for the three dissertation papers. A summary of results and implications for each paper is contained in the conclusion.
1.7.aMeasuring Complete Communities
Research Question. Jobs-housing balance measures have a long history in
planning and have been associated with more self-contained communities and shorter commutes. However, jobs-housing balance measures suffer from an arbitrariness of scale and a neglect of regional spatial context. This paper investigates a wide variety of urban form measures to see which best explain community completeness with respect to nonwork travel.
Methods. Starting with the 19-county Chicago metropolitan region, I examine
25
Places. Therefore the same metropolitan region is examined twice through different geographic decompositions. Centered Communities consist of a cluster of one or more employment centers and residential areas within a 15-minute drive time radius of these centers. The other geography is Places, which are generally incorporated towns and cities. Examining two distinct geographic scales adds to the robustness of the analysis.
A community’s level of completeness is measured as its internal tour capture rate for nonwork tours. The internal tour capture rate is defined as the percentage of the time a nonwork tour was successfully completed within a particular geography. Internal trip capture is used as a secondary dependent variable and for a robustness check.
Community urban form is measured with three types of variables: size and density variables, mixed use variables (including jobs-housing balance), and accessibility
variables. Mixed use variables include raw jobs-housing ratio, jobs-housing balance index, Entropy, Dissimilarity, and Exposure indices. This paper also introduces a variety of accessibility variables which have not previously been examined in the context of internal trip capture or community completeness.
1.7.bDoes Accessibility Influence Nonwork Activity Participation
Research Question. Most of the research on the benefits of accessibility has
26
wide range of built environments. Using such built environment diversity helps to answer the key question motivating this study: Do households benefit from higher accessibility environments through increased participation in out-of-the-home activities?
Methods. The approach of this study is to model levels of nonwork travel
activity as a function of supply and demand for household activity participation. Demand for travel activity is assumed to be determined by household structure and resources – the number, gender, and ages of household members, household member relationships, and household income. The supply of opportunities for travel activity is determined by time constraints, the availability of private vehicles, and the level of accessibility provided by the built environment. Using these variables, I estimate the influence of the built
environment (and therefore accessibility) on a variety of measures of travel activity. For nonwork travel activity, I examine three dependent variables: Individual activity episodes, household activity episodes, and individual tours. Each of these variables is aggregated to the household level.
Because I expect that the built environment to have a different influence depending upon a households’ level of vehicle ownership, the analysis segments households into three groups: households without vehicles (Zero Vehicle Households), households with only one vehicle but more than one driver (Limited Vehicle
Households), and households with two or more vehicles, or exactly one vehicle and exactly one driver (Full Vehicle Households).
27
and household sociodemographic data. As a national survey, it contains a much wider range of land use variation than most metropolitan area travel surveys, including households from metropolitan areas of all sizes as well as nonmetropolitan areas. The rich data provided by the NHTS supports the development of robust models for predicting household-level travel activity.
1.7.cChanging Accessibility in US Metropolitan Areas
Research Questions. Accessibility is influenced by both the proximity of
locations and by travel speeds. However, in US metropolitan areas the overall trend has been negative on both fronts: US metropolitan areas are spreading out, resulting in decreased employment proximity, and roads are increasingly congested, resulting in slower travel speeds. If this is indeed the case, then most US metropolitan areas are actually delivering less accessibility to their residents over time. Metropolitan-scale smart growth efforts, however, could potentially channel development into existing built-up areas, and therefore lead to higher accessibility relative to more sprawling metro areas.
The primary research questions concern how accessibility changes over time in US metropolitan areas, and to what extent accessibility change is influenced by changes to urban form and to travel times. More specifically, is accessibility increasing or decreasing over time in US metropolitan areas, and what are the primary underlying causes of these changes? In terms of policy, are there different trends for metropolitan areas where more compact urban form patterns prevail, versus metropolitan areas where more sprawling urban form patterns prevail?
Methods. Based on longitudinal information on travel times, population location,
28
accessibility to work for four metropolitan areas’ populations for the years 2000 and 2010. I aggregate these population-based accessibility scores to the metropolitan level in order to evaluate changes to metropolitan urban form over time, i.e. are metropolitan areas becoming more or less accessible over time. Then the paper breaks down these total changes in metropolitan accessibility into shifts due to changing residential patterns, shifts due to changing employment patterns, and shifts due to changing travel times.
The four metropolitan areas are selected for variation along two dimensions: change in average population proximity, and change in average traffic congestion. Theoretically, proximity and travel times are the drivers of metropolitan accessibility change, so these four metropolitan areas should highlight contrasts trends with regard to accessibility change.
1.8Conclusion
29
accessibility change for the 2000-2010 period for four major metro areas and for both auto and transit travel modes.
The dissertation in its entirety concludes that the relevance of accessibility measures depends upon the policy question of interest. Particular accessibility measures are associated with more localized travel patterns and with greater activity participation. However maximizing regional accessibility to employment may not help achieve the diverse range of current transportation planning goals. Specifically, two of the three papers find that local accessibility may be more important than regional accessibility for promoting the particular goals of more localized and more convenient travel.
Furthermore, the results from the third paper suggest that when seeking to
promote higher regional accessibility for households, it is difficult to coordinate land use change and transportation system change at the regional scale. The four metropolitan areas examined include several which experienced improvements in transportation system mobility (both auto and transit based) while at the same time seeing a decline in the proximity provided by urban form. It appears difficult to channel regional
30
Chapter 2 Measuring Community Completeness: Jobs-Housing Balance, Accessibility, and Convenient Local Access to Nonwork Destinations 2.1Abstract
Using 2007 travel diary data from metropolitan Chicago, I investigate what aspects of urban form contribute most to community completeness, as defined by internal tour capture for nonwork tours. The paper examines two distinct geographic scales – Census-defined “Places” and synthetically constructed “Centered Communities.”
Centered Communities are defined as nonwork travel sheds centered upon concentrations of retail and service activity. Higher accessibility share (a new urban form measure) and higher mixed use both significantly predict greater community completeness, as do higher levels of residential or employment density. Furthermore, I find that mixed use measures describe something distinct from proximity to job-based attractions; they capture whether urban forms provide an appropriate balance of activities necessary for a complete community. To build more complete communities, planners need to ensure that the level of local accessibility to a variety of attractions of interest is high relative to the level of regional accessibility available outside their community.
2.2Introduction
Planners have been aiming at creating complete communities since the dawn of the profession during the days of Ebenizer Howard at the turn of the 20th century.
31
but with strong connections to a greater metropolitan region (Howard & Osborn, 1965). The idea of complete communities was revived with the New Towns movement in the United States and Europe (Burby & Weiss, 1976), and reached beyond to other countries as well (Lee & Ahn, 2005). However for the most part these Garden Cities and New Towns have failed over time to be self-contained with regards to commuting trips
(Cervero, 1995, 1998). Given the range of residential and employment choices available in a sizable metropolitan region, residents rarely choose to work and live in the same community if they have high levels of mobility. However not all trips are worthy of lengthy metropolitan-scale ventures, and so planners have responded by seeking to create a more modest version of completeness – one where most of a household’s regular needs and at least some employment opportunities are distributed at activity centers located throughout a metropolitan region and therefore in closer proximity to where households live. This goal of being able to meet most of one’s nonwork needs at a local activity center lives on in the idea of the complete community.
This interest in creating a series of relatively compact and local complete
communities where residents are able to conduct the regular functions of their daily lives remains an active goal within contemporary comprehensive plans (City of Vancouver, 2003; Ontario Ministry of Infrastructure, 2006; Wood, Frank, & Giles-Corti, 2010). In part this may be a reaction against the trend of growth in nonwork travel distances; for example, shopping VMT has increased by 278% since national household transportation surveys began in 1969, whereas commuting VMT has increased just 60% (Santos,
32
expressing the desire for compact, self-contained, complete communities which provide the opportunity to engage in a variety of activities locally. If planners are able to
facilitate the creation of such complete communities, benefits may include a greater range of easily accessible opportunities, shorter average vehicular trips, reduced burdens on regional transportation infrastructure, and a potential shift to non-motorized modes (Cervero, 1989). Moreover, creating complete communities is not only an important transportation goal, it may also foster communities with stronger identities and increased social identification from local residents (Kaiser, Godschalk, & Chapin III, 1995). For the purposes of this paper, I define a “complete community” as a sub-regional geographic boundary within which most residents are able to meet most of their daily and weekly nonwork travel demands.
Much of planners’ and planning researchers’ recent focus on “completeness” has been at the neighborhood scale, perhaps due to the influence of New Urbanism on contemporary planning (Duany, Plater-Zyberk, & Speck, 2000). As a result the bulk of recent urban form and travel behavior research has focused on the neighborhood scale (Cao, Mokhtarian, & Handy, 2007; Crane & Crepeau, 1998; Fan, Khattak, & Rodriguez, 2011; Handy & Cliffton, 2001; Khattak & Rodriguez, 2005; Levine et al., 2005;
33
Greenwald, 1999; Handy, 1992; Krizek, 2003). For example, in Ewing et al.’s study of mixed use developments, which range in size from 100-400 acres, the average internal trip capture of these developments was just 18%. This means that approximately 82% of travel starting from these locations ventures outside these developments, even within mixed use settings (Ewing et al., 2011). Indeed, most household activity patterns span beyond the neighborhood and are strongly influenced by regional urban form (Ewing & Cervero, 2001). Therefore, there is an urgent need for greater research attention to urban form beyond the neighborhood scale, such as the community scale. One of the goals of this paper is to try to identify a meaningful scale for thinking about communities. Planners have traditionally used the term “community” to identify a scale that is larger than the neighborhood (about 150-500 acres), yet also much smaller than the region (as defined by metropolitan planning organizations, up to millions of acres); for example, Kaiser et al. define the market area of a community shopping center as 3-5 miles in radius or 10-20 minute drive time (Kaiser et al., 1995). However, the term “community” may take on different meanings, shapes, and sizes depending upon the context in which it is used. In other words, although planners and residents may use the term “community” to correspond to a wide range of scales, here I am trying to examine whether or not such “communities” can offer some reasonable version of completeness with respect to residents’ nonwork activities.
34
and are contained within a given community’s boundaries. The goal of designing complete communities with respect to nonwork travel is likely to be feasible because nonwork destinations often (but not always) can serve as substitutes for each other.
The sections of the paper proceed as follows. The first section is a literature review of relevant works in the areas of jobs-housing balance, internal trip capture, and the identification of employment centers. The second covers research methods, including the definition of the communities at two distinct scales, definitions of various measures of urban form, a discussion of the dependent variables (internal tour/trip capture), and a review of regression equations used in the analysis. The third section covers the results. And the final section includes a discussion of principal findings, implications for policy, and potential future research directions.
2.2.aLiterature Review
35
Jobs-housing balance. Among other scholars, Cervero in particular has
conducted a number of studies on the jobs-housing balance of employment centers (or cities) and how these balances affect commuting patterns and housing choices (Cervero, 1989, 1991, 1996a; Cervero & Wu, 1998; Giuliano & Small, 1993). Cervero’s 1989 study of the San Francisco Bay Area found asymmetric findings with respect to jobs-housing balance in communities: Communities with a rich supply of local jobs-housing had more of their workers living within them; however communities with a rich supply of local jobs did not necessarily have more of their residents working within them (Cervero, 1989). In a later paper revisiting jobs-housing balance in the San Francisco Bay Area, Cervero found that there was little association between jobs-housing balance and the self-containment of commuting trips, and that this correlation reduced between 1980 and 1990 (Cervero, 1996a). In a more recent study of jurisdictions in Virginia, jobs-housing balance in jurisdictions was found to be highly correlated with shorter commute times (Miller, J. S., 2011). Altogether this evidence suggests that jobs-housing balance alone is unlikely to create a self-contained community with respect to commuting travel.
Internal trip capture. In this literature, a geography is considered to be more
36
jobs-housing balance has the largest influence on internal trip capture rates. Average internal trip capture rates for these master planned communities were around 18%. A study of master-planned developments in Australia (ranging from 850-3500 acres in size) by Yigitcanlar generally found low levels of self-containment for commuting travel, but also found that self-containment increases with distance to the CBD, and decreases with household car use (Yigitcanlar, et al., 2007). Greenwald examined the Travel Analysis Zone (TAZ) scale and found that internal trips are more likely with higher land use Entropy (which is a measure of the diversity and balance across employment activities) and in the location of a person’s home TAZ (Greenwald, 2006). In summary, internal trip capture rises with the size of the geography under study as measured by population or job counts; declines with proximity of the geography to the regional center; and rises with increased land use mix.
Metropolitan employment centers. The literature on metropolitan employment
centers has generally focused on describing the location and composition of employment centers, as well as the influence of these employment centers on commuting patterns. These studies define the characteristics of polycentric urban form at the regional scale and how a polycentric structure influences changes to urban form over time (Giuliano & Small, 1991; McMillen & McDonald, 1998; Redfearn, 2009; Small & Song, 1994). Employment centers have generally been identified based upon thresholds for
37
1998; Giuliano & Small, 1991), but rarely has this literature addressed internal trip capture.
Although these studies of urban form and travel behavior cross a wide range of scales and subject matters, a few clear narratives emerge on how these results are likely to apply to community completeness. Firstly, both local land use patterns and regional land use patterns should be influential in shaping the level of self-containment for communities. Traditional jobs-housing balance measures, however, only capture the influence of local land use patterns on travel. For this reason, this study also examines various accessibility measures in order to take into account the influence of both local and regional land use patterns. Secondly, communities are more likely to be self
contained if they are larger and if they are have lower levels of regional accessibility (i.e. they are located further away from the center of the metropolitan area). Thirdly,
communities are more likely to be self contained if they contain a wide variety of land uses or activities within them, i.e. high levels of mixed use.
38 2.3Methods
2.3.aGeographies under Analysis
Starting with the 19-county Chicago metropolitan region1, I examine community
completeness for two geographies: Communities defined around employment centers (hereafter “Centered Communities”) and Census Places (hereafter “Places”). The process for identifying Centered Communities was based on a division of the metropolitan region into non-overlapping nonwork travel sheds, each centered on a service-based
employment core (see below). The second geography under examination is Census-based Places, which are usually incorporated cities. Boundaries for Centered
Communities were built upon collections of Travel Analysis Zone (TAZ) boundaries, which were provided by CMAP, while boundaries for Places were from the US Census Bureau (CMAP, 2012; US Census Bureau, 2012a). For both geographies, I consider the set of destinations contained within them to be local, and the set of destinations outside of them to be regional.
In order to create various urban form measures and define the Centered
Communities, I rely upon location-specific job and resident worker counts from LODES (LEHD Origin-Destination Employment Statistics) data from the year 2007 (Year 2007 is chosen to coordinate with the timing of the Chicago metropolitan travel survey) (US Census Bureau, 2012b). LODES data is an administratively compiled data source from Census Bureau’s Longitudinal Employment Household Dynamics program2.
1The CMAP TAZs overlapped with the following 19 Chicago metropolitan area counties: Boone, IL; Cook,
IL; Dekalb, IL; Dupage, IL; Grundy, IL; Kane, IL; Kankake, IL; Kendall, IL; Lake, IL; Lasalle, IL; Lee, IL; Mchenry, IL; Ogle, IL; Will, IL; Winnebago, IL; Lake, IN; Porter, IN; Kenosha, WI; Walwort, WI.
2The Census Bureau compiles the data from multiple sources including employer-based, state-level
39
The first step in identifying Centered Communities was to count the number of resident workers and jobs located in each TAZ, with jobs identified by two-digit industry NAICS code (US Census Bureau, 2012b). Resident worker and job counts for each TAZ came from summing over all Census Blocks whose centroids were located within them. Then, I calculated a retail-and-service job density for each TAZ3 and selected 1 job/acre
as the minimum cut-off for identifying retail and service “Cores.” This density cut-off of 1 job/acre was selected after testing a range of potential density cut-offs, with the goal of covering as much of the region as possible while identifying distinct concentrations of employment-related activity. This process resulted in the identification of 224 TAZs as “Cores” or activity centers for building Centered Communities around.
In general, I joined adjacent Core TAZs into a single Core. Many Core TAZs were close but not adjacent; therefore, if two Core TAZs were within a 10 minute drive time from each other, I also joined them into a single Core (all drive times were provided by CMAP (CMAP, 2012)). I separated the City of Chicago into three distinct Centered Communities, one for the central business district, one for the side of the city north of I-290 Eisenhower Expressway, and one for the side of the city south of the expressway because the population of Chicago was too large to be considered as a single Centered Community.
In order to associate residential areas with these Cores, I connected each non-Core TAZ with the Core TAZ that it was closest to using off-peak drive times. However,
LODES identifies both employment and resident worker locations at the Census Block level, however some of the resident worker locations are synthesized in order to maintain household confidentiality (Andersson, Freedman, Roenmer, & Vilhuber, 2008).
3Retail and service jobs included the following NAICS codes: Sectors 44-45 (Retail), Sector 72
40
residential TAZs were only connected to a Core TAZ if the drive time was less than 15 minutes. Therefore the ‘radius’ of each Centered Community is about 15 minutes of auto-based travel time. In addition, I re-categorized a handful of TAZs into different Centered Communities in order to make each community contiguous and reasonably convex. Once this process was complete, there were a total of 50 Centered Communities which included 2,649,053 resident workers out of a total of 4,262,245 in the 19-county metropolitan region (See Figure 2-1).
2.3.bMeasuring Urban Form
I measured community urban form with three types of variables: size and density variables, mixed use variables (including jobs-worker balance), and accessibility
variables. The jobs-housing balance literature suggests that the jobs-housing ratio and the jobs-housing balance index may be relevant to measuring complete communities (Cervero, 1996a; Ewing et al., 2011); here I substitute counts of resident workers for counts of housing units. Likewise, the literature on internal trip captures suggests that other measures of mixed use, such as Entropy, as well as size and density variables, may help explain community completeness (Ewing, Dumbaugh, & Brown, 2001; Greenwald, 2006). In addition to more traditional measures of mixed use, I test two proposed measures of mixed use, the Dissimilarity Index and the Exposure Index (Horner & Marion, 2009; Y. Song & Rodriguez, 2005). Also, I introduce a variety of accessibility variables that have not previously been used to predict internal trip capture or community completeness.