1 A photometric stereo-based 3D imaging system using computer vision and deep learning 1
for tracking plant growth 2
3
Gytis Bernotas1*, Livia C T Scorza2*, Mark F Hansen1*, Ian J Hales1, Karen J Halliday2, 4
Lyndon N Smith1, Melvyn L Smith1, Alistair J McCormick2,† 5
1 Centre for Machine Vision, Bristol Robotics Laboratory, University of the West of England, 6
T block, Frenchay Campus, Coldharbour Lane, Bristol, BS16 1QY, UK 7
2 SynthSys & Institute of Molecular Plant Sciences, School of Biological Sciences, University 8
of Edinburgh, Edinburgh, EH9 3BF, UK 9
*co-first authors ; † Corresponding author 10
11
Article type: Research 12
13
Email addresses 14
Authors: Emails ORCID
15
Gytis Bernotas: [email protected] 0000-0002-3418-5758 16
Livia C T Scorza: [email protected] 0000-0002-0145-3592 17
Mark F Hansen: [email protected] 0000-0003-4681-6251 18
Ian J Hales: [email protected] 0000-0001-5828-4745 19
Karen Halliday: [email protected] 0000-0003-0467-104X 20
Lyndon N Smith: [email protected] 21
Melvyn L Smith: [email protected] 22
Alistair McCormick: [email protected] 0000-0002-7255-872X 23
24 †
corresponding author: 25
Dr Alistair J. McCormick 26
Daniel Rutherford Building, SynthSys & Institute of Molecular Plant Sciences 27
School of Biological Sciences, University of Edinburgh 28
2 Abstract
30
Background: Tracking and predicting the growth performance of plants in different 31
environments is critical for predicting the impact of global climate change. Automated 32
approaches for image capture and analysis have allowed for substantial increases in the 33
throughput of quantitative growth trait measurements compared to manual assessments. Recent 34
work has focused on adopting computer vision and machine learning approaches to improve 35
the accuracy of automated plant phenotyping. Here we present PS-Plant, a low-cost and 36
portable 3D plant phenotyping platform based on an imaging technique novel to plant 37
phenotyping called photometric stereo (PS). 38
Results: We calibrated PS-Plant to track the model plant Arabidopsis thaliana throughout the 39
day-night (diel) cycle and investigated growth architecture under a variety of conditions to 40
illustrate the dramatic effect of the environment on plant phenotype. We developed bespoke 41
computer vision algorithms and assessed available deep neural network architectures to 42
automate the segmentation of rosettes and individual leaves, and extract basic and more 43
advanced traits from PS-derived data, including the tracking of 3D plant growth and diel leaf 44
hyponastic movement. Furthermore, we have produced the first PS training data set, which 45
includes 221 manually annotated Arabidopsis rosettes that were used for training and data 46
analysis (1768 images in total). A full protocol is provided, including all software components 47
and an additional test data set. 48
Conclusions: PS-Plant is a powerful new phenotyping tool for plant research that provides 49
robust data at high temporal and spatial resolutions. The system is well-suited for small and 50
large-scale research and will help to accelerate bridging of the phenotype-to-genotype gap. 51
52
3 Arabidopsis thaliana, leaf angle, segmentation, machine learning, near-infrared (NIR) LEDs, 54
photomorphogenesis, thermomorphogenesis. 55
56
Introduction 57
Quantitative and accurate methods are required to aid strategies for predicting plant growth 58
performances in our changeable natural environments. Such tools are critical for calibrating 59
predictive models in the face of a changing global climate and our growing global population 60
[1–6]. Computer vision is an evolving technology that is helping to drive advances in plant 61
phenotyping both in fundamental research and agriculture [7–10]. Reflecting its considerable 62
promise, effort has been directed toward automated ground vehicles (AGVs) [11,12], satellite 63
[13], drone [14] and gantry-style platform imaging of field plants [15], and automated 64
phenotyping of greenhouse [16,17] and lab-grown plants (the challenges are different for field 65
and indoor phenotyping) [18,19]. While there have been significant advances, problems 66
associated with high cost, automated data capture, large data sets and variable visual and 67
temporal resolutions have created barriers to the uptake of these technologies. These challenges 68
are currently being addressed in the next generation of plant phenotyping tools. 69
70
Above ground growth is a strong indicator of plant yield and therefore 3D imaging of 71
vegetative growth is a very active area of phenotyping research [20–25]. A number of excellent 72
2D imaging systems have been developed [26–28], however, while they represent a qualitative 73
improvement on manual data capture, they have limited capacity to resolve plant architecture 74
at high resolution. For example, leaf area measurements are affected by blade curvature, leaf 75
angle and movement, making accurate estimations of plant growth challenging using 2D [9,29]. 76
4 2D. These can be classified as passive and active 3D imaging approaches and are briefly 78
outlined below. 79
80
Passive 3D imaging approaches capture plant architecture without introducing new energy (e.g. 81
light) into the environment [30]. Methods and technologies using this approach include multi-82
view stereo [31,32], of which the most common is binocular stereo [33,34], structure from 83
motion [35], light-field (plenoptic) cameras [36], and space carving approaches [37]. Passive 84
approaches that use two or more sensors, or have moving parts (e.g. robot arm or gantry 85
systems), often encounter difficulties in identifying and aligning the same points in different 86
images (i.e. the so called ‘correspondence problem’), which can result in imprecise 87
reconstruction of 3D shapes [38]. Plant leaves and canopies can be particularly challenging as 88
they often represent large homogenous areas with little salient texture. Imprecise 3D 89
reconstructions can be smoothed, but at the expense of plant surface detail [39]. Space carving 90
overcomes the correspondence problem, but requires many different views of an object and 91
may still fail to reconstruct crowded areas (e.g. overlapping leaves) [37]. To our knowledge, 92
only light-field cameras have been utilised successfully for capturing 3D plant growth 93
throughout the diel (day-night) cycle [36,40]. However, light-field systems rely on expensive 94
camera technology to capture high-resolution data, and like other passive approaches, require 95
consistent and favourable lighting conditions. 96
97
Active 3D imaging approaches emit energy (e.g. light), which can overcome several problems 98
associated with passive approaches. Structured light [41] and laser scanners [42–44] are active 99
technologies that rely on triangulation to determine the point locations in a 3D space. Both 100
methods can provide high-quality 3D reconstructions of plant canopy architecture, but 101
5 scanners can be slow, and can potentially heat or even damage plants at high frequencies [45]. 103
Furthermore, triangulation techniques are susceptible to occlusions (e.g. other objects in the 104
environment or leaf overlap) that can reduce data quality. Time of Flight (ToF) cameras (e.g. 105
LiDAR) comprise another active 3D imaging approach that determine the distance of a point 106
directly from the time delay between an emitted light pulse and its reflection. However, the 107
resolution of ToF cameras is still relatively low, which has tended to limit its use to imaging 108
larger plants [46,47]. Although both passive and active 3D imaging approaches can 109
significantly improve the accuracy of plant growth measurements and even expand on the 110
architectural traits available to capture compared to 2D imaging, existing 3D imaging 111
techniques still lack in several crucial areas such as speed, availability, portability, spatial 112
resolution and cost [25]. 113
114
Photometric Stereo (PS) is an active imaging technique that is low-cost and can achieve high 115
image resolutions and fast capture speeds [48]. This approach has been applied only recently 116
to plant phenotyping and has shown significant promise [49]. PS relies on a set of images of 117
an object captured under controlled, varied and directional illumination (Fig. 1; Supplementary 118
Information S1). The obtained images are then used to generate a dense surface normal (SN) 119
map of matching resolution, where each pixel represents a normal vector’s components (i.e. 120
the orientation in three cardinal directions - x, y and z) that allows the overall orientation of the 121
object to be determined. Prior work has shown that plant leaf SN data acquired by PS can be 122
captured at high resolutions (4.1 megapixel (MP)), and thus has significant advantages in 123
encoding complex 3D morphology to aid challenging automated recognition and quantification 124
tasks, such as the extraction of plant growth data [49,50]. 125
Machine learning is now emerging as a promising field to transform the automation of trait 126
6 (hereafter Arabidopsis) has revealed much about the molecular processes underlying the 128
relationship between leaf area, biomass and yield [53], and several methods have been 129
developed for automating data extraction from Arabidopsis images [54–56]. Recently, 130
significant advances have been made in the development of artificial neural networks (NNs) 131
for automated segmentation of the rosette and individual leaves, and leaf counting using 2D 132
image data [57–59]. However, the performance of NN approaches for leaf segmentation, for 133
example, are still limited by a need for large annotated data sets for training, as models trained 134
with small-scale databases typically generalise weakly. To our knowledge, currently there are 135
no NN models optimised for leaf segmentation using 3D data. A subsequent challenge is 136
accurate object tracking to enable segmented leaves to be tracked across different time points 137
of a data set [60,61]. 138
139
Here we present a novel, low-cost imaging system called PS-Plant that for the first time utilises 140
PS for monitoring the growth and development of Arabidopsis in 3D. We compared the 141
accuracy of 3D vs 2D data from PS-Plant for estimating leaf area, angle, and rosette growth 142
against ground truth measurements and showed comparable results to the state-of-the-art 3D 143
light-field camera and laser scanning systems [36,43,44]. To demonstrate the versatility of PS-144
Plant, we analysed growth under a matrix of different conditions that illustrate the dramatic 145
effect of the environment on the 3D phenotype of a wild-type Arabidopsis plant. Furthermore, 146
we showed that 3D data from PS-Plant can be used to train NN models for automated leaf 147
segmentation of a growing rosette, as an important first step in extracting plant features. 148
Finally, we demonstrated that utilisation of machine learning for leaf segmentation and PS data 149
can be combined to extract useful growth traits related to dynamic leaf movement and rosette 150
development. 151
7 Results and discussion
153
Photometric stereo imaging using PS-Plant provides accurate spatial data for Arabidopsis 154
plants 155
PS-Plant consists of a machine vision camera surrounded by four or eight Near Infrared (NIR) 156
Light Emitting Diodes (LEDs) and a bespoke LED controller that allows rapid switching of the 157
LEDs for high temporal data acquisition (Fig. 1A-C; Supplementary Data S1). PS-Plant can 158
acquire up to 40 2D images per second at a spatial resolution of 2048 × 2048 pixels. The 159
acquisition process takes 125-225 milliseconds per set of PS images, followed by ca. 5 s to 160
process the 2D images to compute SN map estimations and 3D surface integration 161
(Supplementary Information S1 and S2). A NIR filter positioned in front of the lens provides 162
consistent contrast and brightness for images captured throughout the diel cycle. The camera 163
provides a 17 x 17 cm field of view that allows simultaneous tracking of up to nine Arabidopsis 164
plants in 5 x 5 cm pots. Growth data sets for individual plants were extracted from each master 165
image experiment data set using a Python-based GUI software. Overall, PS-Plant is portable 166
and light-weight (ca. 7 kg without a PC) and could be adjusted to fit in different growth 167
environments including growth cabinets or greenhouse environments. At the time of 168
manufacture, the total cost for PS-Plant was approximately US$3,200. 169
170
A key assumption in PS is that the surface of the imaged object should exhibit Lambertian 171
reflectance (i.e. it reflects light equally in all directions, while the reflected intensity diminishes 172
according to the Lambert’s cosine law) (Supplementary Information S1) [48]. As the 173
reflectance of the object deviates from the Lambertian model, the subsequent estimation error 174
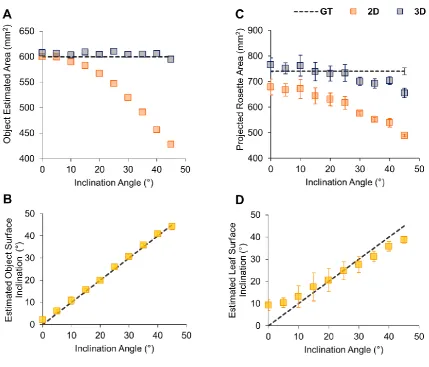
increases accordingly. To verify if PS-Plant could accurately estimate total area and angle of 175
an object, we initially used rectangular flat pieces of acrylic of known area (600 mm2) covered 176
8 and imaged with a black matte background to facilitate image segmentation [63]. The acrylic 178
objects were placed on laser cut wedges to allow imaging at a range of known angles (Fig. 2A). 179
The projected areas were estimated using 2D and 3D data obtained from PS-Plant. The 3D data 180
enabled us to estimate the object inclination angles, which were compared to the ground truth 181
(Fig. 2B). Using 3D data, the area was estimated accurately up to 45° with a Mean Relative 182
Error (MRE) of 1.0% (see Supplementary Information S3 for formulas). In contrast, estimates 183
based on 2D data became inaccurate at inclinations greater than 10°, with a MRE of 10.3% 184
when all angles were considered. Angle estimations consistently matched the known angle for 185
all inclinations tested with a Mean Absolute Error (MAE) of 0.89°. These results highlighted 186
the accuracy of PS-Plant in estimating the angle and area of a flat object in 3D space. 187
188
Next, we investigated Arabidopsis rosettes in PS-Plant and observed that Arabidopsis leaves 189
exhibited near Lambertian reflectance under NIR light (Supplementary Information S1). We 190
hypothesised that longer wavelengths penetrate deeper into the leaf and are then typically 191
scattered, rather than specularly reflected at the leaf surface [64,65]. Similarly to the object 192
area and angle estimation experiment, we imaged Arabidopsis rosettes inclined from 0° to 45° 193
using a rotary inclination table and compared the estimated areas using 2D and 3D data with 194
ground truth measurements of the imaged rosettes (Fig. 2C). Even without inclination (i.e. at 195
0°) estimates based on 3D data were more accurate compared to those from 2D data, indicating 196
that the former was more capable of approximating areas for complex objects that include a 197
degree of surface topographic relief (e.g. an Arabidopsis rosette). 3D data continued to 198
outperform 2D data at increased inclinations with a MRE of 4.5% and 18.1% for 3D and 2D 199
estimations, respectively. The accuracy of 3D estimations did decrease at angles >30° due to 200
the increase in leaf (self-) occlusion that occurred when the whole rosette was inclined 201
9 selected individual leaves from the Arabidopsis rosettes (Fig. 2D), PS-Plant achieved a MAE 203
of 3.8° for leaf angle estimations. We observed that the estimated and known leaf inclination 204
angle correlated in the mid-range (10 to 30°) but less so at lower and higher angles. This was 205
likely due to the natural curvature of Arabidopsis leaves compared to a flat surface, as 206
Arabidopsis leaf blades typically have a convex shape when observed from above. Therefore, 207
when the leaves were not inclined (i.e. at 0°), the estimated angles were still higher than zero 208
as they were calculated from the varying SN values across each leaf blade surface. 209
210
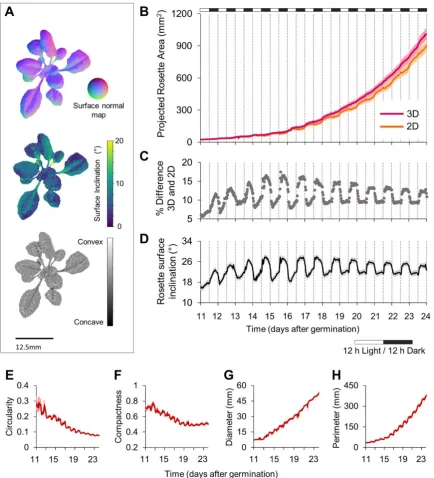
PS-Plant enables accurate 3D reconstructions of growing Arabidopsis rosettes 211
Following validation, we assessed the accuracy and consistency of PS-Plant in monitoring plant 212
growth and mean rosette inclination over time (Fig. 3). PS-Plant captured both 2D and 3D data 213
for Arabidopsis plants for 12 days, starting from 11 days after germination (DAG) in standard 214
growth conditions (22 °C, 150 µmol photons m-2 s-1, 12 : 12 hr light : dark). The automated 215
image capture program resulted in a SN map produced for each plant every 30 minutes that 216
was used to characterise rosette surface curvature (Fig. 3A) as described in Supplementary 217
Information S1. Furthermore, SN data could be used to derive rosette surface inclination angles 218
and concavity/convexity values. Such information can be used, for example, in leaf 219
developmental analysis to evaluate perturbances in normal leaf abaxial / adaxial expansion 220
[66,67]. 221
222
Both 2D and 3D data sets produced exponential growth curves for projected rosette area (PRA) 223
that were typical for Arabidopsis growth (Fig. 3B). However, 2D data consistently 224
underestimated PRA and showed erroneous reductions in area estimates consistent with 225
rhythmic nastic leaf movements (Fig. 3C, D; Supplementary Data S2). In contrast, 3D data 226
10 increased more smoothly over the time course of the experiment. The small decreases observed 228
for PRA from 3D data were associated with self-occlusion at high leaf inclination angles (as in 229
Fig. 2). A number of studies have shown that growing Arabidopsis leaves exhibit rhythmic 230
movement that is controlled by the circadian oscillator [68–71]. PS-Plant estimations of rosette 231
surface inclination (i.e. the total inclination of all rosette leaf blades and petioles) is able to 232
accurately record this rhythmicity, which in our 12L:12D conditions achieved an amplitude 233
peak at 4-6 hr post dusk (Fig. 3D) (calculated using BioDare2; see Materials and Methods). 234
Interestingly, our data showed that leaf rhythmicity appears to be anticipatory up to 16 DAG, 235
after which it was strictly diurnal. As older plants have a higher proportion of mature leaves, 236
that are no longer elongating, our data suggests that these leaves still exhibit rhythmic 237
movements but they are driven by the daily light-dark cycle rather than the circadian oscillator. 238
These data highlight the capability of PS-Plant to not only provide accurate area estimates, but 239
to capture leaf movement rhythms that are regulated by the circadian clock and the prevailing 240
photoperiod. 241
242
Rosette architectural parameters derived from 2D data were also obtained from PS-Plant, 243
including circularity (or stockiness), compactness, diameter and perimeter (Fig. 3E-H) 244
[36,72,73]. These data showed, for example, an increase in perimeter and diameter that was 245
consistent with plant growth, and a decrease in compactness, which was associated with 246
elongation of leaf petioles as the rosette developed. 247
248
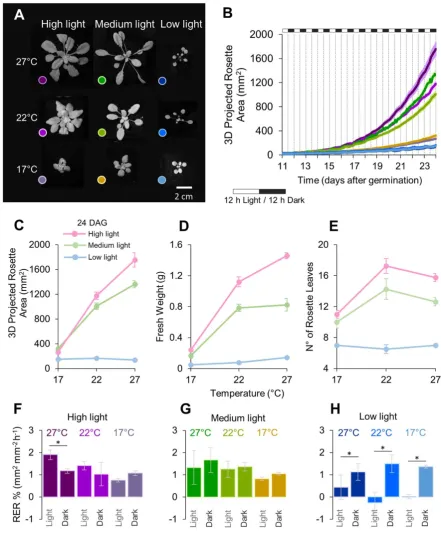
PS-Plant reveals 3D growth traits for Arabidopsis plant grown in different environments 249
We next wanted to establish whether PS-Plant could capture alterations in growth plasticity 250
induced by changes in the external light and temperature environment. Low levels of 251
11 plants exhibit elongated stems and petioles, increased hyponasty and smaller and fewer leaves 253
[74–76]. As high temperatures to some extent target the same molecular pathways, heat also 254
elicits an SAR-type response [77,78]. These studies illustrate that the growth strategy adopted 255
by the plant is strongly dependent on the surrounding light environment and the ambient 256
temperature. To capture these morphological changes we tracked Arabidopsis plants under 257
nine conditions that differed in temperature [17 (LT), 22 (LT) and 27°C (HT)] and light 258
intensity [40 (LL), 150 (ML) and 300 µmol photons m-2 s-1 (HL)] (Fig. 4A; Supplementary Fig. 259
S1; Data S3). 260
261
Plants grown in LL had small leaves, recorded as low PRA, which was comparable in plants 262
grown at different temperatures. Increases in light levels led to a concomitant rise in PRA, 263
however, over light intensities of 150 µmol m-2 s-1 the PRA was strictly temperature-dependent 264
with the highest PRA achieved at the highest light and temperature (Fig. 4B). The observed 265
differences in PRA were reasonably consistent with overall biomass accumulation at 24 DAG 266
(Fig. 4C, D). Notably, in ML plants a shift from 17°C to 22°C led to an increase in biomass, 267
while a shift from 22°C to 27°C did not. Although we have not measured leaf thickness, 268
previous work has shown that plants grown in high temperatures tend to have thinner leaves 269
and a higher specific leaf area (the ratio of leaf area to dry mass) [79,80], which could explain 270
the increase in area from 22°C to 27°C but no increase in biomass. HL and ML plants produce 271
more leaves at 22°C compared to 17°C, signifying a larger investment in vegetative growth. 272
Plants grown at 27°C induced flowering in HL and ML plants and so their final leaf number 273
was slightly lower than at 22°C (Fig. 4E). 274
275
Together, these results could be explained by the thermodynamic relationship between the dark 276
12 assimilation rate of CO2 by Rubisco is temperature-dependent, such that increased 278
temperatures (up to ca. 30 °C) typically correlate with increased CO2 assimilation in C3 plants 279
grown under non-limiting light conditions [81–83]. These photochemical processes most likely 280
underlie the light- and temperature-dependent changes in PRA and investment in leaf biomass 281
production. Contrasting with this, in LL the supply of ATP and NADPH to the Calvin cycle 282
by the light reactions may have constrained CO2 uptake, and thus growth rates were not 283
increased by higher temperatures. 284
285
PS-Plant also captured differences in petiole length. Analysis of the ML and HL illustrated that 286
increased temperature stimulated petiole elongation in these plants. This is evident in PS-Plant 287
measurements of plant compactness. However, this data also show that HL plants are generally 288
more compact than ML (Supplementary Fig. S2), and that temperature-mediated differences in 289
compactness are less evident in plants grown in HL. This indicates that plants tend to invest 290
more in leaf expansion compared to petiole elongation under higher light intensities. 291
292
We then compared the relative expansion rate (RER) based on 3D PRA data for different light-293
temp conditions over the diel cycle (Fig. 4F-H). RER data for Arabidopsis vary between 294
different studies, but generally have comparable rates within light and dark periods for wild-295
type plants grown under standard growth conditions [9,36,43,84]. In the present study, RER in 296
the dark period was not significantly different across all growth conditions tested [as 297
determined by one-way ANOVA (p < 0.05), followed by Tukey’s HSD tests]. This was not 298
unexpected, as the rate of leaf starch turnover during the night is known to be maintained over 299
a wide range of environmental conditions and temperatures in Arabidopsis [85,86]. RER values 300
during the light period were comparable for plants grown in ML and plants grown in HL-MT 301
13 dark period. As HL-HT plants also had the highest biomass accumulation (Fig. 4D), results 303
obtained with PS-Plant suggest HL-HT plants were limited more by carbon turnover than CO2 304
assimilation. All plants grown in LL had a significantly decreased RER in the light compared 305
to the dark period. Notably, temperature had no impact on RER in the light for LL plants, 306
indicating that photosynthetic growth was primarily limited by the low irradiance. Further 307
studies on carbon allocation and starch turnover should be carried to complement these 308
observations and hypotheses generated using PS-Plant data. 309
310
The internal circadian clock in plants has a periodicity close to 24 hr that can be entrained by 311
environmental cues [87]. Thus, we next used PS-Plant to examine the rhythmicity of total leaf 312
movement (i.e. rosette surface inclination, see Fig. 3D) to compare the capacity of entrainment 313
of the clock to different growth conditions (Fig. 5A-C; Supplementary Fig. S3) [68]. We 314
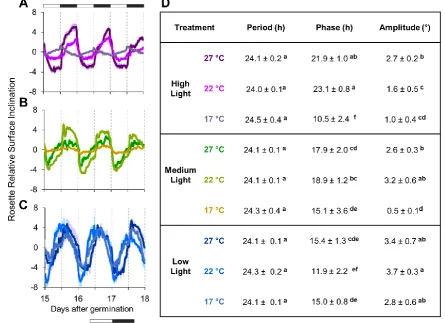
compared three standard parameters: period, phase and amplitude [87,88]. 315
316
As expected, all conditions showed a similar period for leaf movement of ca. 24 hr (p < 0.05) 317
as all plants were grown in a 12 : 12 hr light : dark cycle (Fig. 5D). However, phase and 318
amplitude differed between growth conditions. Through all conditions peak phase occurred 319
during the night, with the general observation that incremental rises in light intensity led to a 320
phase delay in the peak. A possible exception is that in 17°C HL rhythms peaked at the end of 321
the day. It is noteworthy that the 17°C ML and HL leaf rhythm traces are very low amplitude, 322
most likely because these plants had very limited petiole growth. We also found that 323
temperature effects the phase of the rhythm across all light conditions. For example, in both 324
ML and HL growth at 27°C advanced the peak phase compared to 22°C. 325
14 Monitoring plant behaviour through time revealed the impact on light and temperature through 327
development (Supplementary Fig. S3). A common trend is that warm temperatures increase 328
mean rosette leaf inclination angle, or hyponasty, though the threshold for this response varies 329
in the different light treatments. Another notable feature is that hyponasty and rhythm 330
amplitude dampen over time. Our data show that under LL the leaf movement rhythms are 331
more sinusoidal and higher amplitude rhythms than in ML and HL. Leaf movement rhythm 332
waveforms of ML and HL are also quite different from LL, with some evidence of tracking 333
dawn and dusk. Interestingly in HL the rhythm at 17°C is clearly in antiphase with 22°C and 334
27°C. Through time the 17°C rhythm dampens to high leaf hyponasty, while 22°C/ 27°C leaf 335
rhythms dampen to a low leaf angle. In both cases this effect appears to arise from a gradual 336
reduction in rhythmic regulation during the night period. Overall, these data illustrate that PS-337
Plant is able to extract quantitative data on a large range of traits associated with rhythmic leaf 338
growth that are typically challenging to capture. 339
340
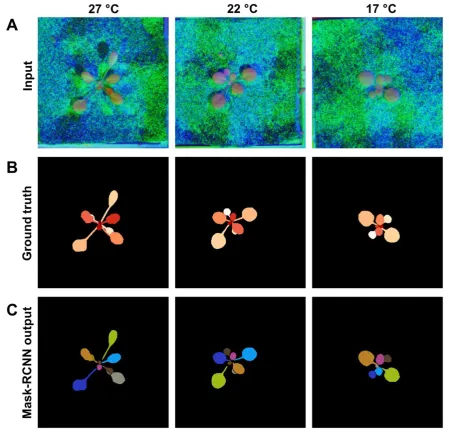
Use of PS-Plant data and machine learning for accurate leaf segmentations 341
Our next goal was to examine the capacity of PS-Plant to track the phenotypic behaviour of 342
individual leaves on a growing Arabidopsis rosette. To achieve this, we labelled individual 343
leaves in 221 images of ML-MT rosettes (Supplementary Information S5) and used machine 344
learning approaches to segment leaves. We compared two available NN architectures, the end-345
to-end recurrent neural network with recurrent attention (RNN) [58] and the Mask R-346
convolutional neural network (R-CNN) [89], to examine the suitability of PS-Plant data for 347
NNs designed for instance segmentation using RGB images. We focused on ML-MT plants as 348
their growth was more uniform across different individuals compared to other growth 349
conditions, which allowed the models to converge faster and achieve better results during the 350
15 and validating the models, respectively. To avoid overfitting the model, we manually 352
partitioned plant images for training and validation data sets to ensure that all time-series 353
images of a single specimen appear in either training or validation data sets, but not both. 354
355
PS-Plant produces a range of different data: from grayscale images to SN maps (e.g. Fig. 3). 356
We trained the RNN and R-CNN architectures from initial random weights, while R-CNN was 357
also pre-trained using transfer learning weights generated using the COCO data set [90]. The 358
RNN and R-CNN architectures were trained using three different types of PS data to compare 359
for segmentation accuracy: i) composite (SN in x and y direction, and albedo for RGB layers), 360
ii) grayscale, and iii) albedo images. All data used for training, including the raw PS-Plant data 361
and rosette masks are available as outlined Supplementary Information S5. The obtained leaf 362
segmentations were compared to the ground truth images using Symmetric Best Dice (SBD; 363
score of the accuracy of leaf instance segmentation) and Foreground-Background Dice (FBD; 364
score of the accuracy of rosette segmentation) evaluation formulas (Supplementary 365
Information S3) [91]. 366
367
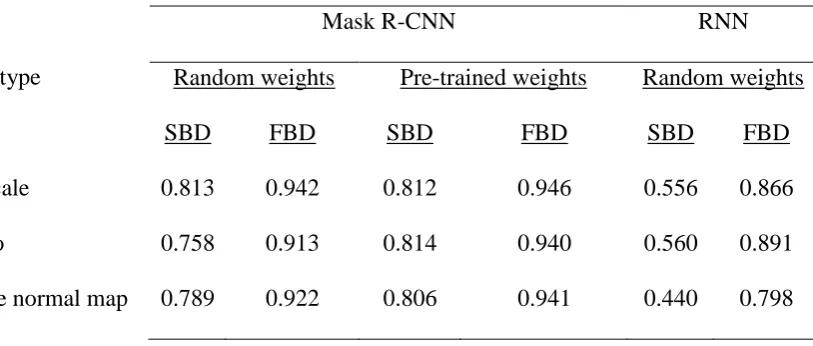
The type of PS data used did not significantly influence SBD or FBD scores, suggesting that 368
accuracy of RGB-based models was not affected by the different types of PS-based data. The 369
most accurate leaf segmentation results were achieved with models based on the R-CNN 370
architecture using pre-trained weights (Fig. 6; Table 1), resulting in SBD scores that ranged 371
from 0.806 (composite image) to 0.814 (albedo). In comparison, the RNN architecture resulted 372
in lower SBD scores of 0.440 (composite image) and 0.560 (albedo and grayscale). The pre-373
trained R-CNN model also achieved the most accurate rosette segmentation results, with FBD 374
scores ranging from 0.94 (albedo) to 0.946 (grayscale). In contrast, FBD scores for the RNN 375
16 performance of the RNN architecture was worse for both leaf and rosette segmentation with 377
our data sets when compared to the R-CNN approach. 378
379
Table 1. Performance comparison of leaf instance segmentation for two different machine 380
learning architectures. The Mask R-CNN [89] and RNN [58] architectures were trained with 381
composite (SN in x and y direction, and albedo for RGB layers), grayscale or albedo images. 382
The training procedure for the RNN architecture was the same as proposed by the authors [58], 383
while the Mask R-CNN was as follows: head layers for 10 epochs at 10−2 Learning Rate (LR);
384
all layers for 30 epochs at 10−2 LR, 30 epochs at 10−3 LR, 30 epochs at 10−4 LR, and head 385
layers for 10 epochs at 10−4 LR. The Mask R-CNN was trained both from initial random 386
weights and from pre-trained model weights, while RNN was only trained from initial random 387
weights. Abbreviations: SBD, Symmetric Best Dice; FBD Foreground-Background Dice. 388
389
Image type
Mask R-CNN RNN
Random weights Pre-trained weights Random weights
SBD FBD SBD FBD SBD FBD
Grayscale 0.813 0.942 0.812 0.946 0.556 0.866
Albedo 0.758 0.913 0.814 0.940 0.560 0.891
Surface normal map 0.789 0.922 0.806 0.941 0.440 0.798
390
Using PS-Plant data for dynamic tracking of individual leaf growth and movement 391
We next investigated the performances of four different approaches for tracking leaves using 392
the segmented image data sets (e.g. Fig. 6): i) kernelized correlation filters [92], ii) optical flow 393
[93], iii) multiple instance learning tracker [94], and iv) a particle filter [95]. Object tracking, 394
[image:16.595.112.519.430.603.2]17 areas in computer vision [60,61]. Tracking Arabidopsis leaves over time is particularly 396
challenging due to changes in both shape and movement during growth together with 397
associated occlusions (Supplementary Information S4). The best results were achieved with a 398
particle filter based on leaf instance centroid location and velocity across the time-series images 399
(Fig. 7). Leaf overlap remained a limitation, as an occluding leaf was sometimes assigned the 400
label of an occluded leaf. However, erroneous labelling was found to be infrequent and 401
straightforward to manually corrected post hoc, resulting in a robust semi-automated leaf 402
tracker (Supplementary Data S4). 403
404
Once we were confident that we could reliably track individual leaves using PS-Plant, we 405
separated leaf blades and petioles by applying a morphological opening function with a 406
predefined radius (3 to 11 pixels based on the leaf size) to the leaf binary mask. The point of 407
differentiation (PB) is the mean x and y coordinates of the leaf blade and petiole (Fig. 8A). This 408
enabled separate examinations of leaf blade and petiole traits. We then derived separated tissue-409
specific data including leaf blade area and inclination angle, and leaf blade and petiole length. 410
The angle of leaf blade inclination was estimated using two different methods: i) a point-based 411
approach where leaf blade angle was determined using SN data across the line from PB to the 412
leaf tip (PT), and ii) the mean surface inclination of the whole leaf blade. Both methods 413
produced similar results (Supplementary Fig. S4). However, we chose to use the latter (ii) as 414
the PB was not always visible due to leaf occlusions or the petiole being too small to be 415
distinguished (e.g. maturing leaves or leaves grown in low temperature). 416
417
To demonstrate our approach, we tracked leaves 1 to 4 of plants grown in ML at three different 418
temperatures from 15 to 18 DAG. Leaves 1 to 4 were chosen as representative examples of 419
18 Consistent with our findings for PRA under different growth conditions (Fig. 4; Supplementary 421
Fig. S1), the leaf blade areas of maturing and immature leaves from HT plants were 422
significantly larger than leaf blades from MT and LT plants [as determined by one-way 423
ANOVA (p < 0.05), followed by Tukey’s HSD tests; Fig. 8B]. The latter results confirmed that 424
the increased PRA observed using PS-Plant for plants grown in HT plants was specifically 425
associated with an increase in leaf blade area. Leaves that emerged prior to the start of the 426
experiment at 11 DAG (i.e. leaf 1) showed an increase in leaf blade area in HT plants compared 427
to MT and LT plants (Fig. 8B). However, leaves that emerged after 11 DAG (i.e. leaf 4) had 428
an even more dramatic growth response to increased temperatures. For example, the blade area 429
for leaf 1 and 4 at 17 DAG was 40% and 130% higher in HT compared to LT, respectively. 430
Similarly, the mean surface inclination of leaf blades was higher in HT (Fig. 8C). The latter 431
result was also consistent with our findings for whole rosette surface inclination at higher 432
temperatures (Fig. 3; 5; Supplementary Fig. S3). 433
434
We then calculated parameters associated with diurnal movement for individual leaf blades 435
(Fig. 8D). We targeted immature leaf blades as their movement patterns were clearer and more 436
consistent compared to maturing leaf blades. Period or phase measurements from immature 437
leaf blades were generally similar between growth conditions and comparable to values for 438
whole rosettes (Fig. 5). In contrast, measurements of immature leaf blade amplitude were 439
significantly enhanced at MT and HT and generally higher than values for whole rosettes. This 440
was not unexpected as immature leaves are more active than older leaves and contribute more 441
to overall whole rosette amplitude (see Supplementary Data S3 and S5). Furthermore, the 442
observed temperature-associated increases in amplitude and leaf hyponasty were consistent 443
with whole rosette data (Fig. 5D; Supplementary Fig. S3B). Thus, we concluded that 444
19 rosettes or individual leaf blades. The values obtained in the present study for period and phase 446
are comparable to those reported for wild-type plants under standard growth conditions by 447
other automated top-down systems for monitoring leaf movement, such as OSCILLATOR 448
[96]. 449
450
Finally, we used PS-Plant to reveal whether petiole elongation showed a similar response to 451
temperature as the leaf blade by comparing the ratio of leaf blade and petiole length from 452
maturing and immature leaves (Fig. 8E). Petioles have been shown to elongate faster at higher 453
temperatures [77,80,97]. In the present study we observed that leaves from MT and LT plants 454
had a blade: petiole length ratio that ranged from 2: 1 to 4: 1. Immature leaves did not have a 455
detectable petiole under LL, thus only maturing leaves were included at LT. In contrast, HT 456
plants had ratios of approximately 1: 1 for both maturing and immature leaves, indicating that 457
HT resulted in an increase petiole elongation relative to leaf blade growth under ML. Future 458
work should examine this ratio at different light intensities, as petioles and leaf blades are 459
known to have different responses to light. For example, petioles are known to elongate faster 460
under low light while leaf blades grow more slowly [78,98]. 461
462
Conclusion 463
In this paper, we have introduced an adaptable and low-maintenance platform for affordable, 464
advanced image-based phenotyping. A key goal was to ensure accessibility to the research 465
community. In this regard, PS-Plant can be considered a powerful, alternative solution to 3D 466
systems based on laser scanning and light-field camera technologies [36,43], which is 467
particularly well suited for setup in low-income or developing countries. Our system exploits 468
the richer data provided by PS-Plant with a combination of traditional image processing and 469
20 manner. Here, we have demonstrated that PS-Plant is able to accurately monitor several growth 471
traits and diurnal rhythms of different phenotypes of Arabidopsis plants produced in response 472
to varied environments. This provides credibility that future work with PS-Plant will produce 473
robust data for a wide variety of mutant phenotypes. Additionally, the concomitant 474
quantification of overall growth, leaf traits and circadian rhythms can facilitate a better 475
understanding of the relationships among environment, plant yield and internal molecular 476
networks. Previous work has also highlighted that PS can capture high-resolution 3D surface 477
details of leaf surface structures, such as leaf curvature and trichomes, which could be used to 478
investigate dynamic changes in leaf development [50]. Research in plant phenotyping needs to 479
focus on increasing accessibility and instituting effective data standards and management 480
practices to assist with improving plant productivity and genetic gain [99,100]. To help 481
accelerate the latter, we have provided the PS training imaging data set from this study for 482
community access (Supplementary Information S5) and a detailed protocol for software usage 483
and data analysis with a test experimental data set (Supplementary Information S6). In its 484
current design, PS-Plant is optimal for measuring growth traits in rosette-shaped plants such as 485
Arabidopsis. However, we believe it can also be used during the seedling stage of other eudicot 486
species (e.g. tomato, cabbage, oilseed rape) to analyse circadian rhythms by observing the 487
rhythmic movements of cotyledons. Future work with PS-Plant will focus on improvements in 488
leaf tracking [101], integration with spectral information [102], and incorporation of a low-cost 489
depth camera to combine the high resolution of PS with a lower resolution depth map to 490
characterise whole plants with more complex architectures. 491
492
Materials and Methods 493
21 Arabidopsis (Arabidopsis thaliana (L.) Heynh. Col-0) wild-type seeds were stratified for 2-3 495
days at 4 °C. Each seed was placed in a square pot (50 mm) containing F2+S compost 496
(Levington) covered in acrylic black felt fabric with a central hole (5 mm) and germinated at 497
22 ºC under white light (150 µmol photons m-2 s-1 at the plant level) in 12 : 12 hr light : dark 498
for 10 d in a Percival growth cabinet (SE‐41AR2). For the plant area validation experiment, 499
the plants were kept in this cabinet for 22 DAG. For imaging with PS-Plant, the seedlings were 500
transferred to a Snijders growth cabinet (Microclima MC1000). 501
502
PS-Plant hardware 503
PS-Plant consists of a machine vision NIR monochrome camera (Grasshopper3 GS3-U3-504
41C6NIR-C, FLIR Systems Inc., Canada) with a 16 mm fixed focal length lens (Kowa 1”SC 505
LM25SC, Kowa Company Limited, Japan) with a NIR filter attached (LP920, MidOpt, Illinois, 506
USA), four or eight NIR LEDs (PowerStar IR 940 nm, Intelligent LED Solutions, UK), and 507
an in-house designed LED controller that allows rapid switching of LEDs using an Arduino 508
platform (MKRZero, Arduino, Italy). The camera and LEDs were fixed on a square acrylic 509
sheet (44 × 44 cm) and positioned at a height of 40 cm above the imaging plants (Fig. 1B, C). 510
The camera was positioned centrally in the sheet and the LEDs were positioned around the 511
camera at 45º angle increments. The LEDs were tilted at a 30º angle to illuminate the area 512
under the camera field of view (Fig. 1B). The base of the rig was painted matt black to limit 513
the introduction of specularities from the background. A PC laptop (K501UQ-DM050T, 514
AsusTek Computer Inc., Taiwan) was used to control LED illuminations, and acquire, store 515
and process images using GUI software written in Python. Details on rig assembly and the 516
LED controller design are outlined in Supplementary Information S2. 517
518
22 The leaf movement rhythm analysis was performed using the mean inclination angles (whole 520
rosette or individual leaf blade) as an input for BioDare2 beta (https://biodare2.ed.ac.uk/). The 521
data was treated with baseline detrending prior to period, phase and amplitude estimations, 522
which was done using the MFourFit algorithm [88]. 523
524
AVAILABILITY OF SUPPORTING DATA 525
The training data set supporting the results of this article is available in an Edinburgh DataShare 526
repository (https://datashare.is.ed.ac.uk/handle/10283/3280) and outlined in Supplementary 527
Information S5. This data set represents approximately 0.4% of the 50,625 images captured 528
during the “matrix” growth experiment (see Fig. 4A). A user protocol is available in 529
Supplementary Information S6 to assist with software installation (all software is available at 530
https://bit.ly/2EFOk0O, the PS-Plant software RRID number is SCR_017032) and provides 531
detailed instructions from image capture through to dynamic growth analyses. Furthermore, a 532
test data set is available in the Edinburgh DataShare repository 533
(https://datashare.is.ed.ac.uk/handle/10283/3279). 534
535
ADDITIONAL FILES 536
Supplementary Information S1. Overview of 2D image data processing captured using PS-537
Plant. 538
Supplementary Information S2. Overview of the PS-Plant hardware. 539
Supplementary Information S3. Formulas. 540
Supplementary Information S4. Area estimation errors. 541
Supplementary Information S5. PS-Plant training data set description. 542
Supplementary Information S6. PS-Plant protocol. 543
23 Supplementary Figure S2. Rosette compactness for plants grown in different conditions. 545
Supplementary Figure S3. Mean rosette surface inclinations for all growth conditions 546
separated by light treatment. 547
Supplementary Figure S4. Estimated leaf inclination of leaf 1 in medium light and 27oC. 548
Supplementary Data S1. Interactive 3D model of the PS-Plant system. The model is 549
provided as an .stl file (Rich Media 1.stl), an online link to zoomable, colour version can be 550
found here: https://bit.ly/2GXNhLy. 551
Supplementary Data S2. Comparison of Arabidopsis growth from 2D and 3D data. The 552
graph (top) includes standard deviation of PRA data for three plants growing under conditions 553
outlined in Fig. 3. Examples of plant growth are shown below for 2D [albedo; bottom left (see 554
Supp. Info. 1 for details)] and surface normal map data (bottom right). 555
Supplementary Data S3. Arabidopsis plants grow and move differently under different 556
light and temperature conditions. Examples of (A) surface normal models or (B) greyscale 557
images for plants of the same age under each growth conditions tested (see Fig. 4) are shown 558
from 11 to 24 DAG. 559
Supplementary Data S4. Automated tracking of individual Arabidopsis leaves. Example 560
of leaf label tracking following rosette segmentation of a ML-MT plant shown from 15 to 18 561
DAG. Note that leaves retained the same colour after tracking (right). 562
Supplementary Data S5. Using PS-Plant for automated tracking of individual 563
Arabidopsis leaf movement in 3D. Four videos illustrate leaf blade tracking of leaves 1 to 4, 564
respectively, for a plant grown in ML-MT from 15 to 18 DAG. Each video shows a trail of leaf 565
blade centroid movement (red dots) on an albedo 2D video (top left). Blue dots illustrate leaf 566
blade movement on 2D x-y (bottom left) and y-z projections (bottom right), and a 3D x-y-z 567
graph (top right). 568
24
DECLARATIONS
570
List of abbreviations
571
2D: two dimensional; 3D: three dimensional; ANOVA: analysis of variance; AGV: automated 572
ground vehicles; COCO: common objects in context database; DAG: days after germination; 573
FBD: foreground-background dice score; GUI: graphical user interface; HL: high light; HSD: 574
Tukey's honest significant difference test; HT: high temperature; LED: light emitting diode; 575
LiDAR: distance measurement method using pulsed laser light; LL: low light; LR: Learning 576
Rate; LT: low temperature; MAE: mean absolute error; ML: medium light; MP: megapixel; 577
MRE: mean relative error; MT: medium light; NIR: near-infrared; NN; neural network; PB: 578
leaf base point, or intersection point between leaf blade and petiole; PC: personal computer; 579
PO: rosette origin point; PRA: projected rosette area; PS: photometric stereo; PT: leaf tip point; 580
R-CNN: short for Mask R-CNN NN architecture; RER: relative expansion rate; RGB: red, 581
green and blue channels, or a colour image; RNN: short for end-to-end instance segmentation 582
with recurrent attention NN architecture; SAR: shade avoidance response; SBD: symmetric 583
best dice score; SD: standard deviation; SN: surface normal; ToF: time of flight. 584
585
Consent for publication
586
This study abides by UK guidelines and legislation for plant science research. 587
588
Competing interests
589
The authors declare that they have no competing interests. 590
591
Funding
25 This work was supported by the UK Biotechnology and Biological Sciences Research
593
Council grants BB/N02334X/1, BB/M025551/1 and BB/N005147/1. GB was funded by the 594
University of the West of England (UWE) Partnership Fund. 595
596
Authors' contributions
597
GB, MFH and IJH designed the hardware and software of PS-Plant system including the image 598
processing pipeline. AM, KJH and LCTS designed the plant experimental setup. GB and LCTS 599
performed and analysed the validation experiments. LCTS performed and analysed plant 600
growth experiments. GB designed the study for NN model generation for leaf segmentation. 601
AM, LCTS and GB wrote the manuscript, with assistance from all authors. AM, LNS and MLS 602
supervised the project. 603
604
Acknowledgements
605
We thank Jackie Aim and Stewart Cromar (University of Edinburgh) for assistance with the 606
process of 3D model designs. 607
608
REFERENCES 609
1. Meinke H. Agricultural impacts: Europe’s diminishing bread basket. Nat Clim Chang. 610
2014;4:541–2. 611
2. Long SP, Marshall-Colon A, Zhu XG. Meeting the global food demand of the future by 612
engineering crop photosynthesis and yield potential. Cell. 2015;161:56–66. 613
3. Chew YH, Wenden B, Flis A, Mengin V, Taylor J, Davey CL, et al. Multiscale digital 614
Arabidopsis predicts individual organ and whole-organism growth. Proc Natl Acad Sci. 615
2015;112:E2556. 616
26 potentials of future irrigation water availability on agricultural production under climate 618
change. Proc Natl Acad Sci. 2014;111:3239–44. 619
5. Cang FA, Wilson AA, Wiens JJ. Climate change is projected to outpace rates of niche 620
change in grasses. Biol Lett. 2016;12:20160368. 621
6. Liang X-Z, Wu Y, Chambers RG, Schmoldt DL, Gao W, Liu C, et al. Determining climate 622
effects on US total agricultural productivity. Proc Natl Acad Sci. 2017;114:2285–92. 623
7. Ahmad J, Sun J, Smith L, Smith M. Improving photometric stereo through per-pixel light 624
vector calculation. Br Mach Vis Conf. 2013;1–12. 625
8. Furbank RT, Tester M. Phenomics - technologies to relieve the phenotyping bottleneck. 626
Trends Plant Sci. 2011;16:635–44. 627
9. Dobrescu A, Scorza LCT, Tsaftaris SA, McCormick AJ. A “Do-It-Yourself” phenotyping 628
system: Measuring growth and morphology throughout the diel cycle in rosette shaped plants. 629
Plant Methods. 2017;13:1–12. 630
10. Shakoor N, Lee S, Mockler TC. High throughput phenotyping to accelerate crop breeding 631
and monitoring of diseases in the field. Curr Opin Plant Biol. 2017;38:184–92. 632
11. Underwood J, Wendel A, Schofield B, McMurray L, Kimber R. Efficient in-field plant 633
phenomics for row-crops with an autonomous ground vehicle. J F Robot. 2017;34:1061–83. 634
12. Ruckelshausen A, Biber P, Dorna M, Gremmes H, Klose R, Linz A, et al. BoniRob: an 635
autonomous field robot platform for individual plant phenotyping. Precis Agric. 2009;9:841– 636
7. 637
13. Tattaris M, Reynolds MP, Chapman SC. A Direct Comparison of Remote Sensing 638
Approaches for High-Throughput Phenotyping in Plant Breeding. Front Plant Sci. 2016;7:1– 639
9. 640
14. Sankaran S, Khot LR, Espinoza CZ, Jarolmasjed S, Sathuvalli VR, Vandemark GJ, et al. 641
27 review. Eur J Agron. 2015;70:112–23.
643
15. Virlet N, Sabermanesh K, Sadeghi-Tehran P, Hawkesford MJ. Field Scanalyzer: An 644
automated robotic field phenotyping platform for detailed crop monitoring. Funct Plant Biol. 645
2017;44:143–53. 646
16. da Costa RMF, Simister R, Roberts LA, Timms-Taravella E, Cambler AB, Corke FMK, 647
et al. Nutrient and drought stress: implications for phenology and biomass quality in 648
miscanthus. Ann Bot. 2018;XX:1–14. 649
17. Tester M, Awlia M, Brown T, Wilson P, Rungrat T, Trtilek M, et al. Using Phenomic 650
Analysis of Photosynthetic Function for Abiotic Stress Response Gene Discovery. Arab B. 651
2016;14:1–12. 652
18. Tardieu F, Cabrera-Bosquet L, Pridmore T, Bennett M. Plant Phenomics, From Sensors 653
to Knowledge. Curr Biol. 2017;27:770–83. 654
19. Araus JL, Kefauver SC. Breeding to adapt agriculture to climate change: affordable 655
phenotyping solutions. Curr Opin Plant Biol. 2018;1–11. 656
20. Sharma RC. Selection for biomass yield in wheat. Euphytica. 1993;70:35–42. 657
21. Richards RA. Selectable traits to increase crop photosynthesis and yield of grain crops. J 658
Exp Bot. 2000;51:447–58. 659
22. Arora VK, Singh CB, Sidhu AS, Thind SS. Irrigation, tillage and mulching effects on 660
soybean yield and water productivity in relation to soil texture. Agric Water Manag. 661
2011;98:563–8. 662
23. Zhang H, Flottmann S. Seed yield of canola ( Brassica napus L .) is determined primarily 663
by biomass in a high- yielding environment. Crop Pasture Sci. 2016;67:369–80. 664
24. Zhang H, Flottmann S. Genotypic variation in the accumulation of water-soluble 665
carbohydrate in canola and its potential contribution to seed yield in different environments. 666
28 25. Vázquez-Arellano M, Griepentrog HW, Reiser D, Paraforos DS. 3-D imaging systems for 668
agricultural applications—a review. Sensors (Switzerland). 2016;16. 669
26. Green JM, Appel H, Rehrig EM, Harnsomburana J, Chang JF, Balint-Kurti P, et al. 670
PhenoPhyte: A flexible affordable method to quantify 2D phenotypes from imagery. Plant 671
Methods. 2012;8:1–12. 672
27. Dhondt S, Gonzalez N, Blomme J, De Milde L, Van Daele T, Van Akoleyen D, et al. 673
High-resolution time-resolved imaging of in vitro Arabidopsis rosette growth. Plant J. 674
2014;80:172–84. 675
28. Minervini M, Giuffrida M V., Perata P, Tsaftaris SA. Phenotiki: an open software and 676
hardware platform for affordable and easy image-based phenotyping of rosette-shaped plants. 677
Plant J. 2017;90:204–16. 678
29. Chen JM, Black TA. Defining leaf area index for non‐flat leaves. Plant Cell Environ. 679
1992;15:421–9. 680
30. Bianco G, Gallo A, Bruno F, Muzzupappa M. A comparative analysis between active and 681
passive techniques for underwater 3D reconstruction of close-range objects. Sensors 682
(Switzerland). 2013;13:11007–31. 683
31. Pound MP, French AP, Fozard JA, Murchie EH, Pridmore TP. A patch-based approach to 684
3D plant shoot phenotyping. Mach Vis Appl. 2016;27:767–79. 685
32. Pound MP, French AP, Murchie EH, Pridmore TP. Automated Recovery of Three-686
Dimensional Models of Plant Shoots from Multiple Color Images. Plant Physiol. 687
2014;166:1688–98. 688
33. Biskup B, Scharr H, Schurr U, Rascher U. A stereo imaging system for measuring 689
structural parameters of plant canopies. Plant, Cell Environ. 2007;30:1299–308. 690
34. Burgess AJ, Retkute R, Pound MP, Mayes S, Murchie EH. Image-based 3D canopy 691
29 Ann Bot. 2017;119:517–32.
693
35. Jay S, Rabatel G, Hadoux X, Moura D, Gorretta N. In-field crop row phenotyping from 694
3D modeling performed using Structure from Motion. Comput Electron Agric. 2015;110:70– 695
7. 696
36. Apelt F, Breuer D, Nikoloski Z, Stitt M, Kragler F. Phytotyping4D: A light-field imaging 697
system for non-invasive and accurate monitoring of spatio-temporal plant growth. Plant J. 698
2015;82:693–706. 699
37. Gibbs J, Pound M, French A, Wells D, Murchie E, Pridmore T. Plant Phenotyping: An 700
Active Vision Cell for Three-Dimensional Plant Shoot Reconstruction. Plant Physiol. 701
2018;1–26. 702
38. Tippetts B, Lee DJ, Lillywhite K, Archibald J. Review of stereo vision algorithms and 703
their suitability for resource-limited systems. J Real-Time Image Process. 2016;11:5–25. 704
39. Xiong X, Yu L, Yang W, Liu M, Jiang N, Wu D, et al. A high-throughput stereo-imaging 705
system for quantifying rape leaf traits during the seedling stage. Plant Methods. 2017;13:1– 706
17. 707
40. Apelt F, Breuer D, Olas JJ, Annunziata MG, Flis A, Nikoloski Z, et al. Circadian, Carbon, 708
and Light Control of Expansion Growth and Leaf Movement. Plant Physiol. 2017;174:1949– 709
68. 710
41. Nguyen TT, Slaughter DC, Max N, Maloof JN, Sinha N. Structured light-based 3D 711
reconstruction system for plants. Sensors (Switzerland). 2015;15:18587–612. 712
42. Paulus S, Schumann H, Kuhlmann H, Léon J. High-precision laser scanning system for 713
capturing 3D plant architecture and analysing growth ofcereal plants. Biosyst Eng. 714
2014;121:1–11. 715
43. Dornbusch T, Michaud O, Xenarios I, Fankhauser C. Differentially Phased Leaf Growth 716
30 Plant Cell. 2014;26:3911–21.
718
44. Dornbusch T, Lorrain Ś, Kuznetsov D, Fortier A, Liechti R, Xenarios I, et al. Measuring 719
the diurnal pattern of leaf hyponasty and growth in Arabidopsis a novel phenotyping 720
approach using laser scanning. Funct Plant Biol. 2012;39:860–9. 721
45. Paulus S, Eichert T, Goldbach HE, Kuhlmann H. Limits of active laser triangulation as an 722
instrument for high precision plant imaging. Sensors (Switzerland). 2014;14:2489–509. 723
46. Herrero-Huerta M, Lindenbergh R, Gard W. Leaf Movements of Indoor Plants Monitored 724
by Terrestrial LiDAR. Front Plant Sci. 2018;9:189. 725
47. Thapa S, Zhu F, Walia H, Yu H, Ge Y. A novel LiDAR-Based instrument for high-726
throughput, 3D measurement of morphological traits in maize and sorghum. Sensors 727
(Switzerland). 2018;18:1–14. 728
48. Woodham RJ. Photometric Method For Determining Surface Orientation From Multiple 729
Images. Opt Eng. 1980;19:139–44. 730
49. Smith LN, Zhang W, Hansen MF, Hales IJ, Smith ML. Innovative 3D and 2D machine 731
vision methods for analysis of plants and crops in the field. Comput Ind. 2018;97:122–31. 732
50. Zhang W, Hansen MF, Smith M, Smith L, Grieve B. Photometric stereo for three-733
dimensional leaf venation extraction. Comput Ind. 2018;98:56–67. 734
51. Singh A, Ganapathysubramanian B, Singh AK, Sarkar S. Machine Learning for High-735
Throughput Stress Phenotyping in Plants. Trends Plant Sci. 2016;21:110–24. 736
52. Pound MP, Atkinson JA, Townsend AJ, Wilson MH, Griffiths M, Jackson AS, et al. 737
Deep machine learning provides state-of-the-art performance in image-based plant 738
phenotyping. Gigascience. 2017;6:1–10. 739
53. Gonzalez N, Beemster GT, Inzé D. David and Goliath: what can the tiny weed 740
Arabidopsis teach us to improve biomass production in crops? Curr Opin Plant Biol. 741
31 54. De Vylder J, Vandenbussche F, Hu Y, Philips W, Van Der Straeten D. Rosette Tracker: 743
An Open Source Image Analysis Tool for Automatic Quantification of Genotype Effects. 744
Plant Physiol. 2012;160:1149–59. 745
55. Zhou J, Applegate C, Alonso AD, Reynolds D, Orford S, Mackiewicz M, et al. Leaf-GP: 746
An open and automated software application for measuring growth phenotypes for 747
arabidopsis and wheat. Plant Methods. 2017;13:1–17. 748
56. Tomé F, Jansseune K, Saey B, Grundy J, Vandenbroucke K, Hannah MA, et al. rosettr: 749
protocol and software for seedling area and growth analysis. Plant Methods. 2017;13:1–10. 750
57. Aich S, Stavness I. Leaf counting with deep convolutional and deconvolutional networks. 751
Proc - 2017 IEEE Int Conf Comput Vis Work ICCVW 2017. 2017;22–9. 752
58. Ren M, Zemel RS. End-to-End Instance Segmentation with Recurrent Attention. IEEE 753
Conf Comput Vis Pattern Recognit. 2016. p. 21–6. 754
59. Ubbens J, Cieslak M, Prusinkiewicz P, Stavness I. The use of plant models in deep 755
learning: An application to leaf counting in rosette plants. Plant Methods. 2018;14:1–10. 756
60. Yang H, Shao L, Zheng F, Wang L, Song Z. Recent advances and trends in visual 757
tracking: A review. Neurocomputing. 2011;74:3823–31. 758
61. Smeulders AWM, Chu DM, Cucchiara R, Calderara S, Dehghan A, Shah M. Visual 759
tracking: An experimental survey. IEEE Trans Pattern Anal Mach Intell. 2014;36:1442–68. 760
62. Azhar F, Emrith K, Pollard S, Smith M, Adams G, Simske S. Testing the Validity of 761
Lamberts Law for Micro-scale Photometric Stereo Applied to Paper Substrates. 2015;246–53. 762
63. Otsu N. A threshold selection method from gray-level histograms. IEEE Trans Syst Man 763
Cybern. 1979;9:62–6. 764
64. Jacquemoud S, Baret F. PROSPECT: A model of leaf optical properties spectra. Remote 765
Sens Environ. 1990;34:75–91. 766
32 estimate light absorption? Ecol Modell. 2006;198:219–28.
768
66. Karidas P, Challa KR, Nath U. The tarani mutation alters surface curvature in 769
Arabidopsis leaves by perturbing the patterns of surface expansion and cell division. J Exp 770
Bot. 2015;66:2107–22. 771
67. Sandalio LM, Rodríguez-Serrano M, Romero-Puertas MC. Leaf epinasty and auxin: A 772
biochemical and molecular overview. Plant Sci. 2016;253:187–93. 773
68. Edwards KD, Millar AJ. Analysis of circadian leaf movement rhythms in Arabidopsis 774
thaliana. Methods Mol Biol. 2007;362:103–13. 775
69. Mizoguchi T, Wheatley K, Hanzawa Y, Wright L, Mizoguchi M, Song H, et al. LHY and 776
CCA1 Are Partially Redundant Genes Required to Maintain Circadian Rhythms in 777
Arabidopsis. Dev Cell. 2002;2:629–41. 778
70. Doyle MR, Davis SJ, Bastow RM, McWatters HG, Kozma-Bognár L, Nagy F, et al. The 779
ELF4 gene controls circadian rhythms and flowering time in Arabidopsis thaliana. Nature. 780
2002;419:74–7. 781
71. Yoo SK, Hong SM, Lee JS, Ahn JH. A genetic screen for leaf movement mutants 782
identifies a potential role for AGAMOUS-LIKE 6 (AGL6) in circadian-clock control. Mol 783
Cells. 2011;31:281–7. 784
72. Jansen M, Gilmer F, Biskup B, Nagel KA, Rascher U, Fischbach A, et al. Simultaneous 785
phenotyping of leaf growth and chlorophyll fluorescence via GROWSCREENFLUORO 786
allows detection of stress tolerance in Simultaneous phenotyping of leaf growth and 787
chlorophyll fl uorescence via GROWSCREEN FLUORO allows detection of stress tolera. 788
Funct Plant Biol. 2009;36:902–14. 789
73. De Vylder J, Vandenbussche F, Hu Y, Philips W, Van Der Straeten D. Rosette Tracker: 790
An Open Source Image Analysis Tool for Automatic Quantification of Genotype Effects. 791
33 74. Casal JJ. Shade Avoidance [Internet]. Arab. Book/American Soc. Plant Biol. 2012. 793
75. Pierik R, De Wit M. Shade avoidance: Phytochrome signalling and other aboveground 794
neighbour detection cues. J Exp Bot. 2014;65:2815–24. 795
76. Gommers CMM, Keuskamp DH, Buti S, van Veen H, Koevoets IT, Reinen E, et al. 796
Molecular Profiles of Contrasting Shade Response Strategies in Wild Plants: Differential 797
Control of Immunity and Shoot Elongation. Plant Cell. 2017;29:331–44. 798
77. Quint M, Delker C, Franklin KA, Wigge PA, Halliday KJ, Van Zanten M. Molecular and 799
genetic control of plant thermomorphogenesis. Nat Plants. 2016;2:1–9. 800
78. de Wit M, Ljung K, Fankhauser C. Contrasting growth responses in lamina and petiole 801
during neighbor detection depend on differential auxin responsiveness rather than different 802
auxin levels. New Phytol. 2015;208:198–209. 803
79. Vile D, Pervent M, Belluau M, Vasseur F, Bresson J, Muller B, et al. Arabidopsis growth 804
under prolonged high temperature and water deficit: Independent or interactive effects? Plant, 805
Cell Environ. 2012;35:702–18. 806
80. Crawford AJ, McLachlan DH, Hetherington AM, Franklin KA. High temperature 807
exposure increases plant cooling capacity. Curr Biol. 2012;22:R396–7. 808
81. Berry J, Bjorkman O. Photosynthetic Response and Adaptation to Temperature in Higher 809
Plants. Annu Rev Plant Physiol. 1980;31:491–543. 810
82. Bunce JA. Acclimation of photosynthesis to temperature in eight cool and warm climate 811
herbaceous C3species: Temperature dependence of parameters of a biochemical 812
photosynthesis model. Photosynth Res. 2000;63:59–67. 813
83. Yamori W, von Caemmerer S. Effect of Rubisco Activase Deficiency on the Temperature 814
Response of CO2 Assimilation Rate and Rubisco Activation State: Insights from Transgenic 815
Tobacco with Reduced Amounts of Rubisco Activase. Plant Physiol. 2009;151:2073–82. 816
34 patterns of Arabidopsis thaliana and evidence for sugar control of the diel leaf growth cycle. 818
New Phytol. 2007;174:752–61. 819
85. Smith AM, Stitt M. Coordination of carbon supply and plant growth. Plant, Cell Environ. 820
2007;30:1126–49. 821
86. Pyl E-T, Piques M, Ivakov A, Schulze W, Ishihara H, Stitt M, et al. Metabolism and 822
Growth in Arabidopsis Depend on the Daytime Temperature but Are Temperature-823
Compensated against Cool Nights. Plant Cell. 2012;24:2443–69. 824
87. McClung CR. Plant Circadian Rhythms. Plant Cell Online. 2006;18:792–803. 825
88. Zielinski T, Moore AM, Troup E, Halliday KJ, Millar AJ. Strengths and limitations of 826
period estimation methods for circadian data. PLoS One. 2014;9:1–26. 827
89. He K, Gkioxari G, Dollar P, Girshick R. Mask R-CNN. 2017 IEEE Int Conf Comput Vis. 828
2017. p. 2980–8. 829
90. Lin TY, Maire M, Belongie S, Hays J, Perona P, Ramanan D, et al. Microsoft COCO: 830
Common objects in context. Lect Notes Comput Sci (including Subser Lect Notes Artif Intell 831
Lect Notes Bioinformatics). 2014;740–55. 832
91. Scharr H, Minervini M, French AP, Klukas C, Kramer DM, Liu X, et al. Leaf 833
segmentation in plant phenotyping: a collation study. Mach Vis Appl. 2016;27:585–606. 834
92. Henriques JF, Caseiro R, Martins P, Batista J. High-speed tracking with kernelized 835
correlation filters. IEEE Trans Pattern Anal Mach Intell. 2015;37:583–96. 836
93. Lucas BD, Kanade T. An Iterative Image Registration Technique with an Application to 837
Stereo Vision. Imaging Underst Work. 1981. p. 121–30. 838
94. Babenko B, Yang M-H, Belongie S. Visual Tracking with Online Multiple Instance 839
Learning. Comput Vis Pattern Recognit. 2009;983–90. 840
95. Allan D, Caswell T, Keim N, van der Wel C. trackpy: Trackpy v0.3.2 [Internet]. Zenodo. 841
35 96. Bours R, Muthuraman M, Bouwmeester H, van der Krol A. OSCILLATOR: A system for 843
analysis of diurnal leaf growth using infrared photography combined with wavelet 844
transformation. Plant Methods. 2012;8:1–12. 845
97. van Zanten M, Voesenek LACJ, Peeters AJM, Millenaar FF. Hormone- and Light-846
Mediated Regulation of Heat-Induced Differential Petiole Growth in Arabidopsis. Plant 847
Physiol. 2009;151:1446–58. 848
98. Kozuka T, Horiguchi G, Kim GT, Ohgishi M, Sakai T, Tsukaya H. The different growth 849
responses of the Arabidopsis thaliana leaf blade and the petiole during shade avoidance are 850
regulated by photoreceptors and sugar. Plant Cell Physiol. 2005;46:213–23. 851
99. Coppens F, Wuyts N, Inzé D, Dhondt S. Unlocking the potential of plant phenotyping 852
data through integration and data-driven approaches. Curr Opin Syst Biol. 2017;4:58–63. 853
100. Araus JL, Kefauver SC, Zaman-Allah M, Olsen MS, Cairns JE. Translating High-854
Throughput Phenotyping into Genetic Gain. Trends Plant Sci. 2018;23:451–66. 855
101. Valmadre J, Bertinetto L, Henriques JF, Vedaldi A, Torr PHS. End-to-end 856
representation learning for Correlation Filter based tracking. 2017 IEEE Conf Comput Vis 857
Pattern Recognit. 2017. p. 5000–8. 858
102. Li L, Zhang Q, Huang D. A review of imaging techniques for plant phenotyping. 859
Sensors. 2014;14:20078–111. 860
861
FIGURE LEGENDS 862
Figure 1.Capturing dynamic plant growth traits using photometric stereo imaging. (A) 863
PS comprises a circular arrangement of NIR LEDs with a central camera positioned above the 864
plant(s). Red-dashed lines show the direction of light vectors. (B, C) Assembled PS-Plant 865