warwick.ac.uk/lib-publications
Original citation:Roy, D. and Sanchez Silva, Victor (2017) Graph-based transforms based on prediction inaccuracy modeling for pathology image coding. In: 2018 Data Compression Conference, Utah, USA, 27-30 Mar 2018
Permanent WRAP URL:
http://wrap.warwick.ac.uk/102749
Copyright and reuse:
The Warwick Research Archive Portal (WRAP) makes this work by researchers of the University of Warwick available open access under the following conditions. Copyright © and all moral rights to the version of the paper presented here belong to the individual author(s) and/or other copyright owners. To the extent reasonable and practicable the material made available in WRAP has been checked for eligibility before being made available.
Copies of full items can be used for personal research or study, educational, or not-for profit purposes without prior permission or charge. Provided that the authors, title and full bibliographic details are credited, a hyperlink and/or URL is given for the original metadata page and the content is not changed in any way.
Publisher’s statement:
© 2017 IEEE. Personal use of this material is permitted. Permission from IEEE must be obtained for all other uses, in any current or future media, including reprinting
/republishing this material for advertising or promotional purposes, creating new collective works, for resale or redistribution to servers or lists, or reuse of any copyrighted component of this work in other works.
A note on versions:
The version presented here may differ from the published version or, version of record, if you wish to cite this item you are advised to consult the publisher’s version. Please see the ‘permanent WRAP url’ above for details on accessing the published version and note that access may require a subscription.
Graph-Based Transforms based on Prediction
Inaccuracy Modeling for Pathology Image Coding
Debaleena Roy and Victor Sanchez
University of Warwick, Coventry, UK
Abstract: Digital pathology images are multi giga-pixel color images that usually require large amounts of bandwidth to be transmitted and stored. Lossy compression using intra-prediction offers an attractive solution to reduce the storage and transmission requirements of these images. In this paper, we evaluate the performance of the Graph-based Transform (GBT) within the context of block-Graph-based predictive transform coding. To this end, we introduce a novel framework that eliminates the need to signal graph information to the decoder to recover the coefficients. This is accomplished by computing the GBT using predicted residual blocks, which are predicted by a modeling approach that employs only the reference samples and information about the prediction mode. Evaluation results on several pathology images, in terms of the energy preserved and MSE when a small percentage of the largest coefficients are used for reconstruction, show that the GBT can outperform the DST and DCT.
1. Introduction
Thanks to the introduction of high-throughput slide scanners, microscope glass slides can now be digitized to produce color images, which are called whole-slide images (WSIs). This has fueled the emerging area of digital pathology imaging and resulted in novel ways to share medical imaging data and collaborate remotely [1-2]. WSIs are multi giga-pixel color images that usually require large amounts of bandwidth to be transmitted and stored. Compression is therefore an attractive solution for data access and transmission of these images [3-7]. Recent proposals in this area include lossless compression methods based on the intra-prediction mode of the High Efficiency Video Coding (HEVC) standard [4,8], and lossy methods based on the JPEG2000 standard [7,9]. Although lossless compression guarantees perfect reconstruction of the image, it fails to attain high compression ratios. Lossy compression is then more advisable, especially since it has been shown that compression ratios of up to 60:1 can be used on WSIs without negatively affecting the diagnosis process [7].
The Graph-Based Transform (GBT) has been recently shown to attain promising results for data de-correlation and energy compaction. This comes as an intrinsic consequence of the underlying graph structure, which can accurately reflect the correlation among pixels [10]. In general, there two variants of GBTs. The first one is constructed based on the specific graph representing the signal to be transformed. This variant accurately reflects the characteristics of the signal, but may require signaling additional information so the decoder can reconstruct the graph [11]. The second variant consists in using separable transforms that can be applied to rows and columns of a matrix of signal values (i.e., a pixel block) [12]. This may require understanding the characteristics of the data from training data, but requires no additional information to be signaled to the decoder. Although several works may be found in the literature on the performance of the GBT for residual data of camera-captured imagery generated by block-based predictive transform coding (PTC) methods, such as the inter- and intra-coding modes of HEVC, no work is available on the suitability of the GBT for compression of WSIs. This paper then focuses on the first variant of GBTs and its performance for data de-correlation and energy compaction of WSIs, within the context of block-based PTC using intra-prediction. Specifically, we introduce a new framework that eliminates the need to signal additional information to the decoder. This is achieved by computing the GBT based on a predicted residual signal, which is computed using only the reference samples used to predict a block. This framework is evaluated on a wide range of pathology images depicting different tissue types. Results are reported in terms of the energy compaction properties of the GBT and the Mean Squared Error (MSE) of the reconstructed images. The results are compared to those attained by the KLT, DCT, GBT when information is needed the be signaled to the decoder, and the Discrete Sine Transform (DST), as implemented in the intra-prediction mode of HEVC [13]. Evaluations show that the GBT attains better energy compaction properties than the DST and the DCT for the evaluated pathology images, with a very similar performance in terms of MSE.
The rest of the paper is organized as follows. Section 2 briefly introduces the variant of GBTs used in this work. In Section 3, we explain in detail the proposed framework. The experimental results are presented in Section 4. Section 5 draws conclusions and presents ideas for future work.
2. Graph-based Transform
Within the context of block-based PTC, the GBT is usually constructed by eigen-decomposition of the combinatorial Laplacian, L, of the undirected graph G = (V, E, A), representing the residual signal, s, of a block, where each node in the finite set V, i.e., vnÎV,
represents a sample location, E is the set of weighted edges connecting nodes, and A is a symmetric weighted adjacency matrix. If there is an edge e = (i, j) connecting pixel locations i and j, the entry Ai,j represents the weight of the edge; otherwise, Ai,j = 0, with
Ai,j = Aj,i. Large values in A usually represent a high similarity between the connected
nodes, according to a given criterion. Matrix L, also called the (un-normalized) graph Laplacian is computed as L = D – A, where the degree matrix, D, is a diagonal matrix whose ith diagonal element, di, is equal to the sum of the weights of all the edges incident
denote the eigen-system of L by 𝜆", 𝐯" , where 𝜆"/𝐯" is the ith eigenvalue/eigenvector
pair, and V is the set of eigenvectors. Analogous to the classical Fourier transform, one can define the GBT, 𝐬, of signal 𝐬 ∈ ℝ*, which resides on the nodes of G, as the expansion of
𝐬 in terms of the eigenvectors of L:
𝐬 𝜆" = 𝐬, 𝐯" = 234𝐕 01𝐬 𝑘 𝐯"(𝑘) = 𝐅𝐬, (1)
where F = V-1 is the graph Fourier transform and the set of eigenvalues of L, denoted by
𝜎 𝐋 = 𝜆4, 𝜆1, … , 𝜆*01 , is the entire corresponding spectrum. The original signal can be
reconstructed by the inverse GBT, which is given by 𝐬 = F-1𝐬 = V𝐬.
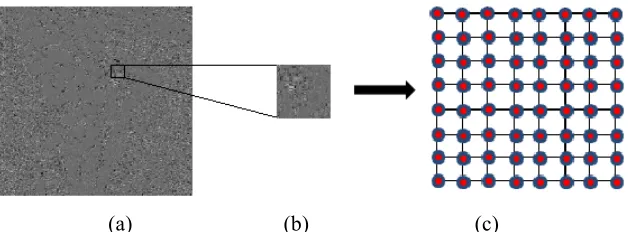
In this work, each N×N residual block is represented by a 4-connected graph (see Fig. 1), and the weight of the edge connecting nodes a and b is computed using a Gaussian kernel weighing function, as follows:
𝑊:,; = exp − @ABC D,E
F
GӨF if dist 𝑎, 𝑏 ≤ 𝑘
0 otherwise , (2)
where dist 𝑎, 𝑏 represents the Euclidian distance between the residual value associated with nodes a and b, Өis the kernel’s width, and k is a parameter.
3. Proposed Framework
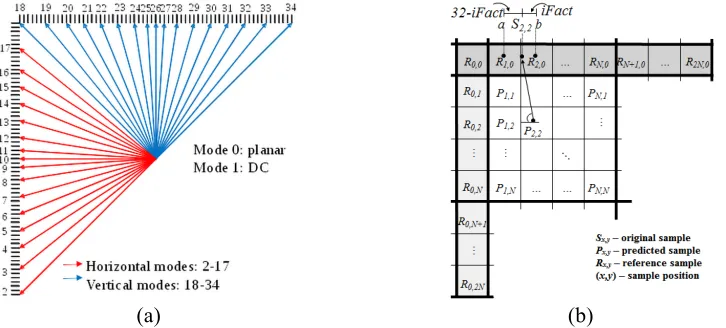
Our proposed framework assumes a block-based PTC method that employs the set of prediction modes currently used in the HEVC standard. This set comprises 33 angular prediction modes that model 33 different directional patterns; a DC mode and a PLANAR mode that generate smooth surfaces. Fig. 2(a) illustrates the prediction directions associated with the angular modes. The basic prediction principle for all angular modes is exemplified in Fig. 2(b).
Our framework is depicted in Fig. 3. At the encoder side, we employ a prediction inaccuracy modelling to predict the residual block for each N×N block by only using the prediction mode selected by the encoder and the references samples of the block [14]. Each predicted residual block is represented by a 4-connected weighted graph and the corresponding GBT is computed by eigen-decomposition, as detailed in Section 2. This GBT is then used to transform the actual residual block. Coefficients may then be quantized and subsequently entropy coded. At the decoder side, we re-compute the predicted residual block as done by the encoder. Note that this is possible without having to signal any
[image:4.612.150.464.71.187.2](a) (b) (c)
Fig. 1. (a) Residual signal generated by intra-prediction of the red (R) component of a pathology
additional information, as the reference samples and prediction mode of each block are readily available at the decoder. Based on the predicted residual block, the corresponding 4-connected weighted graph and GBT is computed, which allow us to compute the inverse GBT to be applied to the decoded coefficients (after entropy decoding) and obtain the reconstructed residual block. Finally, the predicted block and re-constructed residual block are added to obtain the reconstructed block.
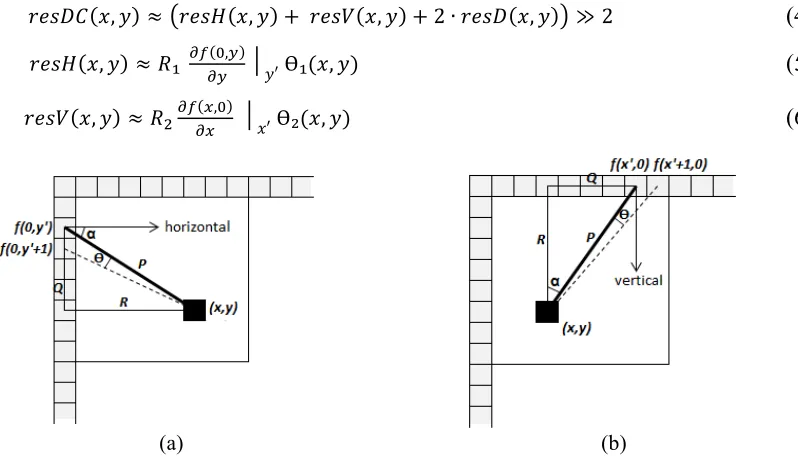
The prediction inaccuracy modeling for the residual blocks computed by employing any of the 33 angular modes depicted in Fig 2 is based on the work by X. Cai et. al in [15]. This modeling approach predicts a residual block using the reference samples to the left and above the block, and the information about the angular mode used by the encoder. The approach is based on the argument that residual blocks computed after angular intra-prediction can be approximated by using the gradient of reference samples and the distance between the position of the reference samples used and the position of the value to be approximated within a block. For horizontal modes, i.e., modes 2-17 in Fig. 2(a), the predicted residual signal, at position (𝑥, 𝑦) within an N×N block is approximated as follows:
𝑟𝑒𝑠 𝑥, 𝑦 ≈]^_`\ ab 4,cac │ce Ө 𝑥, 𝑦 , (3)
where Ө 𝑥, 𝑦 is the angle between two consecutive reference samples to the left and depends on the position being predicted, ab 4,cac denotes a partial derivative with respect to the reference samples to the left, P is the distance between the reference sample 𝑓 0, 𝑦′ and the position to be predicted, which is calculated as P2 = R2 + Q2; and α is the angle between P and the horizontal. Fig. 4(a) graphically represents the variables used in Eq. 3. For the vertical modes, e.g., modes 18-34 in Fig. 2(a), the same calculations can be applied by appropriately rotating the block, as depicted in Fig. 4(b).
(a) (b)
Fig. 2. (a) Intra prediction modes in HEVC. (b) Example of the prediction principle using
interpolation at 1/32-pixel accuracy. iFact is the distance between sample Sx,y and reference sample
b. Reference samples are: {R0,1, R0,2,…, R0,2N} – located to the left of the current block, and {R0,0,
[image:5.612.124.487.77.241.2]For the DC and PLANAR modes, we propose an extension to the model proposed in [15]. In the case of the DC mode, we note that residual values tend to increase in the horizontal, vertical and diagonal direction proportionally to the distance from the reference samples, since the predicted value is computed as the average of all reference samples located above and to the left of the block. This is based on the observation that samples in the first row and first column of the block are expected to have a more similar value to that of the reference samples than those samples located far from them. Our proposed modeling approach is based on this observation. Specifically, for the DC mode we propose to average the prediction for the pure horizontal mode (10), pure vertical mode (26), and diagonal mode (18), as follows:
𝑟𝑒𝑠𝐷𝐶 𝑥, 𝑦 ≈ 𝑟𝑒𝑠𝐻 𝑥, 𝑦 + 𝑟𝑒𝑠𝑉 𝑥, 𝑦 + 2 ∙ 𝑟𝑒𝑠𝐷 𝑥, 𝑦 ≫ 2 (4)
𝑟𝑒𝑠𝐻 𝑥, 𝑦 ≈ 𝑅₁ ab 4,cac │𝑦′ Ө₁(𝑥, 𝑦) (5)
𝑟𝑒𝑠𝑉 𝑥, 𝑦 ≈ 𝑅Gab r,4
ar │𝑥′ Ө₂(𝑥, 𝑦) (6)
[image:6.612.98.514.72.291.2](a) (b)
Fig. 4. Prediction inaccuracy modeling for the (a) horizontal and (b) vertical angular modes.
[image:6.612.115.514.468.696.2](a) (b)
𝑟𝑒𝑠𝐷 𝑥, 𝑦 ≈ \ ]^_ tu
ab 4,c
ac │𝑦′ Ө₃ 𝑥, 𝑦 (7)
where 𝑟𝑒𝑠𝐻 𝑥, 𝑦 , 𝑟𝑒𝑠𝑉 𝑥, 𝑦 , 𝑟𝑒𝑠𝐷 𝑥, 𝑦 are the predicted residual values in the horizontal, vertical and diagonal directions, respectively, >> represents a bit shift to the right, 𝑅₁ and
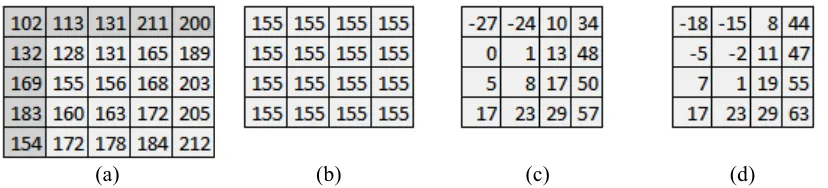
𝑅₂ are the distances between the predicted position and the references samples to the left and above, respectively. Note that the modeling approach in Eq. 7 is just a case of Eq. 3 when α = π/4. The modeling approach for the DC mode is depicted in Fig. 5(a) and exemplified in Fig. 6 by using an example 4×4 block, where the average of all reference samples is 155. From Fig. 6, it can be observed that the residual signal indeed tends to increase for samples located far from the reference samples. Our prediction inaccuracy modelling effectively approximates the residual based on this observation.
In the case of the PLANAR mode, we follow a similar approach to the one followed for the DC mode [see Fig. 5(b)]. Specifically, we propose to average the prediction for the pure horizontal mode (10) and pure vertical mode (26), as follows:
𝑟𝑒𝑠𝑃𝑙𝑎𝑛𝑎𝑟 𝑥, 𝑦 ≈ 𝑟𝑒𝑠𝐻 𝑥, 𝑦 + 𝑟𝑒𝑠𝑉 𝑥, 𝑦 ≫ 1. (8)
Fig. 7 depicts the G component of a sample pathology image and the corresponding predicted signal after intra-prediction using the DC and PLANAR modes. Fig. 7 also depicts the corresponding residual signal and predicted residual signal obtained by the proposed prediction inaccuracy modeling for the DC and PLANAR modes.
(a) (b)
Fig. 5. (a) Model for the DC mode and (b) the Planar mode
(a) (b) (c) (d)
[image:7.612.112.502.73.230.2] [image:7.612.99.513.583.677.2]4. Performance Evaluation
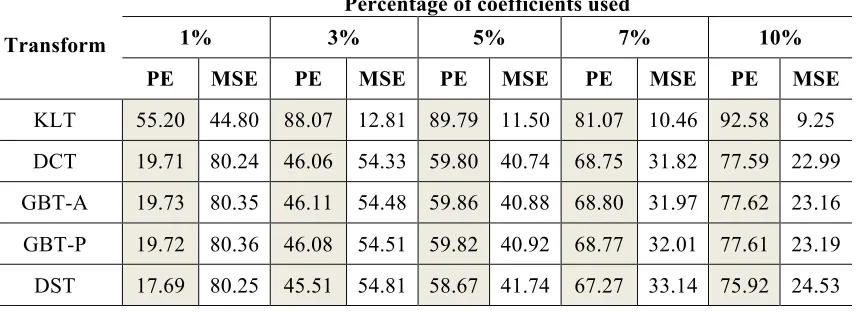
The proposed framework is tested on ten 1024×1024 sections of WSIs depicting lymphatic, pancreatic, colon and brain tissue. The images are obtained from the Center for Biomedical Informatics and Information Technology of the US National Cancer Institute [16]. We employ intra-prediction using all 35 modes depicted in Fig. 2, with a block size of 8×8 on the G component. We compare the performance of the GBT using our framework P) against the GBT when the graphs are computed using the actual residual blocks (GBT-A), the DCT and the DST, as implemented in HEVC. The performance of all transforms is measured in terms of the energy preserved by reconstructing the image using a sub-set of the largest coefficients and the corresponding MSE. In other words, we evaluate the energy compaction properties of the transforms and the quality of the reconstructed images. The coefficients are selected by setting a threshold that indicates the minimum absolute value that the coefficients in the sub-set must have. A large threshold allows to include the largest coefficients in the sub-set, while a threshold close to zero results in including most of the coefficients in the sub-set. By gradually decreasing an initial large threshold, this approach gradually includes in the sub-set the largest coefficients. Note that this approach differs from one that selects the DC and low frequency AC coefficients first, and gradually include the high frequency AC coefficients. The approach used in this work allows selecting the largest coefficients, regardless of their frequency type. This is advantageous for pathology images, as they usually depict strong edges and non-smooth regions, resulting in several AC coefficients with large values. Our evaluations also include the KLT, as the baseline transform. Table 1 tabulates the average energy preserved, in percentage, by the transforms and the corresponding average MSE values, for all evaluated images, using a small percentage of coefficients, ranging from 1% to 10%.
[image:8.612.92.520.71.152.2](a) (b) (c) (d)
Fig. 7. (a) The G component of a sample pathology image (colon tissue) and the (b) predicted, (c) residual, and (d) predicted residual signals. Only the DC and Planar modes are used for prediction.
Table 1. Average preserved energy (PE - %) and MSE using a small percentage of coefficients.
Transform
Percentage of coefficients used
1% 3% 5% 7% 10%
PE MSE PE MSE PE MSE PE MSE PE MSE
KLT 55.20 44.80 88.07 12.81 89.79 11.50 81.07 10.46 92.58 9.25
DCT 19.71 80.24 46.06 54.33 59.80 40.74 68.75 31.82 77.59 22.99
GBT-A 19.73 80.35 46.11 54.48 59.86 40.88 68.80 31.97 77.62 23.16
GBT-P 19.72 80.36 46.08 54.51 59.82 40.92 68.77 32.01 77.61 23.19
[image:8.612.96.524.567.723.2]
(a) (b)
(c) (d)
(e) (f)
[image:9.612.102.531.72.649.2](g) (h)
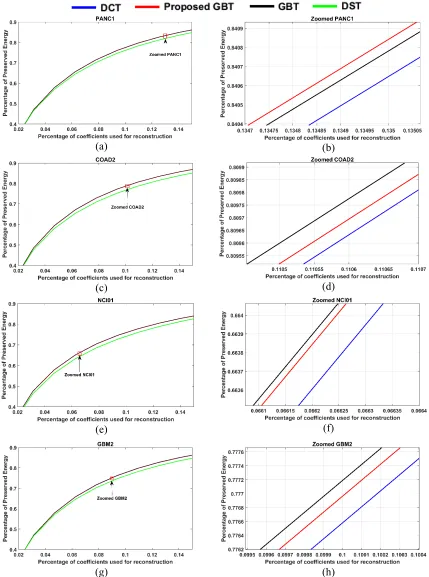
As expected, the KLT provides the best performance. Note that the GBT-A outperforms the GBT-P. This is also expected as the GBT-A is constructed based on the graphs of the actual residual signals. However, it is important to recall that the GBT-A requires signaling information about the graphs to the decoder. The GBT-P outperforms the DST in terms of preserved energy, which is used in HEVC for intra-predicted residuals. For example, on average, 11.47% more energy can be preserved by the GBT-P than the DST by using only 1.0% of the coefficients. In terms of MSE values, the GBT-P attains lower values than the DST for most of the cases tabulated in Table 1. Note that the GBT-P slightly outperforms the DCT in terms of preserved energy, for all percentages of coefficients tabulated in Table 1. However, the corresponding average MSE values are slightly higher than those attained by DCT. Fig. 8 plots the percentage of preserved energy vs. the percentage of coefficients used for four different images. The improvements of the GBT-P over the DST and the DCT can be visually appreciated in these plots.
5. Conclusions and Future Work
WSIs are multigiga-pixel color images that usually require large amounts of bandwidth to be transmitted and stored. To facilitate the widespread of these images in clinical settings, compression is needed to reduce storage and bandwidth requirements. Block-based PTC using intra-prediction has been shown to be capable of efficiently compress these images. In this paper, we presented a framework that allows employing the GBT to transform intra-predicted residual signals of these images without the need to signal information about the graphs to the decoder. The framework is based on computing the necessary graphs using predicted residual blocks, which can be re-computed at the decoder using only the reference samples and information about the prediction mode used. We evaluated the performance of the GBT computed in this fashion in terms of the energy preserved and MSE when a small percentage of the largest coefficients are used for reconstruction of several pathology images. Evaluation results show that the GBT can outperform the DST, while slightly outperforming the DCT, in terms of energy preserved, for the evaluated images.
Our future work includes determining the effect of graph construction on the energy compaction properties of the GBT. The connectivity pattern representing the correlation among residual samples is an important factor that may influence the properties of the GBT, and correlations between reference samples and those to be predicted should be also considered. Our future work also includes improving the prediction inaccuracy modeling to more accurately predict residual blocks.
References
[1] A. Madabhushi, “Digital pathology image analysis: Opportunities and challenges (editorial),”
Imag. Med., vol. 1, no. 1, pp. 7-10, 2009.
[2] M. May, “A better lense on disease,” Scientific American, vol. 302, pp. 74-77, 2012.
[3] V. Sanchez, M. Hernandez-Cabronero, F. Aulí-Llinàs, and J. Serra-Sagrista, “Fast lossless
[4] V. Sanchez, F. Aulí-Llinàs, J. Bartrina-Rapesta and J. Serra-Sagristà, “HEVC-based lossless
compression of whole slide pathology images,” in Proc. IEEE Global Conf. on Signal and
Information Processing (GlobalSIP), Atlanta, GA, 2014, pp. 297-301.
[5] V. Sanchez, F. Aulí-Llinàs, R. Vanam and J. Bartrina-Rapesta, “Rate control for lossless region
of interest coding in HEVC intra-coding with applications to digital pathology images,” in Proc. IEEE International Conference on Acoustics, Speech and Signal Processing (ICASSP), South Brisbane, QLD, 2015, pp. 1250-1254.
[6] M. Hernández-Cabronero, V. Sanchez, F. Aulí-Llinàs and J. Serra-Sagristà, “Fast MCT
optimization for the compression of whole-slide images,” in Proc. IEEE International
Conference on Image Processing (ICIP), Phoenix, AZ, 2016, pp. 2370-2374.
[7] M. Hernández-Cabronero, F. Aulí-Llinàs, V. Sanchez and J. Serra-Sagristà, “Transform
Optimization for the Lossy Coding of Pathology Whole-Slide Images,” in Proc. 2016 Data Compression Conference (DCC), Snowbird, UT, 2016, pp. 131-140.
[8] J. Lainema, F. Bossen, W.-J. Han, J. Min, and K. Ugur, “Intra coding of the HEVC standard,”
IEEE Trans. Circuits Syst. Video Technol., vol. 22, no. 12, pp. 1792–1801, Dec. 2012.
[9] A. Skodras, C. Christopoulos and T. Ebrahimi, “The JPEG2000 still image compression
standard,” in IEEE Signal Proc. Magazine, vol. 18, no. 5, pp. 36-58, Sept. 2001.
[10] D. I. Shuman, S. K. Narang, P. Frossard, A. Ortega and P. Vandergheynst, “The emerging field
of signal processing on graphs: Extending high-dimensional data analysis to networks and other irregular domains,” in IEEE Signal Processing Magazine, vol. 30, no. 3, pp. 83-98, May 2013.
[11] H. E. Egilmez, A. Said, Y. H. Chao, and A. Ortega, “Graph-based transforms for inter predicted
video coding,” in Proc. IEEE International Conference on Image Processing (ICIP), 2015, pp. 3992–3996.
[12] H. E. Egilmez, Y. H. Chao, A. Ortega, B. Lee, and S. Yea, “GBST: Separable transforms based
on line graphs for predictive video coding,” in Proc. 2016 IEEE International Conference on Image Processing (ICIP), Sept. 2016, pp. 2375–2379.
[13] A. Saxena and F. C. Fernandes, “DCT/DST-based transform coding for intra prediction in
image/video coding,” IEEE Trans. Image Process., vol. 22, no. 10, pp. 3974–3981, Oct. 2013.
[14] G.J. Sullivan, J.R. Ohm, W.J. Han and T. Wiegand, “Overview of the High Efficiency Video
Coding (HEVC) standard,” IEEE Transactions on Circuits and Systems for Video Technology, vol. 22, no. 12, pp. 1649-1668, Dec. 2012.
[15] X. Cai and J. S. Lim, “Transforms for Intra Prediction Residuals Based on Prediction
Inaccuracy Modeling,” IEEE Transactions on Image Processing, vol. 24, no. 12, Dec. 2015.
[16] The Cancer Genome Atlas, National Cancer Institute, National Institute of Health. Available