Philip Johannes Cornelis Nel
Thesis presented in partial fulfilment of the requirements for
the degree of Master of Engineering (Electrical) in the
Faculty of Engineering at Stellenbosch University
Department of Electrical and Electronic Engineering, University of Stellenbosch,
Private Bag X1, Matieland 7602, South Africa.
Supervisors:
Dr. M.J. Booysen Prof. A.B van der Merwe
Declaration
By submitting this thesis electronically, I declare that the entirety of the work contained therein is my own, original work, that I am the sole author thereof (save to the extent explicitly otherwise stated), that reproduction and publication thereof by Stellenbosch University will not infringe any third party rights and that I have not previously in its entirety or in part submitted it for obtaining any qualification.
2015/09/30
Date: . . . .
Copyright © 2015 Stellenbosch University All rights reserved.
Abstract
South Africa is, at the time of writing, in the midst of an energy crisis as the national utility is unable to meet the nation’s energy demands. Electrical water heaters (EWHs) remain one of the main contributors to residential energy consumption in South Africa and other countries where they are used. Although educational material has been published to create awareness of energy saving actions for EWHs, it is unclear if users understand the content and efficiently control their EWHs. Additionally, insufficient feedback of usage data makes it difficult for consumers to understand their consumption patterns and make informed decisions regarding their future water and electricity use. This work presents a mobile based eco-feedback system for the energy and water consumption data of residential EWHs. The system consists of several components: an EWH model; an event detection algorithm; and an Android mobile application.
The physics based EWH model was developed in order to accurately simulate the energy input and output of an EWH for various control settings, usage profiles and orien-tations (i.e. vertical and horizontal). The accuracy of the model is validated against six datasets, four comprising 900 hours with multiple usage events and two with only stand-ing losses. The results show that measured energy usage is modelled with an estimation error of less than 2% and 7% for schedule control and thermostat control respectively. As well as being accurate, the presented model has a low computational complexity, taking only 100 milliseconds to complete a 10 day simulation on a standard desktop machine, making it ideal for use in mobile devices.
A novel and non-invasive hardware solution and matching algorithm were developed to support the identification and classification of warm water usage events without the use of invasive and expensive water metering technologies. The algorithm was tested using 49 days of data which included 127 usage events and was found to accurately detect usage events with an accuracy of 91%. Additionally, the algorithm was able to detect very small usage events (0.5 litres was detected successfully). However, the estimated duration of events is within 2 minutes accurate 79% of the time. Additionally, the outlet temperature and water meter data were used as inputs to the EWH model for estimating the energy consumption under various control settings. The outlet temperature data was used to estimate both the total volume of warm water consumed and the energy input for the EWH with an error of less than 10% for 3 of the 4 datasets considered.
An Android mobile application was then created to allow consumers to remotely mon-itor and control their EWH from their mobile device. The EWH model was implemented as part of the functionality of the mobile application to provide a user with instantaneous feedback on the impact of changes in control settings and usage profiles. For example, this functionality in the mobile application allows users to determine how switching their EWH off intermittently will affect their energy consumption. Additionally, the event de-tection algorithm was utilised by the mobile application to establish usage profiles and provide recommended schedules for users, based on their consumption data. Finally, a
usability study was conducted in order to evaluate the ease with which users are able to utilise the mobile application and to improve on any areas of difficulty that may exist. Several areas of difficulty were determined and these results were used to implement var-ious changes to improve the application by making it more user friendly. The results of the study indicate that the system is user friendly and that participants had a positive overall experience with the mobile application.
Uittreksel
Suid-Afrika is, tydens finalisering van hierdie manuskrip, in die middel van ’n energiekri-sis, aangesien die nasionale voorsiening nie in staat is om aan die energie behoeftes van die land te voldoen nie. Elektriese warmwatersilinders (EWs) bly een van die groot-ste bydraers tot residensiële energieverbruik in Suid-Afrika asook ander lande waar dit gebruik word. Alhoewel opvoedkundige materiaal al gepubliseer is om bewustheid van energiebesparende maatreels vir EWs te skep, is dit onduidelik of gebruikers die inhoud verstaan en hul EWs effektief beheer. Onvoldoende terugvoer van die gebruiksinligting maak dit ook moeilik vir verbruikers om hul verbruikspatrone te verstaan en ingeligte besluite te neem oor hul toekoemstige water en elektrisiteit verbruik. Hierdie werkstuk bied ’n selfoon-gebaseerde eko-terugvoerstelsel aan vir die energie en water verbruik data van residensiële EWs. Die stelsel bestaan uit verskeie komponente: ’n termiese EW model; ’n gebeurteniswaarnemingsalgoritme; en ’n Android mobiele toepassing.
Die fisika gebaseerde EW model is ontwikkel om die energie toevoer en afvoer van ’n EW vir verskeie beheerverstellings, gebruiksprofiele en EW oriëntasies akkuraat te simuleer. Die akkuraatheid van die model is bevestig met ses datastelle, vier wat 900 ure van verskeie gebeurtenise behels, en twee met slegs staande verliese. Die resultate toon aan dat gemete energieverbruik lewer met ’n beraamde fout van minder as 2% en 7% vir skedule beheer en termostaat beheer onderskeidelik. Sowel as ‘n hoë akkuraatheid, het die model ’n lae berekenings-kompleksiteit en neem slegs 100 millisekondes om ’n 10 dag simulasie te voltooi op ’n standaard rekenaar, wat dit ideaal maak vir gebruik met mobiele toestelle.
’n Unieke en nie-indringende hardeware oplossing en ’n bypassende algoritme is twikkel wat die identifisering en klassifisering van warm water verbruiksgebeurtenise on-dersteun sonder die gebruik van versteurende installasies en duur watermeting tegnologie. Die algoritme is getoets met 49 dae se data wat 127 gebruiksgebeurtenisse behels, en dit was bevind dat die algoritme gebeurtenise akkuraat kan waarneem met ’n akkuraatheid van 91%. Verder het die algoritme klein gebruiksgebeurtenise waargeneem (0.5 liter is suksesvol waargeneem). Tog is die duurteskattings van gebeurtenise binne 2 minute akku-raat 79% van die tyd. Daarna is die uitlaattemperatuur en water meter data gebruik as insette tot die EW model vir die beraming van die energieverbruik onder verskillende beheerverstellings. Die uitlaattemperatuur was gebruik om die totale volume warm water verbruik en energie-inset te skat met ’n fout van minder as 10% vir 3 van die 4 datastelle wat beskou was.
’n Android mobiele toepassing is geskep om verbruikers afstand monitering en beheer van hul EW te gee deur ‘n mobiele toestel. Die EW model is as deel van die funksionaliteit van die mobiele toepassing geïmplementeer om ’n verbruiker van oombliklike terugvoer aangaande die impak van veranderinge in beheer verstellings en gebruiks profiele te voor-sien. Byvoorbeeld, verbruikers kan bepaal hoe die tussenpose afskakel van hul EWs hul energieverbruik beïnvloed. Die gebeurteniswaarnemingsalgoritme is daarbenewens deur
die mobiele toepassing gebruik om gebruiksprofiele te bepaal en skedules vir gebruikers aan te bevel op grond van hul verbruiks data. Ten slotte, is ’n bruikbaarheids studie uitegevoer om te bepaal hoe maklik gebruikers die gebruik van die mobiele toepassing vind om te gebruik om sodoende enige probleme wat mag bestaan te verbeter. Verskeie probleme is geidentifiseer en die resultate is aangewend om verskeie veranderinge aan te bring om die toepassing meer gebruikersvriendelikheid te maak. Die resultate van die studie dui daarop dat die stelsel wel gebruikersvriendelik is en dat in die geheel deelnemers se ervaring met die mobiele toepassing ’n positiewe een was.
Patents and Publications
The work in this manuscript has been published as follows:
• P.J.C. Nel, M.J. Booysen, B. van der Merwe, "ICT-enabled solutions for smart management of water supply in Africa", UMICTA, December 2014, Stellenbosch, South Africa.
• P.J.C. Nel, M.J. Booysen, B. van der Merwe, "Using thermal transients at the outlet of electrical water heaters to recognise consumption patterns for heating schedule optimisation", IFIP/IEEE NTMS , July 2015, Paris, France.
• Accepted for publication: P.J.C. Nel, M.J. Booysen, B. van der Merwe, "Electric water heater energy consumption determination using outlet temperature and vol-umetric estimation", IEEE CIASG, December 2015, Cape Town, South Africa. Additionally, the work in this manuscript has been submitted for publication as follows:
• P.J.C. Nel, M.J. Booysen, B. van der Merwe, "A computationally inexpensive energy model for horizontal electrical water heaters with scheduling" submitted to IEEE Transactions on Smart Grid, revise and resubmit.
• P.J.C. Nel, M.J. Booysen, B. van der Merwe, "Smart metering and ICT support for water supply and infrastructure management in Sub-Saharan Africa" submitted to Water SA.
Finally, the work in this manuscript has been patented as follows:
• P.J.C. Nel, M.J. Booysen, B. van der Merwe, "Geyser Event Detection", Provisional Patent Application No. 2015/03775, 27 May 2015.
• P.J.C. Nel, M.J. Booysen, B. van der Merwe, "A Water Heater Controller", Provi-sional Patent Application No. 2015/04029, 3 June 2015.
Acknowledgements
The completion of thesis would have been possible without the support and guidance of several people and organisations, to whom I would like to express my sincerest gratitude: • Dr. Thinus Booysen for being the best study leader that anyone could ever ask for. He has presented me with countless incredible opportunities during my postgraduate studies that have provided me with a masters experience that I will always remember fondly.
• Prof. Brink van der Merwe for being a fantastic co-supervisor throughout my mas-ters. His brilliant “idea bombs” and recommendations were absolutely invaluable. • MTN for their continued support and funding through the MTN Mobile Intelligence
Lab.
• Trinity Telecomms for their technical support and guidance, and providing access to their SMART M2M-enabling system. Special thanks to Eugene Prinsloo, for his patience in replying to an abundance of e-mails regarding the Trinity SMART platform during its evolution over the past year.
• My parents for always fully supporting me in everything that I do and providing me with more opportunities in my life than I could ever have imagined.
• My friends for all the laughs and good times we’ve shared that got me through the tough times.
Contents
Declaration i
Abstract ii
Uittreksel iv
Patents and Publications vi
Acknowledgements vii
Contents viii
List of Figures xi
List of Tables xiii
Nomenclature xiv
1 Introduction 1
1.1 Energy and water utility industries . . . 1
1.2 Eco-feedback technology . . . 1
1.3 Smart grids and enabling technologies . . . 2
1.4 Demand side management and demand response . . . 3
1.5 Synposis of electricity saving initiatives in South Africa . . . 4
1.6 Dissertation statements and hypotheses . . . 7
1.7 Research objectives . . . 8 1.8 Scope of work . . . 9 1.9 Contributions . . . 10 1.10 Dissertation structure . . . 10 2 EWH model 12 2.1 Modelling of EWHs . . . 12
2.1.1 Physics based models of EWHs . . . 13
2.1.2 Energy impact analysis . . . 15
2.2 Development . . . 16 2.2.1 One-node state . . . 17 2.2.2 Two-node state . . . 19 2.2.3 EWH Simulator . . . 22 2.2.4 Experimental setup . . . 23 2.2.5 Model development . . . 25 viii
2.2.6 Simulator development . . . 25
2.3 Results . . . 26
2.3.1 Standing losses . . . 26
2.3.2 Energy estimation . . . 26
2.3.3 Internodal energy transfer . . . 27
2.3.4 Computational complexity . . . 28
2.3.5 Energy impact analysis . . . 28
2.3.6 Sensitivity analysis . . . 29
2.4 Conclusion . . . 29
3 Usage detection algorithm 33 3.1 Usage event detection and profiling . . . 33
3.2 Development . . . 35
3.2.1 EWH outlet pipe model . . . 35
3.2.2 Typical temperature profile . . . 38
3.2.3 Event classification . . . 40 3.3 Experimental setup . . . 41 3.4 Results . . . 42 3.4.1 Detection accuracy . . . 42 3.4.2 Duration estimation . . . 43 3.4.3 Volumetric estimation . . . 44 3.5 Conclusion . . . 45
4 Android mobile application 46 4.1 Smartphone based eco-feedback . . . 46
4.1.1 Android operating system . . . 47
4.2 Application development . . . 49
4.2.1 UI navigation . . . 49
4.2.2 UI implementation . . . 50
4.2.3 Server communication . . . 54
4.2.4 OM2M Implementation . . . 58
4.3 Usability study development . . . 58
4.3.1 Test procedure . . . 58
4.3.2 Test environment and equipment . . . 59
4.3.3 Usability scenarios . . . 59
4.4 Usability study results . . . 62
4.4.1 Completion rate . . . 62
4.4.2 Post-task questionnaire . . . 64
4.4.3 Time on task and completed on time . . . 65
4.4.4 System usability scale . . . 66
4.5 Conclusion . . . 67
5 Conclusion 68 5.1 Evaluation of work . . . 68
5.1.1 Physics based model of residential EWH . . . 68
5.1.2 Usage profile determination . . . 69
5.1.3 Smartphone application . . . 70
Appendices 72
A EWH model outputs 73
B EWH simulator results 79
C Usability study documents 96
List of Figures
1.1 (a) Nest Android application screenshot and (b) intelligent thermostat device
by Nest Labs. . . 3
1.2 (a) Average residential load curve for South Africa and (b) proposed Homeflex TOU tariff structure designed by Eskom . . . 6
1.3 Diagram of system inputs and feedback. . . 9
2.1 One-node state energy flow. . . 18
2.2 Diagram of (a) energy flow, upper and lower nodes and (b) thermal equivalent circuit of two-node state. . . 19
2.3 Surface areas of EWH in horizontal orientation. . . 20
2.4 Pseudocode implementation of model. . . 25
2.5 Graphed output of the two-node model for dataset 3. . . 27
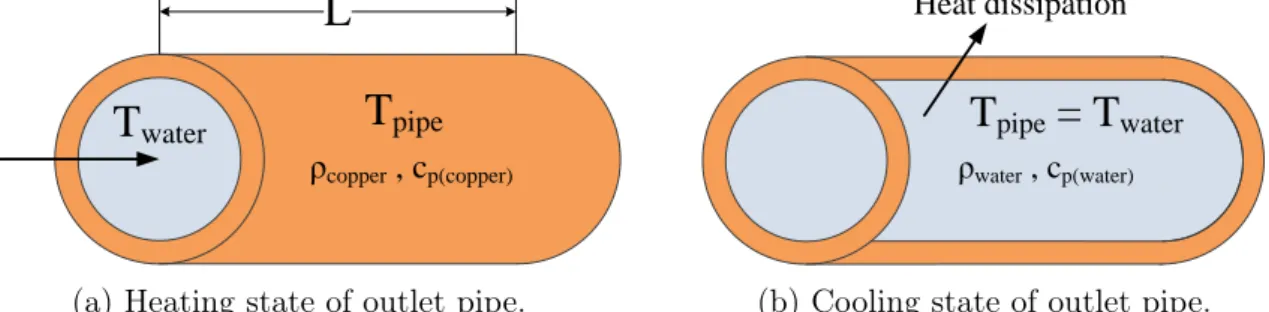
3.1 Temperature distribution for (a) heating and (b) cooling states of EWH outlet pipe. . . 35
3.2 Thermal equivalent circuit for outlet pipe. . . 36
3.3 Total thermal resistance of system. . . 37
3.4 Measured and simulated outlet pipe temperatures for (a) a small, low temper-ature and (b) a large, high tempertemper-ature usage event. . . 38
3.5 Hardware configuration of intelligent EWH. . . 39
3.6 Measured outlet temperature for: (a) an isolated usage event; and (b) two consecutive usage events. . . 39
3.7 Screenshot of software developed to analyse usage patterns and to compare water meter data with the thermal event detection algorithm. . . 43
4.1 Example of fragment combination in UI layouts for different mobile devices. . 48
4.2 Screenshots of tabs implemented in first version of Android mobile application. 49 4.3 Navigation drawer opened and displayed over selected tab. . . 50
4.4 Screenshots of tabs implemented in second version of Android mobile application. 51 4.5 Screenshots of pop-up window indicating change in EWH energy consumption. 52 4.6 Cumulative energy consumption of EWH for (a) selected day and (b) past week. 53 4.7 Interaction between UI and server. . . 54
4.8 Example of JSON formatted response returned by server for metric request. . 56
4.9 HTTP request headers for (a) command and (b) data write actions. . . 57
4.10 (a) Response and (b) decoded data from OM2M server . . . 57
4.11 (a) Diagram and (b) photo of usability study setup and equipment. . . 59
4.12 Example of tutorial to explain functionality in Android for first time user. . . 63
4.13 Screenshots of (a) revised Control tab layout and (b) active slot creation screen. 65 A.1 Graphed output of one-node model for dataset 1. . . 75
A.2 Graphed output of one-node model for dataset 2. . . 76
A.3 Graphed output of two-node model for dataset 3. . . 77
A.4 Graphed output of two-node model for dataset 4. . . 78
B.1 Screenshot of software developed to analyse impact of various energy saving actions and seasonal variations on energy usage of EWH. . . 80
B.2 Simulation results for varying ambient temperature. . . 81
B.3 Simulation results for varying inlet temperature. . . 84
B.4 Simulation results for varying set temperature. . . 86
B.5 Simulation results for varying usage event volumes. . . 88
List of Tables
2.1 Presented model compared to state of the art. . . 15
2.2 Total volume of water used per event for specific end uses. . . 23
2.3 Baseline energy consumption for typical usage profiles. . . 24
2.4 Baseline energy consumption for typical household types and sizes. . . 24
2.5 Values used to model the EWH. . . 24
2.6 Results for one- and two-node models. . . 27
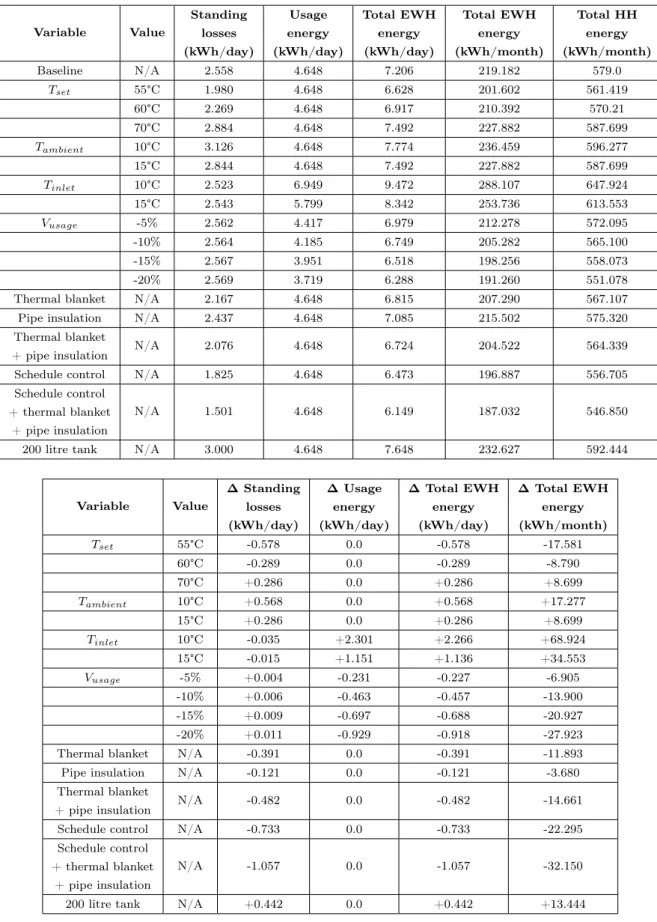
2.7 Energy impact analysis results for one-person household. . . 30
2.8 Energy impact analysis results for three-person household. . . 31
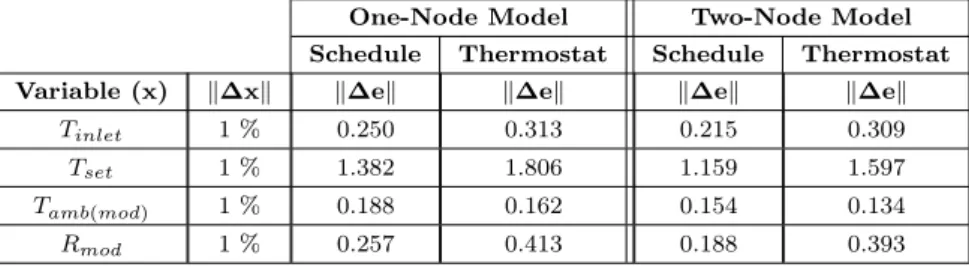
2.9 Sensitivity analysis results. . . 32
3.1 Thermal circuit parameter values for heating and cooling states [66; 68]. . . . 37
3.2 Total volume of water used per event for specific end uses. . . 40
3.3 Classifications of warm water end uses. . . 42
3.4 Results of Event Detection Algorithm . . . 42
3.5 Duration Estimation Error Results . . . 44
3.6 Summary of usage events for datasets. . . 44
3.7 Energy estimates using water meter and outlet temperature data. . . 45
4.1 Results of usability study. . . 63
A.1 Minimum time constant values obtained for datasets. . . 74
Nomenclature
Acronyms and Abbreviations
°C Degrees Celsius
ADT Android Development Tools
API Application programming interface
AUS Australian
CO2 Carbon Dioxide
CoT Completed on time
DoE Department of Energy
DR Demand response
DSM Demand side management
ETC Estimated time to complete
ETSI European Telecommunications Standards Institute
EWH Electrical water heater
FIFO First in first out
GHz Gigahertz
GNI Gross national income
GSM Global System for Mobile Communications
HH Household
HTTP Hypertext Transfer Protocol
HVAC Heating, ventilation and air conditioning
ICT Information and communication technologies
IDE Integrated development environment
ID Identifier
IHD In-home display
IMEI International Mobile Station Equipment Identify
JSON Javascript Object Notation
kB kilobytes
kWh kiloWatt-hour
kW kiloWatt
K Kelvin
M2M Machine-to-machine
NERSA National Energy Regulator of South Africa
OS Operating system
PDE Partial differential equation
QLD Queensland
RAM Random access memory
REST Representational State Transfer
RTP Real time pricing
SANEDI South African Energy Development Institute
SANS South African National Standard
SASGI South African Smart Grid Initiative
SMS Short messaging service
SSA Sub-Saharan Africa
SUS System usability scale
SWH Solar water heater
ToT Time on task
TOU Time-of-use
ttl time-to-live
UI User interface
URL Uniform resource locator
USA United States of America
Wi-Fi Wireless Fidelity
Constants cp(copper) =385 kgJ·K cp(water) =4180 kgJ·K ρCu =8740 mkg3 ρH2O =1000 kg m3
List of symbols used
A Surface area for convection m2
Acond Contact surface area between nodes m2
Acylinder Surface area of EWH tank m2
Aexposed Exposed surface area for given node m2
Aisosceles Surface area of isosceles triangle m2
Arectangle Surface area of rectangle m2
Asector Surface area of circular sector m2
Asegment Surface area of circular segment m2
c Chord length m
c Specific heat capacity of material under consideration kgJ·K
d Thermocline thickness m
di Inner diameter of outlet pipe m
do Outer diameter of outlet pipe m
Econd Internodal energy transfer kWh
Eheat Energy required to heat entire contents of EWH tank kWh
Ehot Energy in the remaining hot water inside the EWH tank
after usage event kWh
Einside Energy inside EWH tank kWh
Einput Energy input by EWH element kWh
Eloss Maximum allowable standing losses over a 24 hour
pe-riod, as stipulated by SANS 151, kWh
Eloss(node) Standing losses for node under consideration kWh
Etotal Total energy contained in usage event kWh
Eusage Energy consumed by usage event kWh
Ewarm Energy contained in warm water of usage event kWh
eη Efficiency of EWH element %
∆e Observed change in error %
G Thermal conductance m2J·°C
Gnode Thermal conductance of node under consideration mW2·°C
h Heat transfer coefficient mW2·°C
k Thermal conductivity of water W
m·K
L Length of body under consideration m
mtank Mass of water in EWH tank kg
mtotal Total mass of water consumed by usage event kg
musage Mass of warm water consumed by usage event kg
mwarm Mass of warm water consumed by typical usage events kg
Prated Power rating of EWH element W
Rnode Thermal resistance of node under consideration °C
·day kW h
Routside Thermal resistance between outer pipe wall and
sur-rounding environment
°C·day kW h
Rthermocline Thermal resistance of thermocline WK
Rwall Thermal resistance between inner and outer surfaces of
the pipe
°C·day kW h
Rwater Thermal resistance between water inside the pipe and
the inner pipe wall
°C·day kW h
r Typical radius of EWH tank m
s Arc length of the circular sector m
∆T Temperature difference °C
Tadjusted Adjusted temperature of specific end use of water °C
Taf ter Average temperature of water in EWH tank after
occur-rence of usage event °C
Tambient Temperature of outside environment of EWH °C
Tbef ore Average temperature of water in EWH tank before
oc-currence of usage event °C
Tdeadband Thermostat deadband °C
Tinlet Temperature of the water entering the EWH tank from
inlet pipe °C
Tinside Average temperature of water in EWH tank °C
Tlower Average temperature of water in lower node °C
Tnode Average temperature of water in node under
considera-tion °C
Tpipe Average temperature of outlet pipe system °C
Tset Set temperature of EWH °C
Tupper Average temperature of water in upper node °C
Ttypical Typical temperature of specific end use of water °C
T∞ Ambient temperature of EWH surroundings °C
Vadjusted Adjusted volume of specific end use of water litres
Vhot Volume of the unused hot water remaining inside EWH
tank after usage event litres
Vlower Volume of water in lower node litres
Vnode Volume of water in node under consideration litres
Vtank Volume of water in EWH tank litres
Vthreshold Threshold volume for two-node state transition litres
Vtypical Typical volume of specific end use of water litres
Vupper Volume of water in upper node litres
Vusage Volume of water consumed by usage event litres
˙
Vadjusted Adjusted flow rate of specific end use of water litresmin
˙
Vtypical Typical flow rate of specific end use of water litresmin
∆x Increment in variable under consideration %
θ Central angle of circular sector radians
Chapter 1
Introduction
1.1
Energy and water utility industries
Both global energy and water resources are under pressure due to growing demand as a result of increasing population size and rapid urbanisation, especially in developing regions [1]. For example, South Africa is, at the time of writing, in the midst of an energy crisis as the national utility is unable to meet the nation’s energy demands. Additionally, many regions of Australia, especially South-East Queensland, are experiencing prolonged drought that threatens the sustainability of their potable water supply [2]. Furthermore, global water demand is projected to increase by 55% by 2050, with domestic consumption expected to increase by 130% [1]. Additionally, global electricity demand is expected to grow by 70% by 2035 [1]. In the industrial and agricultural sector, more efficient technology can lead to a decrease in the per unit consumption of production. However, this decrease typically leads to increased production, and there is, consequently, no net decrease in demand [1]. Therefore, in an effort to meet the present utility demand, many utilities are targeting residential consumers of water and electricity in an attempt to reduce their usage.
The management of the infrastructure assets to ensure adequate supply for service provision is a complex challenge faced by water and electricity service providers (i.e. util-ities). Although the structure of their infrastructure may differ, these industries share challenges that can be addressed in similar means. The management of water and energy resources and supply is multifaceted as it is affected by numerous factors, including eco-nomical, health and environmental issues [1; 3], which can often be in conflict with one another. For example, providing reliable and safe water to the unserved population in de-veloping countries provides economical and health benefits but it must be balanced with preserving biodiversity in these environments [1; 4]. Therefore a collaborative approach is required for the effective management of water and energy resources that incorporates all the stakeholders of the utility industry, including consumers, as all of them are affected by the benefits provided through electricity and water [1].
1.2
Eco-feedback technology
Insufficient feedback of usage data makes it difficult for consumers to understand their consumption patterns and make informed decisions regarding their future water and elec-tricity use. Since monthly bills only detail cumulative monthly consumption, consumers have no way of linking particular activities to high resource usage. Moreover, the delivery
of bills is not usually immediate, further delaying the feedback. Consumers are therefore not able to intelligently reduce their consumption using existing metering and billing.
Eco-feedback technology aims to improve consumers’ awareness of the environmen-tal impact of their daily actions and behaviours [5]. This is based on the assumption that consumers generally have a lack of knowledge or understanding of the environmental impacts of the various actions they perform on a daily basis (e.g. taking a shower) [5]. Eco-feedback technologies are used to monitor consumers’ behaviour and provide them with useful information that can aid in understanding the impact of specific actions. This feedback can be implemented in a variety of methods. Ambient information display can be provided through dedicated in-home display (IHD) modules or other visual display devices placed in centralised and visible locations [6]. An example of an ambient feedback system for energy consumption is the Power-Aware Cord, which is a power cord that contains elec-troluminescent wires that illuminate when alternating current is passed through them [7]. The brightness of the wires varies according to the amount of current that flows through them, allowing users to become more aware of how and when they are using electricity. Alternatively, web-based applications can be used to relay information to consumers. For example, E2Home [8] provides an online interactive visualisation of electricity consump-tion and resident’s locaconsump-tion, therefore indicating usage patterns for consumers even when they are not actively using power at their home. Additionally, smartphone applications can provide users with convenient and mobile access to consumption data. For example, Sawacae [9] allows users to view their short or long term utility usage statistics on an Android device. However, the feedback and functionality provided by eco-feedback tech-nology requires data with a high temporal resolution. Smart metering techtech-nology can be used to obtain the fine-grained data required to implement these applications.
1.3
Smart grids and enabling technologies
Smart meter devices allow utility service suppliers to obtain more detailed usage data from consumers at a more regular interval than possible with conventional metering solutions. This implies that service suppliers are able to make more informed decisions regarding demand management and are able to better monitor usage patterns. Other advantages of smart metering for suppliers include: remote monitoring of infrastructure assets [10]; and remote reading of meters [11], therefore eliminating the need for manual meter reading. Smart metering can also offer several benefits to consumers by leveraging eco-feedback technologies to provide additional insight into usage and to increase awareness of the impacts of specific activities.
The mobile industry will play a crucial role in enabling the functionality required by smart metering applications, such as advanced control and feedback of high resolution usage data. The global unique subscriber penetration rate was 50% at the end of 2014, which implies that approximately half of the global population has at least one mobile subscription. Additionally, Global System for Mobile Communications (GSM) coverage is estimated to reach 84% of the population in developing countries [12] and has outgrown access to reliable and affordable electricity and water services in sub-Saharan Africa (SSA) over the past 10 years [13]. The rapid growth of mobile network coverage is providing millions of people with first time access to modern infrastructure services. For example, 130 million people in SSA are covered by mobile networks but do not have access to an improved water source [13]. Furthermore, smartphones are becoming increasingly ubiquitous, comprising 37% of global mobile connections at the end of 2014 and expected
(a) Nest mobile application screenshot. (b) Intelligent thermostat device.
Figure 1.1: (a) Nest Android application screenshot [15] and (b) intelligent thermostat device [16] by Nest Labs.
to increase to 65% by 2020 [14]. Although the penetration of smartphones in developing regions is lower, the price of handsets is rapidly decreasing and their adoption rate is expected to reach 63% in these regions by 2020 [14]. The ubiquity of smartphones makes them ideal for providing consumers with an interface for monitoring and controlling their household appliances.
A good example of the solutions that can be created by combining eco-feedback, mo-bile, smart metering technology is the Nest Learning Thermostat [16], created by Nest Labs and acquired by Google in 2014. This device leverages all of these technologies to create a unique solution that can aid consumers in reducing the energy cost of space heating and cooling by up to 12 and 15%, respectively [17]. Nest connects the households’ thermostat to a home Wi-Fi network that allows the temperature to be controlled from a mobile phone (shown in Figure 1.1a), tablet or laptop. This thermostat also implements intelligence that is able to learn consumers’ usage patterns and auto-schedules the tem-perature that is implemented after a week of monitoring. Nest can detect when users are away from home and will automatically turn the temperature control off to save energy. Additionally, a green leaf is displayed to users, shown in Figure 1.1, when they select a temperature that reduces their energy consumption, helping consumers to save energy. Additionally, other products, such as smoke detectors and lighting, can be interfaced to the Nest system for various home automation applications.
1.4
Demand side management and demand response
Electricity and water grids in many developing countries are struggling to meet the ever increasing demands [1]. Typically, utilities have focused on supply side management in the past, which involves the construction of additional infrastructure assets to increase generation capacity. However, with the advent of smart grid technologies, utilities are shifting their focus to demand side management (DSM). DSM aims to change the shape of the load curve (e.g. valley filling and peak shaving) through activities that intention-ally modify consumer usage patterns [18], allowing for the deferral of costly infrastructure development [19]. The concept of DSM is by no means new. Ripple controllers allow direct control of consumer appliances that consume large amounts of energy [18]. This type of control can be considered as DSM and the first installations of these devices date as far back as 1928, when they were used to control public lighting in Paris, France [20].
However, smart metering is allowing for enhanced communication between appliances, consumers and utilities to allow for more advanced load management schemes. For ex-ample, smart metering devices allow for the implementation of time-of-use (TOU) tariffs in the electricity industry [18]. These TOU tariffs generally consists of peak and off-peak prices for resource consumption with the aim of influencing consumers usage through the financial incentive of discounted rates.
DSM load control techniques can be classified into two broad categories based on the the entity that is responsible for the control decisions. Direct (or centralised) load control refers to the remote control of customer appliances (e.g. water heaters) by a utility for the purposes of peak demand reduction or emergency situation handling [18]. Indirect (or decentralised) load control includes the involvement of consumers and provides them with the choice to participate in load reduction efforts. Customers are incentivised (e.g. TOU tariffs) to reduce their usage, especially during peak periods, or shift their demand to off-peak periods, often referred to as demand response (DR) [21; 22].
Residential electrical water heaters (EWHs) are commonly used to heat water for household consumption in developing countries where gas is not readily available. EWHs are opportune appliances for DR due to their ability to store thermal energy for prolonged periods of time without significant heat loss [23]. Appliances capable of storing energy, such as electric water heaters (EWHs), are ideal candidates for intelligent control as they provide the most flexibility in terms of their scheduling capabilities. Part of the energy consumed by EWHs is to replenish heat dissipated to the environment. This type of energy is referred to as standing losses, and could be as much as 20% of the EWH’s consumption. These standing losses can be virtually eliminated with the use of a timer control unit and, if controlled correctly, these appliances are still able to provide warm water to meet household demand [24].
If customers are expected to participate actively in load management efforts, DR programs should increase consumers’ understanding of the benefits of participation and improve their capability to participate [22]. However, in order to provide this type of feedback to consumers, an accurate water usage profile is essential to coordinate the switching times of their EWHs [25]. This is because consumer usage patterns vary between users, seasonally, and between regions. For example, in South Africa, it was found that warm water consumption increased by up to 70% from summer to winter [26] and that low-income households consumed up to four times more warm water than high-income households [26]. If generic assumptions are made about these patterns of use, they may be inaccurate and result in consumption being adversely affected. For example, ineffective switching of consumers’ EWHs can result in a lack of warm water availability which inconveniences users. An obvious way to detect warm water consumption patterns is to use water flow meters. However, they are expensive (around $50 per standards-approved device) and their installation is invasive and labour-intensive.
1.5
Synposis of electricity saving initiatives in South
Africa
South Africa has a population of 54 million people and an electrification rate in the vicinity of 83 to 90% [27] (varies between national surveys and census). The national power utility, Eskom, is responsible for 95% of electricity supply in South Africa, of which 90% is generated in coal-fired power stations [28]. South Africa is, at the time of writing,
battling with an energy crisis as the national utility is unable to meet national energy demands. However, this is not the first time the country has faced an electricity shortage. The start of 2008 saw the implementation of rolling blackouts (i.e. load shedding) across the country, which have subsequently returned. These blackouts typically last 2 to 4 hours and are implemented at different times according to the pressure on the grid and the area in which they occur. Additionally, these blackouts can be implemented during business hours, which has a devastating effect on the country’s economy, with a predicted cost of R89 billion (US$ 7.2 billion) per month to the private sector due to lost production, revenue and wastage [29].
Since the beginning of the energy crisis in 2008, the government and Eskom have implemented various programmes to reduce the pressure on the national grid by promoting energy efficiency. The first of these initiatives is the Power Alert system which displays public messages on national television that are used to inform homeowners of the status of the national electrical grid due to the present demand [30]. Additionally, users may also view forecasts of the national electrical demand for the current day in half hour intervals. These messages are divided into four colour-coded alert states (green, orange, red and black) which indicate the increasing severity of the load on the national grid. Each message also presents suggestions on which appliances to switch off during the present state. For example in the red state (second most severe) users are instructed to switch off lights in all unoccupied rooms as well as their electric water heaters (EWH), pool pumps, air conditioners, dishwashers, tumble dryers and stoves.
Eskom has also released educational material, including several brochures, savings tips and videos, relating to energy conservation practices for commercial and residential customers [31]. Since EWHs are one of most energy-intensive appliances in households, this material includes several means of reducing the energy consumption of EWHs. For example, the EWH fact sheet published by Eskom suggests lowering the set temperature of the EWH, resulting in a reduction in the standing losses. Eskom also produced educational videos that encourage users to switch their EWH off during peak hours (5 pm to 9 pm). Although this may have no net effect on the overall usage of the EWH, it reduces the peak demand on the national grid. Other proposed methods of reducing warm water energy consumption include: insulating the EWH tank and pipes to increase its thermal resistance; and the use of a solar water heater (SWH), which may not reduce users’ energy consumption, but can reduce the pressure on the electrical grid as energy is obtained from an alternative source.
The SWH rebate programme is a joint effort from the South African Department of Energy (DoE), Eskom and the National Energy Regulator of South Africa (NERSA) and is aimed at promoting the use of alternative energy. Initially, Eskom subsidised the purchase of SWHs to incentivise households to heat water using solar power. The programme aimed to install one million SWHs by 2013 but only between 400 000 and 420 000 installations have been subsidised to date [32; 33]. Although the program fell short of its ambitious target, it has still been successful in reducing national demand and providing warm water to communities who are not on the grid. However, Eskom has since withdrawn from the programme and it is presently being managed by the DoE, which suspended the programme due to numerous inefficiencies (e.g. poor quality of installations, lack of verification of number of installations). Additionally, the overall penetration of the SWH technology is still severely limited. A recent national household survey consisting of 2,518 participants conducted by the DoE indicated that only 1% of surveyed households had a SWH installed [27], indicating that the number of installations may be significantly lower than the reported estimates.
(a) Average residential load curve for South
Africa. (b) Homeflex tariff structure.
Figure 1.2: (a) Average residential load curve for South Africa and (b) proposed Homeflex TOU tariff structure designed by Eskom [35].
Interest in smart grids has been demonstrated by the establishment of the South African Smart Grid Initiative (SASGI) under the South African Energy Development Institute (SANEDI). SASGI was created with the purpose of assisting in the development of the South African smart grid and providing inputs and direction for related policies. South African municipalities are already in the process of conducting smart grid related pilot projects [34]. The City of Johannesburg and its power utility, City Power, are presently implementing a smart metering pilot project in certain suburbs which is aimed at reducing the effect of load shedding on its customers (residential, businesses and industry). Requests are sent to consumers, prompting them to reduce their usage to a specified limit, using messages sent via short messaging service (SMS) as well as the smart meter’s in house display (IHD) unit. Since the IHD displays their present consumption, customers are able to disconnect appliances (e.g. stove, EWH) until their consumption is below the specified limit. If consumers fail to comply they will experience a 30 second power cut, followed by 30 seconds of power provision in which to reduce their usage. This process is repeated five times or until the user complies with the request. If consumption is still above the given limit after the fifth iteration, a 30 minute power outage is implemented. After this 30 minute period has expired the process is repeated until the user complies or load shedding is suspended. A total of 65 000 households were equipped with the smart meters necessary to implement this scheme in April of 2015 and this number is expected to reach 150 000 by October 2015 [34].
Finally, Eskom has designed a TOU tariff, called Homeflex [35], that consists of peak and off-peak electricity rates for various times of the day. The average residential elec-trical load curve for South Africa is shown in Figure 1.2a. From this load curve, there are two clear peaks in the residential demand at 07:00 and 18:00. In order to reduce the amount of electricity consumers use during these times, Eskom has proposed the tariff structure shown in Figure 1.2b. The timeslots highlighted in red indicate peak periods, when electricity will be more expensive and coincide with the peaks seen in the load curve. The energy charges suggested by Eskom indicate that consumers can expect to pay 50 and 300 % more in peak periods than in off-peak periods in summer and winter, respec-tively. The higher tariff increase in winter is as a result of the high demand during this season. Additionally, consumers can nominate high consumption appliances (i.e. EWH, swimming pool pump, underfloor heating and air conditioners) to be switched off during peak periods. Nominated appliances are automatically disconnected using an Appliance Control Device, which is essentially a switch that responds to control signals that it
re-ceives from a master station (managed by Eskom). Devices not eligible for nomination must be controlled manually by consumers. Initially, this tariff will be implemented on a voluntary basis for 10 000 residential customers in households that are equipped with smart meters.
It is estimated that there are over 5.4 million EWHs in South Africa and it is the main source of warm water for bathing purposes in 44% of formal urban households [27]. The heating of sanitary water, which consumes both energy and water, in South African com-mercial and residential buildings remains one of the largest contributors to the national electricity grid demand peaks [36]. It is responsible for 7% of the country’s total demand, and 20% of the residential demand [37]. However, during peak hours, it constitutes be-tween 30% and 50% [38]. These characteristics are not unique to South Africa, as warm water consumption is the second largest overall energy use activity in the residential sec-tor in the USA (second to space heating) [36]. Also, residential usage of water constitutes two thirds of the total water consumption in Gold Coast, Australia [39].
1.6
Dissertation statements and hypotheses
Dissertation statement 1:
The energy consumption of a residential EWH can be determined using a thermodynamic model and a warm water usage profile.
A thermodynamic model of a residential EWH is developed that is able to determine the energy consumption of the appliance to within considerable accuracy. Additionally, the model is able to accommodate the EWH in a horizontal orientation.
Hypothesis 1.1:
The energy input by the EWH element can be determined by estimating the temper-ature of the water in the EWH tank.
Hypothesis 1.2:
The energy lost due to usage events and standing losses can be estimated by sim-plifying the temperature distribution of the water in the EWH tank into one or two components (i.e. nodes).
Hypothesis 1.3:
The energy input and output of an EWH can be accurately modelled for various con-trol settings, usage profiles and orientations.
Hypothesis 1.4:
The impact of various energy saving actions (e.g. installing a thermal blanket on EWH) and control settings for several typical usage profiles can be estimated using the EWH model to simulate these conditions.
Dissertation statement 2:
A warm water usage profile for a residential EWH can be established using a temperature sensor on the outlet pipe of the EWH, as a cheaper alternative to a water meter.
An algorithm is developed for detecting when consumers are using warm water by monitoring the thermal transients that occur at the outlet pipe of the EWH with a tem-perature sensor. The approach uses temtem-perature fluctuations apparent on the outlet pipe of an EWH to identify the start and end times of usage events. The approach is in-tended to be used as the sensing mechanism of an schedule control scheme for EWHs, in which heating schedules are created to meet usage patterns while saving energy and costs. Hypothesis 2.1:
The time at which usage events occur can be determined with considerable accuracy using the outlet pipe temperature.
Hypothesis 2.2:
The start and end times of usage events can be estimated with reasonable accuracy in order to provide an estimate of the duration of events.
Hypothesis 2.3:
The volume of warm water consumed by usage events can be estimated using typical flow rates of specific end uses of warm water.
Dissertation statement 3:
A smartphone application can be used to allow users to remotely monitor and control their EWH in an intuitive and seamless manner.
An Android smartphone application is developed to allow users to monitor and control their EWH. This application implements the EWH model and event detection algorithm to provide functionality that will increase users’ understanding of their EWH and allow them to control it more efficiently.
Hypothesis 3.1:
The smartphone application provides a convenient and user friendly interface for users to monitor and control their otherwise obscured EWH.
Hypothesis 3.2:
The application can utilise a model of a residential EWH to provide instantaneous feedback on the impact of control decisions.
Hypothesis 3.3:
The application can utilise a warm water usage profile to help consumers control their EWH more efficiently.
1.7
Research objectives
The following research objectives were defined in order to investigate the aforementioned hypotheses:
Research objective 1:
To develop an efficient and accurate thermodynamic model that can be used to simulate the energy usage of a residential EWH in a desktop or mobile environment.
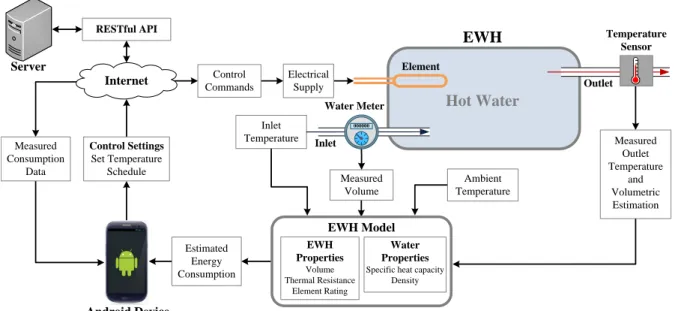
Inlet Temperature Ambient Temperature Control Commands Android Device Measured Outlet Temperature and Volumetric Estimation Measured Volume Hot Water Inlet 000000 Water Meter Outlet EWH Temperature Sensor Estimated Energy Consumption EWH Properties Volume Thermal Resistance Element Rating Water Properties
Specific heat capacity Density EWH Model Element Electrical Supply Internet Measured Consumption Data RESTful API Server Control Settings Set Temperature Schedule
Figure 1.3: Diagram of system inputs and feedback. Research objective 2:
To simulate and investigate the impact of various energy saving actions, control settings and seasonal variations on the energy consumption of a residential EWH.
Research objective 3:
To develop an algorithm that uses only the outlet temperature of a residential EWH to detect when warm water is consumed as well as estimate the volume and duration of detected usage events.
Research objective 4:
To develop and evaluate a user friendly Android smartphone application that allows users to easily control and monitor the energy and water consumption of their EWH from a mobile device.
1.8
Scope of work
This dissertation presents a mobile based eco-feedback solution for the energy and water consumption data of residential EWHs. Several tools were created to aid consumers in understanding their energy and warm water consumption as well as efficiently control their EWHs. A diagram of the system inputs and feedback are shown in Figure 1.3.
Firstly, a model of an EWH is developed in order to accurately simulate the behaviour of the EWH for various control settings. Secondly, an event detection algorithm is created that is able to detect when users consume warm water using only the outlet temperature of the EWH. This algorithm can be used to establish an accurate usage profile for users that can be used to co-ordinate the on/off control schedule in order to reduce the energy consumption of the EWH. The accuracies of the model and event detection algorithm are validated using actual household usage from a residential EWH. An Android mobile application is then created to allow consumers to remotely monitor and control their EWH from their mobile device. The model is implemented as part of the functionality
of the mobile application to provide a user with instantaneous feedback on the impact of changes in control settings. For example, users can determine how switching their EWH off intermittently will affect their energy consumption. Additionally, the event detection algorithm is utilised by the mobile application to establish usage profiles and provide recommended schedules for users, based on their consumption data. Finally, a usability study is conducted in order to examine the ease with which users are able to utilise the mobile application and to improve on any areas of difficulty that may exist.
1.9
Contributions
EWHs remain one of the main contributors to residential energy consumption in South Africa and other countries where they are used. Although educational material has been published to create awareness of energy saving actions for EWHs, it is unclear if users understand the content and efficiently control their EWHs. A mobile based eco-feedback system is developed for the energy and water consumption data of residential EWHs. The system consists of several components: an EWH model; an event detection algorithm; and an Android mobile application.
The EWH model developed is able to simulate the energy input and output of a res-idential EWH for various settings, usage profiles and orientations. Additionally, it was validated using over 900 hours of actual household data and found to be accurately able to simulate the energy consumption of the appliance. Also, it had a low computational complexity, making it ideal for use in a mobile devices which typically have limited com-putational and battery power.
The event detection algorithm developed presents a non-invasive approach for estab-lishing a warm water usage profile by monitoring thermal transients on the outlet. The algorithm is effective at estimating the time at which events occur and has limited accu-racy in determining the duration. Also, volumetric estimation was used to estimate the amount of water that was consumed for usage events and yielding promising results that can be further investigated.
The Android mobile application developed implements both the model and algorithm presented in this research. This allows the mobile application to provide instantaneous feedback of the impact of control decisions on users’ energy usage and help them to control their EWHs more efficiently by implementing recommended schedules that are generated based on their usage. A usability study was conducted to determine the ease with which users are able to utilise the mobile application. Several areas of difficulty were determined and these results were used to implement various changes to improve the application by making it more user friendly. Additionally, the results of the study indicate that the system is user friendly and that participants had a positive overall experience with the mobile application.
1.10
Dissertation structure
Chapter 2 describes the available EWH models in literature and the development of
the the model used to simulate the energy consumption of a residential EWH. The accuracy of this model is validated using 6 datasets that contain actual household data and the results reported.
Chapter 3 presents the the event detection algorithm used to create a warm water us-age profile using only the outlet temperature. The efficiency of the usus-age detection algorithm in detecting events, their duration and volume are reported.
Chapter 4describes the Android mobile application that was developed as an implemen-tation of the model and usage detection algorithm that provide users with a convenient interface for monitoring and controlling their EWHs. A usability study is then con-ducted to determine the ease with which users can accomplish various tasks and the results reported.
Chapter 5 concludes the work by validating the hypotheses from Chapter 1 using the results presented in Chapters 2 to 4. The main findings and contributions of the work in this dissertation are provided.
Chapter 2
EWH model
EWHs remain one of the main contributors to residential energy consumption in countries where they are used. EWH models serve as a step towards achieving optimised control, and can also be used to inform users of expected savings due to changes in control settings, if the model is energy-based. A suitable EWH model and warm water usage profile can be used to determine an accurate estimate of the overall energy usage of the EWH during the course of a day. These estimates could then be used by an eco-feedback application (e.g. IHD or smartphone) to provide users with instantaneous feedback on the effect of various control settings (e.g. decreasing set temperature) on the energy consumption of their EWH. However, for this to be accomplished, an accurate and simple EWH model is required. This section presents a theoretical simulation model of a residential EWH for: analysis of the thermal profile of the water inside the EWH tank; calculating the standing losses of the EWH, independent of its orientation; and simulating the effect of implementing a schedule that controls the on and off times of the EWH. The accuracy of the model is validated against six datasets (four comprising 900 hours with multiple usage events and two with only standing losses) and the results reported. The model is then used to simulate the impact of various energy savings actions (e.g. installation of a thermal blanket) in order to determine their impact on the energy consumption of the EWH.
2.1
Modelling of EWHs
An EWH consumes electricity to produce warm water and can therefore be classified as a heating system. Heating, ventilation, and air conditioning (HVAC) system models can generally be classified under three different types: data driven (black box or inverse); physics based (white box or forward); and grey box models, which are composed of a combination of physics based and data driven methods [40]. Data driven models (also referred to as black box or inverse) collect system performance data under typical use or for specific test cases [40]. The relationship between the input and output variables of the system is determined using various mathematical techniques including: frequency domain models with dead time; and data mining algorithms. Physics based models are based on the detailed knowledge of the process and its underlying physical principles [40]. These models are typically created using a thermal equivalent circuit or network where thermal resistivity and thermal capacitance are represented by resistors and capacitors, respec-tively, while heat and temperature are represented using current and voltage, respectively. The thermal equivalent circuit can then be used to derive time-domain differential
tions to describe the behaviour of the system. Grey box models use physics based models to create their basic structure and then apply parameter estimation algorithms to mea-sured system data to determine the parameters values [40]. Both data driven and grey-box models require measured data for parameter identification. However, it is not possible to obtain measurement data for the temperature distribution of an EWH tank that is both accurate and non-invasive, especially if it is horizontally orientated. A physics based model, on the other hand, requires only a detailed knowledge of the underlying process and was therefore used in the development of the model presented in this chapter.
2.1.1
Physics based models of EWHs
Dolan et al [41] presents an EWH model for use in the modelling of aggregate residential EWH loads. Their one-node model simulates the average thermal response of the water in the EWH tank using a single first-order differential equation. Assuming a uniform temperature distribution for the water in the tank accurately models the behaviour of the EWH in the absence of usage events [42]. However, when usage events occur, the cold water entering the tank causes thermal stratification of the water to occur, separating the higher density warm water from the lower density cold water [43]. Therefore the one-node model no longer accurately models the temperature distribution in the EWH tank after a usage event has occurred, which will result in an underestimation of the outlet temperature, and consequently of energy lost during usage events.
The mixing layer in between the warm and cold nodes is called the thermocline and it moves along the height of the EWH tank during water usage and heating events [43]. To more accurately model the stratification that occurs as a result of water withdrawal, two nodes are is used to model the warm and cold water layers separately. Kondoh et al [44] describes a two node model for a vertical EWH with two elements that operate independently. The thickness of the thrermocline is assumed to be zero to simplify the modelling process. Their model assumes fixed volumes for the lower, cold node and the upper, warm node and the temperature within each node is assumed to be uniform, with the upper node temperature always being higher than that of the lower node. The heat dissipation of each node to the surrounding environment is considered, but the value of thermal resistance of the EWH tank is estimated and not validated using measured data. Additionally, the water consumption profiles used for individual EWHs during simulations were estimated using measured average residential load profiles. Although Kondoh et al. improved upon the one-node model of Dolan et al., their assumption of fixed node volumes does not model the movement of the thermocline, and the model would therefore give erroneous energy flows for large usage events, and also would not accurately estimate the standing losses of the two nodes. Moreover, no validation process is reported to determine the accuracy of the model.
Diao et al [45] presents a model for a vertically orientated EWH that switches between the one and two-node state, depending on the operation of the EWH. When the EWH contains only warm water or has been fully depleted, they use the one-node state to model the behaviour of the EWH. In this state, their model is identical to that of [41] and it will remain in this state until a usage event occurs. Diao et al define a two-node state that their model enters into when water is withdrawn from the EWH and, similar to [44], the temperature of each node is assumed to be uniform. In the two-node state, their model defines an equation that describes the height (h) of the thermocline. This height moves along the length of the vertical tank during usage and heating events,
of the EWH tank (i.e. all the water in the tank is warm), then the model returns to the one-node state until another water withdrawal occurs. When their model is in the two-node state, the temperature of the upper node is held constant at the value of the average temperature of the water at the time that the usage event occurred, which does not accurately model the standing losses for the warm node. Additionally, this model is suitable for a vertically orientated EWH only, because the cross-sectional area of the tank is assumed to be constant. Additionally, the simulated results of the model are not validated against measured data to confirm the validity and accuracy of the model.
Xu et al [42] developed a partial differential equation (PDE) based model for simulating the temperature profiles at various locations in a vertically orientated EWH. The entire tank was discretised into bins of size 0.01 meters and standard finite difference was applied to solve the PDE used by the model to describe the temperature at varying positions in the tank at different times. The EWH had two elements that operated independently and their states (and therefore the energy consumption of the EWH) were determined by computing the instantaneous temperatures at their respective positions. Four temperature sensors were installed along the tank from top to bottom to determine if the model was accurately simulating the thermal dynamics of the EWH. Their thermal model was validated against the measurement data collected over 250 hours, during which only four significant usage events occurred. The validation process indicated that the simulated temperature values at the locations of the sensors was in good agreement with the temperature measurements. However, the computational complexity of the PDE model is significantly higher than that of the one and two-node models of [41], [44] and [45]. According to [42], the PDE model took 22 minutes to perform the 240 hour simulation with 1 minute simulation time steps, in comparison to the one and two-node models that took only 15 seconds. This is problematic if the PDE model is to be used for demand response programs for which it will need to simulate the behaviour of thousands of EWHs, or if the simulation is to be performed on mobile devices.
The grey-box model presented by Farooq et al [46] uses 8 one-node models to create a stratified model of the EWH tank. Similar to Xu et al, 8 temperature sensors were installed along the height of the tank to validate the simulated response of the model. The values of the input variables were obtained using parameter estimation techniques and high resolution measurement data (10 second sample rate). Although the simulated response of the eight nodes accurately matched the measurement data, the validation of the model was limited (less than 4 days of measurement data). Only two scenarios were used to validate the model: scenario 1, consisting of 70 hours of measurement data, during which no usage events occurred, to determine the model’s accuracy in the simulation of standing losses; and scenario 2, where the water in the EWH was heated to 60 °C and water was consumed at a constant rate of 90 grams per second over 2 hours. The response of the model when exposed to usage events of varying consumption amounts and draw rates at different intervals is not reported. Additionally, this model is unproven for EWHs that are horizontally orientated.
Despite EWHs commonly being installed in a horizontal orientation, existing models do not cater for this orientation. Although one-node EWH models inherently accom-modate horizontal alignment, they cannot accurately model EWH energy usage, because they do not take stratification into account [42]. Horizontally installed EWHs have a non-uniform cross sectional area between the two nodes (called the thermocline), and the surface area subject to standing losses for each node can not be determined analytically. Existing models that incorporate two or more nodes are therefore not suited to this ori-entation and only support vertical EWHs [42; 44; 45; 46]. Additionally, the available
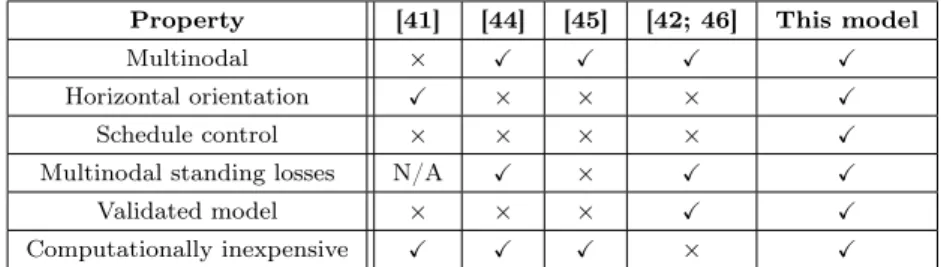
Table 2.1: Presented model compared to state of the art.
Property [41] [44] [45] [42; 46] This model
Multinodal × X X X X
Horizontal orientation X × × × X
Schedule control × × × × X
Multinodal standing losses N/A X × X X
Validated model × × × X X
Computationally inexpensive X X X × X
two-node models do not accurately accommodate standing losses while in the two-node state [44; 45]. Many of the models presented in literature are not validated against mea-sured data and their accuracy is unknown [41; 44; 45]. Moreover, none of existing works in literature validates modelled energy consumption against measured electrical energy. Only two of the existing sources report validation against measured data, and only vali-date the temperature values [42; 46].
Although some of the existing work (e.g. Dolan et.al [41]), investigate the impact on the grid of aggregate DSM-based schedule control, none of the existing EWH mod-els take into account the impact of schedule control on temperature variation, and en-ergy consumption of a single EWH, and assumes an always-on temperature-based (e.g. thermostat-) control. Additionally, the models available in literature are either too inac-curate, too complex or limited to their application to vertically orientated EWHs only. The contributions of the model presented in this chapter are summarised in Table 2.1. This chapter presents a theoretical simulation model for an EWH for: two node analysis of a horizontally orientated EWH with a varying thermocline position to accommodate horizontally oriented EWHs; calculating the standing losses for each node in the two-node state for both vertically and horizontally (varying exposed surface area) orientated EWHs; simulating the effect of implementing a schedule that controls the on and off times of the EWH. Additionally, the model is computationally inexpensive, and therefore suited to be used on a mobile device with limited processing power and battery capacity.
2.1.2
Energy impact analysis
The energy consumed to heat water for domestic purposes can be reduced through several methods. These include curtailment actions, such as shortening shower times (i.e. reduc-ing water consumption) or lowerreduc-ing the set temperature of the appliance. Furthermore, users can implement efficiency actions. These types of actions include the installation of a thermal blanket or pipe insulation. Other factors that influence the energy consumption of the EWH are: tank size, as a larger tank surface area causes larger standing losses; the use of timer control to intermittently switch the EWH on and off, which can reduce the standing losses; the ambient temperature, which impacts the standing losses of appliance; and inlet temperature, which impacts the usage losses because the water consumed is re-placed by colder water and more warm water is required to create the desired temperature at warm water outlets if the intlet temperature is lower.
Dutkiewicz [47] investigated the potential savings that can be achieved by various energy saving actions for EWHs based on the warm water requirements of typical middle income families in South Africa. This includes the impact of adding pipe and tank insu-lation in order to increase the thermal resistance of the system. The replacement of an EWH with an instant heater is also considered but is not considered optimum. This is because of the increased requirements of cabling and the installation cost of a 3-phase
sup-ply required to accomodate the increased wattage (21 kW) of the instant heater. Finally, Dutkiewicz highlights the importance of educating consumers on how to save energy for their EWHs (e.g. not running warm water unnecessarily or overfilling baths).
Bosman et al [48] investigated the impact of installing thermal blankets on the standing losses of standard EWHs in South Africa. The increased thermal resistance of the EWH reduces the standing losses of the device as heat is dissipated to the environment at a slower rate. The study included eighteen identical EWHs in a residential complex in Potchefstroom. Six of the EWHs were fitted with thermal blanked and periods where no warm water consumption occurred were used to determine the standing losses of the EWH. This data is then used to determine a linear approximation of the standing losses as a function of ambient and set temperature. It was determined that the standing losses of these devices could be decreased by 18% on average. It was also found that reducing the set temperature of an EWH from 75°C to 55°C would result in twice the reduction on standing losses than installing a thermal blanket.
Catherine et al [49] presents a usage profiling system to improve the efficiency of household EWHs. This system was installed in ten households and made use of a flow meter to determine the frequency and duration of warm water usage events during a day. A day was comprised of twelve 2 hour intervals, each of which would implement one of three different service levels (i.e. temperature set points) based on the amount of warm water used. The three service levels were defined as: high, which implements a temperature setting of 65°C; medium, which keeps the water temperature at 55°C; and low, where the set temperature was reduced to 45°C. This system was found to reduce the average temperature of a EWH by approximately 10°C, resulting in a reduction in the standing losses of the EWH while still satisfying users’ warm water demands.
Booysen et al [24] examined the effect of implementing timer control which only heats water prior to usage for a typical 150 litre EWH. The usage profile is assumed to consist of one 75 litre warm water usage event every 12 hours. This would be the equivalent of almost 3 consecutive typical showers in South Africa [50]. The results of this analysis indicate that, even for the high usage profile assumed, the total energy consumption of the EWH can be reduced by approximately 15% if an efficient schedule is implemented. It should be noted that, although water heating should only occur before major usage events, enough water could be heated during these times to allow the EWH to still supply warm water for smaller usage events (e.g. washing dishes) that may occur in the interval between the major usage events.
Gardner and Stern [51] found that efficiency-improving actions tend to save more energy than curtailing the usage of inefficient appliances for households in the USA, but it should be noted that there may be unforeseen consequences as a result of these efficiency improvements. A rebound effect occurs when consumers use efficient appliances more regularly as a result of their efficiency, which can result in a net increase of energy consumption [52].
2.2
Development
This section describes the development of a model that accurately simulates the temper-ature and energy flows inside an EWH. The model is based on energy flow inside the tank that can be used to estimate the temperature distribution of the water inside the tank. With knowledge of these temperatures, the behaviour of the EWH heating element, and therefore the energy input into the EWH, can be estimated. Energy losses occur due to
standing losses and warm water withdrawal from the EWH tank (i.e. usage). Firstly, a one-node model is described, simi