Determinants and a Predictive Equation for
the Aortic Length Estimation
Galina Zemtsovskaja1, Andrej Samarin1, Jelena Abina2, Kalju Meigas3, Margus Viigimaa4 MD, Diagnostics Division of North Estonia Medical Centre, Tallinn University of Technology, Estonia1
MD, Researcher, Institute of Biomedical Engineering, Tallinn University of Technology, Estonia2 Professor of Biomedical Engineering, Director of Technomedicum of Tallinn University of Technology, Estonia3 Professor, Institute of Cardiovascular Medicine, North Estonia Medical Centre, Tallinn University of Technology,
Estonia4
ABSTRACT: Aortic length is one of the important parameters in pulse wave analysis, which is widely used for arterial stiffness assessment. Accurate measurement of aortic length in routine medical practice is still not achieved. Non-invasive approximation to the distance between some sites on body surface is greatly affected by not allowed to correction factors. Invasive methods are more accurate, but not suitable for routine use. Other approaches are based on the estimation of aortic length by using either demographic or anthropometric parameters, or their different combinations. Our investigation was oriented towards the evaluation of the impact of demographic and anthropometric data to aortic length and the construction of a predictive equation for the aortic length estimation. Aortic length, measured on computed tomography (CT) images, was taken as actual aortic length and used in multiple linear regression analysis as a dependent variable for construction of the equation for aortic length estimation. It was demonstrated that about 65 per cent of the variations in aorta length could be explained by such determinants as height, weight and age. The equation-derived aortic length showed better accuracy than the aortic length estimated by approximation to jugulum-symphysis distance when compared with actual aortic length.
KEYWORDS:Aortic length, Pulse wave velocity, Jugulum-symphysis distance, Equation.
I. INTRODUCTION
The estimation of aortic length is a subject of scientific research interest mostly in the context of arterial stiffness investigation. Arterial stiffness (AS) is one of the earliest detectable manifestations of adverse structural and functional changes within the vessel wall [2] and the evaluation of AS was included in the ESH/ESC guidelines for the management of arterial hypertension.
The most validated methodology for arterial stiffness investigation is connected with the estimation of pulse wave velocity [2, 13]. Pulse wave velocity is estimated as the ratio between the distance travelled by pulse - aortic length and the pulse wave travelling time. The pulse wave travelling time can be recorded easily by most devices used in pulse wave analysis, but the determination of aortic length is the source of trouble.
Several studies have been oriented to the direct measurement of aortic length and different segments of aorta by using different imaging techniques, such as magnetic resonance imaging (MRI) [1, 3, 7, 8, 22, 26] or CT technique [9, 18, 20, 21, 28]. Although the direct investigation appears to be the most accurate, it cannot be widely used in routine medical practice because of the invasiveness of this approach.
measurement method is greatly affected by the body surface curvature, like large bust and abdominal obesity [1, 11, and 25]; the morphology of the aorta is not also taken into account with this method [2]. A more accurate calliper measurement method is not affected by the body curvature, yet is not enough precise either as it fails to consider the morphology of the aorta [2]. There are also some additional limitations to the most commonly used carotid-femoral estimation, an admixture of data from two circulatory branches – aortic-carotid and aortic-femoral [6, 10, and 26]. In this case, the arterial segments are not straight [25] and can overestimate the aortic length by approximately 25% [23]. Taking into consideration that a direct, invasive determination of aortic length in routine medical practice cannot be achieved, and indirect, non-invasive measurements are biased from actual aortic length to a greater or lesser extent, some investigators have tried to find other approaches. They have calculated the aortic length, based on age [4] or other anthropometric data, such as height [5, 7, 22, 23, 24, 28] as well as body shape, size and weight [3, 9] of subjects. The results of these studies differ much in details.
The aim of the present investigation is to evaluate the impact of demographic and anthropometric determinants to aortic length, as well as to assess the possibility of the construction of a predictive equation for the aortic length estimation, based on the results of this evaluation. To achieve this goal direct, actual aortic length measurements on CT images and statistical assessment of the impact of demographic and anthropometric determinants to the actual aortic length with the final construction of the predictive equation for the aortic length estimation was carried out.
II. MATERIALSANDMETHODS
Subject selection
44 subjects were selected retrospectively from the database of a previously carried out cross-sectional population based study of 1,026 people from Tallinn, Estonia [12]. The criteria for selection were the absence of aortic diseases and the availability of the images of CT scan covering at least thoracic, abdominal and pelvic regions. These scans had to be performed to some of the participants due to medical indications and within the time frame of the basic study.
The data on age, weight, height and body mass index (BMI) of the selected 44 subjects as well as Jug-Sy distance were previously collected during the above-mentioned study [12] and used in the current investigation.
CT studies
Estonian citizen identification code numbers of all the subjects from the above-mentioned cross-sectional population-based study were used to record CT scan data from the Estonian Picture Archiving and Communication System (PACS) database. Only the CT scans performed within the time frame of the basic study that cover at least thoracic, abdominal and pelvic regions were chosen from the recorded CT scans. Finally, CT images of 44 subjects were selected based on the above-mentioned criteria.
CT studies were performed using the GE Discovery 750HD scanner (General Electric, USA). Image processing workstation (Advanced Workstation, General Electric, USA) was used for the aortic length measurements on the CT images. To ensure accurate measurements contrast-enhanced axial CT images acquired with thin-collimation (slice thickness 0.625 mm) were used for analysis. The aortic length measurement on CT images was processed by the author as a specially trained investigator under the supervision of an experienced radiologist.
Aortic length measurement on CT images
reduced contrast between contrast media in the aorta and the surrounding tissues. Subsequently the length of aorta was measured along the centreline of the segmented aorta. The measurement results were recorded in millimetres and rounded to the nearest 1.0 cm before the statistical evaluation.
Statistical analysis
Statistical analysis was performed with SPSS 17.0 statistical software (SPSS Inc., Chicago, IL, USA) [17, 27].
Normality of data distribution was assessed by complex criteria for normality. The distribution of variables was treated for skewness, kurtosis and outliers. Kolmogorov-Smirnov and Shapiro-Wilk normality test, as well as normality plots were investigated and assessed.
Multiple linear regression analysis with a stepwise approach was applied to treat the correlations between dependent and independent variables. Actual aortic length - length from the aortic valve to the bifurcation of the aorta measured on CT images, was taken as a dependent variable while age, height, weight, BMI and Jug-Sy distance were used as independent variables. The combination of variables with a significant correlation and maximum value for adjusted R-square was elicited and used for the construction of a prediction equation for aortic length.
Consequently aortic length was calculated by the constructed predictive equation. Then we evaluated the agreement between the equation-derived and the actual aortic length and compared it with the agreement between the estimated by approximation to Jug-Sy distance aortic length and actual aortic length.
The study was done in accordance with ethical standards of the responsible committee on human experimentation and with the Helsinki Declaration of 1983.
III. RESULTS
Descriptive Statistics of the study population
Table 1 Descriptive Statistics
Variable/units N Range Minimum Maximum Mean Standard Deviation (SD)
95% Confidence Interval (CI)
Age years 44 38 26 64 51.2 10.2 31-71
Height cm 44 34,0 150,0 184,0 168.8 8.9 150.8-185.8
Weight kg 44 69,6 48,0 117,6 79.7 14.7 50.2-107.8
BMI kg/m2 44 21 19 40 27.9 4.9 18-38
Jug-Sy cm 44 14 44 58 50.3 3.7 43-58
Actual aortic length cm
44 19 39 58 47.5 4.4 39-56
Table 1 shows the descriptive statistics of the population under investigation. Since not all of the variance met ideally the criteria for the normality in distribution, the 95% CI is shown additionally to the mean and the SD.
Analysis of variables for normality of distribution
Table 2 Summary of accordance to the criteria for normal distribution
Variable Criterion 1 Criterion 2 Criterion 3
Criterion 4 Criterio n 5 Criterion 6 Criterion 7 Overall decision Mean and median difference Mean ±2 SD SD <1/2 mean Skewness and kurtosis Critical values Kolmogorov-Smirnov /
Shapiro-Wilk tests
Plots
Age Yes Yes Yes Yes
Slightly deviate d Yes/No Probably normal Slightly deviated
Height Yes Yes Yes Yes Yes Yes/Yes Yes Yes
Weight Yes Yes Yes Yes Yes Yes/Yes Yes Yes
BMI Yes Yes Yes Yes Yes Yes/Yes Yes Yes
Jug-Sy Yes Yes Yes Yes Yes No/No Yes Yes
Actual aortic
length Yes Yes
Yes Yes
Yes
No/Yes Yes Yes
Table 2 shows the summary of the estimation of the normality criteria results. “Yesˮ indicates the accordance to the normality criterion and “Noˮ- not in accordance.Each of the criteria has its own identification by index number.
The detailed data on the investigation of the normality with the results for each variable across all criteria are presented below in Tables 3 – 6 according to its index numbers.
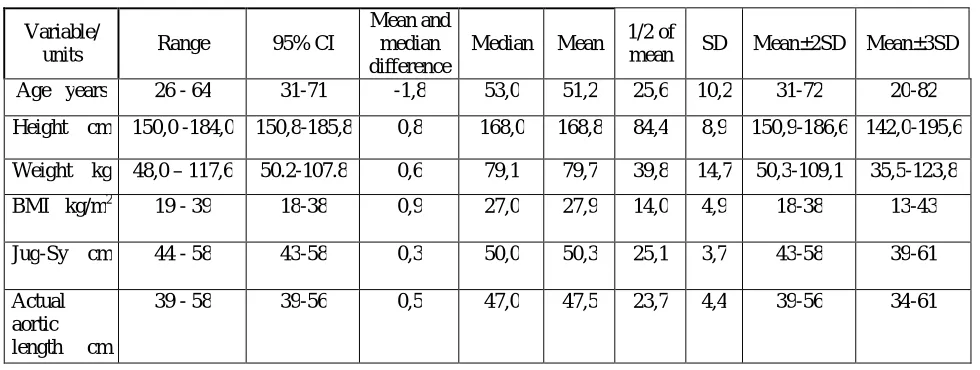
Table 3 Detailed summary of accordance to the criteria 1, 2 and 3 for normal distribution
Variable/
units Range 95% CI
Mean and median difference
Median Mean 1/2 of
mean SD Mean±2SD Mean±3SD
Age years 26 - 64 31-71 -1,8 53,0 51,2 25,6 10,2 31-72 20-82
Height cm 150,0 -184,0 150,8-185,8 0,8 168,0 168,8 84,4 8,9 150,9-186,6 142,0-195,6
Weight kg 48,0 – 117,6 50.2-107.8 0,6 79,1 79,7 39,8 14,7 50,3-109,1 35,5-123,8
BMI kg/m2 19 - 39 18-38 0,9 27,0 27,9 14,0 4,9 18-38 13-43
Jug-Sy cm 44 - 58 43-58 0,3 50,0 50,3 25,1 3,7 43-58 39-61
Actual aortic length cm
39 - 58 39-56 0,5 47,0 47,5 23,7 4,4 39-56 34-61
Table 3 shows data for the assessment of normality by criteria 1, 2 and 3. All the investigated variables were complied with normality by these criteria.
within the interval of mean ±2 SD (criterion 2). As shown in Table 3, the estimated 95% CI was within or close to the actual range of the mean ±2 SD for all investigated variables. Criterion 3 expresses the rule of thumb regarding the ratio between the standard deviation and the one-half of the mean. All investigated variables were complied with normality due to their standard deviation being not larger than one-half of the mean. It is possible to assess additionally the outliers by data of Table 3. The outliers, neither univariate nor multivariate, do not exist because the complete data of all variables lie within 3 standard deviations above and below the means of corresponding variables.
Table 4 Detailed summary of accordance to the criteria 4 and 5 for normal distribution
Variable Skewness Kurtosis
Statistic Std. Error Critical value Statistic Std. Error Critical value
Age -,783 ,357 -2,19031 -,076 ,702 -0,10831
Height -,017 ,357 -0,04787 -1,037 ,702 -1,47854
Weight ,201 ,357 0,562529 ,029 ,702 0,041687
BMI ,091 ,357 0,253333 -,475 ,702 -0,6768
Jug-Sy ,196 ,357 0,549336 -,815 ,702 -1,16114
Actual aortic length ,436 ,357 1,219611 -,201 ,702 -0,28651
Table 4 shows data for the assessment of normality by criteria 4 and 5 with detailed results for skewness and kurtosis.
Skewness and kurtosis statistical values of almost all variables lie between (-1) and (+1), which indicates the normality. One kurtosis value slightly deviating from this range (-1.04) is observed for height, indicating that the distribution tends to be flat, but is still appropriate for normality.
Critical value is the other criterion for the assessment of normality. Being calculated by dividing skewness and kurtosis by their standard errors, it must be in the range of (-1.96) to (+1.96). All variables passed the test properly, only the critical value for age was slightly over the range (-2.19), that showed the tendency of age distribution to be slightly biased to the left.
Table 5 Detailed summary of accordance to the criterion 6 for normal distribution
Variable Kolmogorov-Smirnov test Shapiro-Wilk test Kolmogorov-Smirnov /
Statistic df Sig. (P-value)
Statistic df Sig.
(P-value) Shapiro-Wilk
Age ,115 44 ,172 ,928 44 ,009 Yes/No
Height ,119 44 ,132 ,961 44 ,145 Yes/Yes
Weight ,102 44 ,200 ,985 44 ,833 Yes/Yes
BMI ,108 44 ,200 ,980 44 ,616 Yes/Yes
Jug-Sy ,132 44 ,052 ,948 44 ,048 No/No
Actual aortic length
,140 44 ,030 ,971 44 ,333 No/Yes
Table 5 shows data for the assessment of normality by criterion 6 with detailed results of Kolmogorov-Smirnov and Shapiro-Wilk tests.
Table 6 Detailed summary of accordance to the criterion 7 for normal distribution
Variable Histograms Normal Q-Q plot
Detrended normal Q-Q
plot
Box plot (no extreme
values)
Box plot (median in
centre)
Assessment of the normality
plots
Age Probably Slight
deviation
Probably Yes Slight deviation Slight deviation
Height Yes Yes Yes Yes Slight deviation Yes
Weight Yes Yes Yes Yes Yes Yes
BMI Yes Yes Yes Yes No Yes
Jug-Sy Probably Yes Yes Yes Yes Yes
Actual aortic length Yes Yes Yes Yes Yes Yes
Table 6 consists of the summaries from normality tests of different plots assessment. The assessment of all plots is summarized in the last column.
The histogram shape for height, weight, BMI and aortic length showed to be not ideal, but a satisfactory approximation to a bell-curve. Histograms curves for age and Jug-Sy were poorer than expected, but still acceptable. The normal and detrended Q-Q plots of all variable data showed slight deviations from the normal distribution. Normal Q-Q plot for age showed a slightly larger, albeit still acceptable deviation of data points from the linear progression. Detrended Q-Q plot for age showed the horizontal line biased to the top with approximately equal spread of points around it. The boxplot symmetry to the median line was acceptable for weight, Jug-Sy and actual aortic length. For BMI, height and age values the symmetry is slightly disturbed.
Final results of the assessment of variables by different normality criteria have been transferred from Tables 3,4,5,6 into Table 2 and the overall decision has been made based on all the observed results for the normality criteria. Table 2 shows that the results on height, weight and BMI variables are in good agreement with normality tests across all criteria. Jug-Sy and actual aortic length variables have passed almost all tests, except one. Age value distribution is characterized with slight deviation from normality, skewed with tail to the left and has not passed one of the tests. In spite of this bias at some skewness criteria, age is considered as approximately normally distributed because the mean value is a good estimate of the centre of data.
Thus, taking into consideration all the results together, all variables have been recognized as normally or approximately normally distributed and allowed to parametric statistic.
Assessment of an association between the actual aortic length and age, length, weight, BMI and Jug-Sy
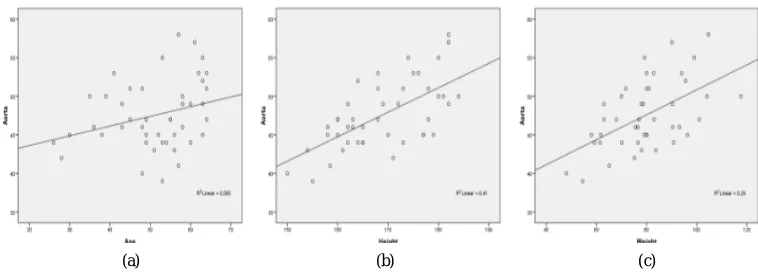
Pearson`s correlation coefficients and scatter plots have been obtained for the assessment of associations between variables.
The scatter plots shown in Fig.1 indicate a positive linear association of the actual aortic length with all variables. Among them, the scatter around the plot is narrower for height (b) and Jug-Sy distance (e) and slightly wider for weight (c). Aorta association with age (a) is very weak and the weakest one is with BMI (d).
Table 7 Correlation coefficients
Actual aortic length Age Height Weight BMI Jug-Sy
Actual aortic length
Pearson Correlation
1 ,292 ,640 ,538 ,195 ,642
Sig. (2-tailed) ,027 ,000 ,000 ,205 ,000
Table 7 shows the correlation coefficients between actual aortic length and age, height, weight, BMI and Jug-Sy.
The comparison of the correlation coefficients in Table 7 shows the same tendency as the scatter plots: the best predictors of aortic length are height and Jug-Sy, the association with weight is slightly lower, but still highly significant at the P < 0.0001 level. The relation between aortic length and age is still significant (P<0.05), but it is not significant for BMI.
Assessment of the impact of demographic and anthropometric data on the actual aortic length and the building of a predictive model for aortic length estimation
Although not all variables showed equally good correlation with actual aortic length, it was decided to include all the variables with significant correlation into the investigation of their impact on the changes in the aortic length. Thus, actual aortic length as a dependent variable and height, weight, age and Jug-Sy – as independent variables were treated by a standard linear regression approach with a stepwise method.
Fig. 1 shows scatter plots for the associations between investigated variables: actual aortic length and age (a), actual aortic length and height (b), actual aortic length and weight (c), actual aortic length and BMI (d), actual aortic length and Jug-Sy (e).
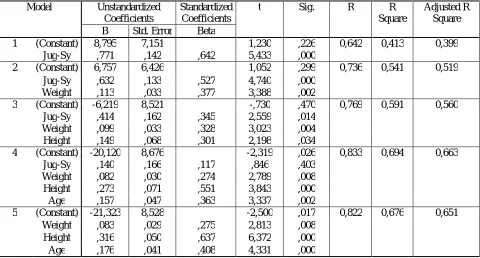
Table 8 Summary of the stepwise analysis
Model Unstandardized Coefficients
Standardized Coefficients
t Sig. R R
Square
Adjusted R Square B Std. Error Beta
1 (Constant) 8,795 7,151 1,230 ,226 0,642 0,413 0,399
Jug-Sy ,771 ,142 ,642 5,433 ,000
2 (Constant) 6,757 6,426 1,052 ,299 0,736 0,541 0,519
Jug-Sy ,632 ,133 ,527 4,740 ,000
Weight ,113 ,033 ,377 3,388 ,002
3 (Constant) -6,219 8,521 -,730 ,470 0,769 0,591 0,560
Jug-Sy ,414 ,162 ,345 2,559 ,014
Weight ,099 ,033 ,328 3,023 ,004
Height ,149 ,068 ,301 2,198 ,034
4 (Constant) -20,120 8,676 -2,319 ,026 0,833 0,694 0,663
Jug-Sy ,140 ,166 ,117 ,846 ,403
Weight ,082 ,030 ,274 2,789 ,008
Height ,273 ,071 ,551 3,843 ,000
Age ,157 ,047 ,363 3,337 ,002
5 (Constant) -21,323 8,528 -2,500 ,017 0,822 0,676 0,651
Weight ,083 ,029 ,275 2,813 ,008
Height ,316 ,050 ,637 6,372 ,000
Age ,176 ,041 ,408 4,331 ,000
Table 8 shows the summary of the stepwise analysis. The results of contribution of different combinations of independent variables to aortic length and R-square values are presented.
The first model of stepwise analysis with Jug-Sy distance as the only independent variable, has been recognized as not reliable because (as it is shown in Table 8) the constant in Jug-Sy predictable model is not significant (P =0.226). The summary of stepwise analysis shows that despite good correlation (R=0.642) between Jug-Sy and aortic length, the changes in Jug-Sy can describe only approximately 40% (adjusted R Square =0.399) of changes in aortic length. The second, the third and the fourth models are also not reliable because either the constant or the coefficient of one of the variables in the models is not significant.
Thus, the model five, which includes weight, height and age for actual aortic length prediction, has been chosen as more appropriate. The model five represents significant correlations between the actual aortic length and age, height and weight and also demonstrates the relative importance of each independent variable through the standardized coefficients, or beta weights, that are independent from the units in which the measurement of variables is done. The model five demonstrates that height (beta=0.637, p<0.0005) influences aorta length more than age (beta=0.408, p<0.0005) and the influence of weight (beta=0.275, p<0.008) is weak in the investigated population. The standardized Coefficient R (=Pearson`s product moment correlation coefficient r) demonstrates strong (R=0.822) relationship between actual aortic length and age, height and weight, taken all together. The coefficient of multiple determinations (adjusted R Square) shows that 65 per cent of variations in aorta length of the investigated population can be definitely explained by the combination of age, height and weight.
Table 9 Tests of Normality
Kolmogorov-Smirnov Shapiro-Wilk
Statistic df Sig. Statistic df Sig.
Standardized Predicted Value
,118 44 ,140 ,966 44 ,209
Standardized Residual ,053 44 ,200 ,993 44 ,994
Table 9 shows the results of Kolmogorov-Smirnov and Shapiro-Wilk tests for a standardized predicted value and a standardized residual.
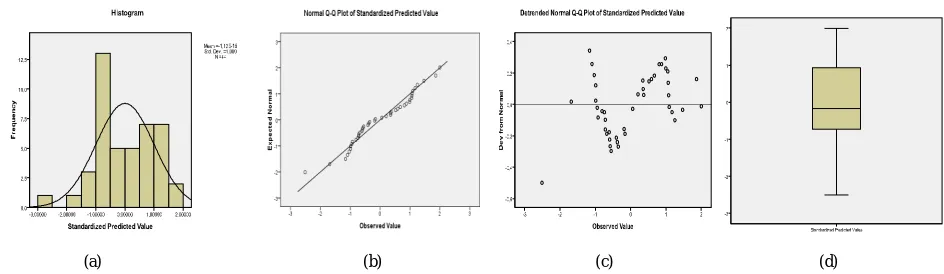
A standardized predicted value and a standardized residual showed a slight deviation from normality, as it is demonstrated by test of normality (Table 9).
(a) (b) (c) (d)
Fig.2 shows plots for a standardized predicted value: histogram (a), normal Q-Q plot (b), detrended Q-Q plot (c) and box plot (d).
(a) (b)
The histogram shapes for a standardized residual and a regression standardised residual showed to be not an ideal, but a satisfactory approximation to a bell-curve. Histogram curve for a standardized predicted value was poorer, but still acceptable. The normal and detrended Q-Q plots showed slight deviations from the normal distribution for all parameters, with the poorer result for a standardized predicted value. The boxplot symmetry to the median line was acceptable for standardized residual and slightly disturbed in standardized predicted value distribution.
Predictive equation for the aortic length estimation
Data from all of 44 subjects was used for the construction of the predictive model for the aortic length estimation. The equation of the relationship between the dependent variable and three independent variables are generally expressed as:
= + + +
The values of parameters for construction of the predictive equation for aortic length estimation were taken from the Table 8: =−21.323 as Constant coefficient, the slopes of the regression line = 0.176 as coefficient for age ( , in years), = 0.316 as coefficient for height ( , in cm) and = 0.083 as coefficient for weight ( , in kg).
Using these values, the equation was written the following way:
= (−21.323) + 0.176∗( ) + 0.316∗(ℎ ℎ ) + 0.083∗( ℎ )
where is the equation-derived aortic length.
Validation of the aortic length calculated by the constructed equation and aortic length estimated by approximation to the Jug-Sy distance against the actual aortic length
The aortic length of each subject was calculated according to the constructed equation. The means of actual aortic lengths and equation-derived were about equal: 47.6 (CI 40.5 – 54.8) cm and 47.5 (38.9 -56.2) cm, accordingly. To assess whether there was a systematic bias [27] of the calculated length from actual aortic length, paired samples T-test for the mean differences between both measurement techniques was applied. The mean differences between the aortic length calculated by equation and the actual one approximated zero (0.09) and was not significant (P=0.811). This result indicates that there was no systematical bias of aortic length calculated by the equation from the actual one. On the contrary, the mean of differences between Jug-Sy distance and the actual aortic length was far from zero (2.7) and P<0.0005 was significant. This result indicates that the Jug-Sy distance was systematically biased from the actual aortic length.
Fig. 5 shows the differences in couple of equation-derived aortic length and actual aortic length at each individual level.
The differences between each of 44 pairs of aortic length were calculated. In Fig.5 each pair of measurements is presented by an individual point. Actual aortic length value was plotted on X-axis as a zero line and a bias of each pair - on Y-axis. As it is shown in Fig.5, the aortic length calculated by the equation was about symmetrically distributed around zero at the values up to 51 cm, with only a slight prevalence of positively biased values. In the short interval of values above 51 cm there was the underestimation of calculated length in prevalence. To elucidate if the aortic length calculated by the equation is in better agreement with the actual aortic length than the Jug-Sy distance, the same graphic approach was applied to the comparison of the Jug-Sy distance with the actual aortic length (Fig. 6).
Fig. 6 shows the differences in couple of Jug-Sy distance and actual aortic length at each individual level.
As shown in Fig. 6, the Jug-Sy distance was systematically positively biased almost at all the aortic length levels, with negative bias at a few points. The bias at smaller aortic length values up to 51 cm was more prominent than at greater values of aortic length.
Thus, the observation of Fig.5 and Fig.6 showed that while the equation-derived aortic length was not biased in any systematic way in the range of measurement up to 51 cm, the Jug-Sy distance showed a systematic positive bias in the whole range of measurement.
Validation of the constructed equation on the other population against invasively measured aortic length
Weber et al [28] study has attracted our attention because the same part of aortic length was considered – i.e. from the ascending aorta to the aortic bifurcation. In contrast to our non-invasive investigation, the measurement technique for the estimation of aortic length [28] was invasive, that provided the most accurate measurement.
We tried to predict the mean of aortic length for Weber et al [28] study population, applying mean values of age, height and weight of that population to our equation.
= (−21.323) + 0.176∗( ) + 0.316∗(ℎ ℎ ) + 0.083∗( ℎ ) =
= (−21.323) + 0.176∗(60.3) + 0.316∗(170.5) + 0.083∗(81.6) = 49.9
Thus calculated by our equation aortic length (49.9 cm) was found exactly the same as the invasively measured one reported in the Weber et al [28] study (49.9 cm).
IV. DISCUSSIONS
To the best of our knowledge, the present study is the first study oriented to the estimation of the length of the whole aorta from the aorta valve to the bifurcation that was performed on the CT images and resulted in the construction of the equation. Also it was statistically demonstrated that the equation describes 65% of the investigated population based on age, height and weight of subjects.
Our investigation showed that the estimation of aortic length by the constructed equation was more accurate than that based on the approximation to the Jug-Sy distance. Aortic length approximation to Jug-Sy distance corresponded to the actual aortic length only in about 40% of the investigated population and demonstrated a systematic positive bias from actual aortic length. The equation-derived aortic length showed no systematic bias, although indicated some tendency to overestimation at shorter and underestimation at longer actual aortic lengths.
Although in our previous work [18] we used the similar CT approach to the aortic length estimation, there are some fundamental distinctions. In the previous study we measured the longer aortic segment than in the present study, from aortic valve to the bifurcation of the left common femoral artery, the measurement technique on CT images was not described in detail, only four subjects were investigated and only the determinants in the form of age and Jug-Sy distance were treated. The measured range of Jug-Sy distance was 50 – 57 cm, while the ranges presented in this study are from a more extensive range of 44 - 58 cm, probably since more subjects were investigated. The correlation coefficients in the previous work were very similar to the finding in the present work: for Jug-Sy distance - 0.686 and 0.642, and for age - 0.248 and 0.292, accordingly. Despite the positive correlation of Jug-Sy distance with the aortic length, it was not applied to the predictive equation in the present study because of the results of statistical analysis. Some investigators also compared Jug-Sy distance and actual aortic length. Although their methods differed from ours, the estimated distances were very similar, thus interesting for comparison. Rezai et al [20] investigation was done on MRI and a shorter aortic segment without the length of ascending aorta. Similarly to our study, they discovered that Jug-Sy distance was longer than the actual aortic length, although the mean difference was about 4 cm bigger than in our study. However, the discrepancy becomes minimal, if we take into account that they compared Jug-Sy distance with a shorter aortic segment. The omitted part of aorta was reported in their work as 4.7 cm. Weber et al [28] measured the aortic distance invasively by catheter length, extended from ascending aorta to bifurcation and compared it with Jug-Sy distance. According to their results, the mean of aortic length and Jug-Sy distance were slightly longer than in our study - 49.9 cm vs. 47.5cm and 54.1 cm vs. 50.3 cm, respectively. It can be logically explained by the positive bias in demographic data values of their investigated population in comparison with our investigated population, especially in the mean of age (60.3 vs. 51.2 years), height (170.5 vs. 168.8 cm) and weight (81.6 vs. 79.7 kg), respectively.
Some investigators estimated the aortic length by approximation to other distances on the body surface, such as the most usually used femoral length. Their results are not directly comparable with our results because the carotid-femoral distance is anatomically longer than Jug-Sy measured in our study. However, they also found that the distance measured on the body surface was longer than actual aortic distance. Thus Huybrechts et al [8] showed that the tape measurement from the body surface multiplied by 0.8, gives an acceptable correlation with a real aortic path length. Bossuyt et al [1] also applied the multiplication method and showed that it lacked equal accuracy for the right and left side measurements on the body surface. Nemeth et al [14] indicated that carotid-femoral distance on the body surface exceeds the catheter-derived aortic length by more than 5 cm.
The height, weight, BMI and age are the most frequently used determinants among all the investigated. Unfortunately, correlation coefficients cannot be directly compared with our data because the investigated distances and study designs are very different from ours. Parissis and al [16] investigated the aortic segment length on cadavers during autopsy and the correlations with height, age, sex and distance from the jugular notch to trans-pyloric plane. They found that weight and BSA did not affect the investigated part of aortic length. Postulation about BSA is in accordance with our results, but it is not so for weight - the supplementation of weight gives the additional power to the prediction of aortic length in our investigation. Hallab et al [7] studied the correlation between the length of the aortic arch with height, age and weight. They found a correlation with height (R=0.60), but not with age and weight. On the contrary, we found a correlation with age and weight and this discrepancy is easily explained due to the completely different lengths of the investigated aortic segments. Igari et al [9] found a significant positive correlation of aortic segment length with height (R=0.664) and weight (R=0.527), the correlation with age (R= -0.105) was insignificant. Hallab et al [7] showed correlation with height (R=0.60), Weber et al [28] also found the aortic distance correlation with height (R=0.46). Sugawara et al [22] showed that aorta lengthens with age, mostly due to the elongation of the ascending aorta. Huybrechts et al [8] showed the moderate influence of age and minimal influence of BMI. We also found a moderate correlation for age and an insignificant for BMI. In contrast to our results, the study of Pierce et al [19] demonstrated the better impact of age and BMI to the estimation of aortic length.
Several authors have constructed the equations for aortic segment length prediction. Most of the equations were based only on height. Igari et al [9] equation was L= (-26.253) +1.507x (height), while Hallab et al [7] study presented another equation L=1.8x (height) - 83.12. Weber et al [28] have constructed the equations on body height divided by 4, with addition of the empirical constant based on their data. Dotter et al [4] studied the influence of age and derived the predictive equation for thoracic aorta length on the basis of age; however it is incomparable with our data because the age variable in their equation was transformed into log10. Parissis and al [16] added height, age, sex and distance from the jugular notch to trans-pyloric plane to the equation. As a result, the predictive aortic length according to their study was proportional to the following variables: 0.37x (height), 0.35x (age), 0.21x (sex) and 0.61x (distance on the body surface). Pierce et al [19] derived the equation based on age and BMI: 0.173x(age) + 0.661x(BMI) + 34.548. In our study, the value set of height, weight and age gives a more prominent impact to the aortic length estimation. This discrepancy may be explained by differences in the measurement techniques, the investigated parts of aorta and variables used in the predictive equations.
As mentioned above, we did not find any other studies for the determination of the whole aortic length by a similar methodology. Igari et al [9] estimated the length of the aortic segment from subclavian artery to the renal artery; Hallab et al [7] - the length of the aortic arch starting from the aortic valve and ending with the intersection of a point on a descending aorta adjacent to a horizontal plane passing through the aortic valve; Huybrechts et al [8] - from carotid to femoral artery, Rezai et al [20] – from aortic arch to the aortic bifurcation. However, the investigation of the whole aortic length, from ascending aorta to bifurcation is very important. As it is shown in the work of Sugawara et al [23], ascending aorta undergoes the elongation with age, almost 2-fold between 20 and 80 years of age [15]. Thus, the omitting of this part of aorta will influence the estimated aortic length accuracy dramatically.
As it was previously noted, the techniques used for the measurements of the aorta segment length were also different. Igari et al [9] and Hallab et al [7] used CT images, as in our work, but the estimated path length and measured methodology differed from ours. Some authors used MRI [1, 8, 20, and 23], others – catheters [28]. In their regression analysis Pierce et al [19] used aortic distance, which was computed by carotid-femoral pulse wave velocity, multiplied by travelling time.
We demonstrated in a systematic manner that height, weight and age had the greatest impact on aortic length changes in the investigated population. But despite considerable contribution of these parameters to the aortic length, only about 65 per cent of the variations in aorta length could be explained by their values. We can probably explain this phenomenon not only by random influences of other, non-investigated determinants, but by the systematic opposite direction in the changes of main determinants - age and body height. While the aorta lengthens to some extent with age, the height diminishes and may provide false shortening of the aorta length evaluated by the equation. These opposite changes probably reduce the predictive power of the equation.
V. CONCLUSION
Our study demonstrated that age, height and weight were the main determinants of aortic length. The established predictive equation for aortic length estimation allowed to assess accurately aortic length in 65% of the investigated population. No doubt, the non-invasive approach to aortic length estimation can offer only an approximation to the actual aortic length due to the range of variation in aortic length, influenced by several individual factors. However, it remains increasingly important that the result of our investigation has demonstrated a better accuracy of the determination of the aortic length by the equation constructed in our work than the estimation of the aortic length by approximation to Jug-Sy distance. Finally, the accurate results of the validation of our equation against invasively measured aortic length on other (Weber et al) population, suggests that the equation can be reliably used in further investigations.
Study limitations
Relatively small amount of subjects imposed some limitationsonthe results of our study. Thus, a more precise analysis of the influence of the investigated determinants on the aortic length in subgroups of different sex and age was not possible.
Acknowledgment
The part of investigation was financially supported by the Estonian Ministry of Education and Research under institutional research financing IUT 19-2.
Conflict of interest
The authors declare that they have no conflict of interest.
REFERENCES
[1] Bossuyt, J., van De Velde, S., Azermai, M., Vermeersch, SJ., De Backer, TLM., Devos, DG., Heyse, C., Filipovsky, J., Segers, P., and Van Bortel, LM., “Noninvasive assessment of carotid-femoral pulse wave velocity: the influence of body side and body contoursˮ, Journal of Hypertension, vol. 31, no. 5, pp. 946-951, May 2013.
[2] Cavalcante, JL., Lima, JAC., Redheuil, A., Al-Mallah, MH., “Aortic Stiffness. Current Understanding and Future Directionsˮ, Journal of the American College of Cardiology, vol. 57, no. 14, pp. 1511-1522, April 2011.
[3] Dogui, A., Kachenoura, N.,Frouin, F.,Lefort, M.,De Cesare, A.,Mousseaux, E., andHerment, A.,“Consistency of aortic distensibility and pulse wave velocity estimates with respect to the Bramwell-Hill theoretical model: a cardiovascular magnetic resonance studyˮ, Journal of Cardiovascular Magnetic Resonance, vol. 13, article number 11, 2011
[4] Dotter, CT., Roberts, DJ., and Steinberg, “Aortic Length: Angiocardiographic measurementsˮ, Circulation, vol 2, pp. 915-920, Dec.1950. [5] Filipovský, J., Mayer, O., Dolejšová, M., Seidlerová, J., “The assessment of carotid–femoral distance for aortic pulse wave velocity: Should it
be estimated from body height? ˮ, Artery Research, vol. 4, issue 1, pp. 19–23, March 2010.
[6] Girerd, N., Legedz, L., Paget, V., Rabilloud, M., Milon, H., Bricca, G., and Lantelme, P., “Outcome Associations of Carotid-Femoral Pulse Wave Velocity Vary With Different Measurement Methodsˮ, American Journal of Hypertension, vol. 25, no. 12, pp. 1264-1270, Dec. 2012. [7] Hallab, M., Chevalet, P., Dahou, A., Berrut, G., “Relationship between the aortic valves and an anatomical landmark using chest CT scanˮ,
Artery Research, vol. 6, issue 1, pp. 55–57, 2011.
[8] Huybrechts SA, Devos DG, Vermeersch SJ, Mahieu D, Achten E, de Backer TL, Segers P, van Bortel LM, “Carotid to femoral pulse wave velocity: a comparison of real travelled aortic path lengths determined by MRI and superficial measurementsˮ, Journal of Hypertension, vol. 29, no. 8, pp. 1577-1582, Aug. 2011.
[9] Igari, T., “The length of the aorta from the subclavian artery to the renal artery based on computed tomographic measurements in Japanese adultsˮ, J Artif Organs, vol. 9, no. 4, pp. 267-270, 2006.
[11] Joly, L., Perret-Guillaume, C., Kearney-Schwartz, A., Salvi, P., Mandry, D., Pierre-Yves, M., Karcher, G., Rossignol, P., Zannad, F., Benetos, A., “Pulse Wave Velocity Assessment by External Noninvasive Devices and Phase-Contrast Magnetic Resonance Imaging in the Obeseˮ,
Hypertension, vol. 54, pp. 421-426, 2009.
[12] Kaldmäe, M., Viigimaa, M., Zemtsovskaja, G., Kaart, T., Abina, J., Annuk, M., “Prevalence and determinants of hypertension in Estonian adultsˮ, Scandinavian Journal of Public Health, vol. 42, no. 6, pp. 504−510, 2014.
[13] Laurent, S., Cockcroft, J., Van Bortel, L., Boutouyrie, P., Giannattasio, C., Hayoz, D., Pannier, B., Vlachopoulos, C., Wilkinson, I., and Struijker-Boudier, H.,“Expert consensus document on arterial stiffness: methodological issues and clinical applicationsˮ, European Heart
Journal, vol. 27, pp. 2588–2605, 2006.
[14] Németh, ZK., Studinger, P., Kiss, I., Taha El. Hadj Othmane, Nemcsik, J., Fekete, BC., Deák, G, Egresits, J., Szathmári, M., Tislér, A., “The method of distance measurement and torso length influences the relationship of pulse wave velocity to cardiovascular mortalityˮ, American
Journal of Hypertension, vol. 24, no. 2, pp. 155-161, Feb. 2011.
[15] O'Rourke, M., Farnsworth, A., O'Rourke, J., “Aortic Dimensions and Stiffness in Normal Adultsˮ, JACC: Cardiovascular Imaging, vol. 1, no. 6, pp. 749-751, 2008.
[16] Parissis, H.,Soo, A.,Leotsinidis, M.,andDougenis, D., “A statistical model that predicts the length from the left subclavian artery to the celiac axis; towards accurate intra aortic balloon sizingˮ, Journal of Cardiothoracic Surgery, vol. 6, article no. 95, 2011
[17] Peat, J., and Barton, B., “Medical Statistics. A Guide to data Analysis and critical Appraisalˮ, BMJ Books, Blackwell Publishing Ltd, 2005.
[18] Pilt, K., Kööts, K., Meigas, K., Šamarin, A., Zemtsovskaja, G., and Margus Viigimaa, “The Aortic Pulse Wave Velocity Estimation for Arterial Stiffness Assessmentˮ, In Proc. IFMBE 2014, vol. 45, pp. 294−297, 2014.
[19] Pierce, GL., Casey, DP., Fiedorowicz, JG., Seals, DR., Curry, TB., Barnes, JN., DeMaris R. Wilson, and Stauss, HM., “Aortic pulse wave velocity and reflecting distance estimation from peripheral waveforms in humans: detection of age- and exercise training-related differencesˮ, Am J Physiol Heart Circ Physiol, vol. 305, no. 1, H135–H142, 2013.
[20] Rezai MR., Cowan BR., Sherratt N., Finn JD., Wu FC., Cruickshank JK., “A magnetic resonance perspective of the pulse wave transit time by the Arteriograph device and potential for improving aortic length estimation for central pulse wave velocityˮ, Blood Press Monit, vol. 18, no. 2, pp. 111-118, Apr. 2013.
[21] Shin H., Chavan A., Witthus F., Selle D., Stamm G., Peitgen HO., Galanski M., “Precise determination of aortic length in patients with aortic stent grafts: in vivo evaluation of a thinning algorithm applied to CT angiography dataˮ, Eur Radiol, vol. 11, no. 5, pp. 733-738, 2001. [22] Sugawara J., Hayashi K., Tanaka H., “Arterial path length estimation on brachial-ankle pulse wave velocity: validity of height-based formulasˮ,
Journal of Hypertension, vol. 32, no. 4, and pp. 881–889, 2014.
[23] Sugawara J., Hayashi K., Yokoi T., Tanaka H., “Age-associated elongation of the ascending aorta in adults ˮ, JACC: Cardiovascular Imaging, vol. 1, no. 6, pp. 739-748, 2008.
[24] Vermeersch, SJ., Rietzschel, ER., De Buyzere, MR., Van Bortel, LM., Gillebert, TC., Verdonck, PR., Laurent, S., Segers, P., and Boutouyrie, P., “Distance measurements for the assessment of carotid to femoral pulse wave velocityˮ, Journal of Hypertension, vol. 27, pp. 2377-2385, 2009.
[25] Van Bortel, LM., Duprez, D., Starmans-Kool, MJ., Safar, ME., Giannattasio, C., Cockcroft, J., Kaiser, DR., and Thuillez, C., “Clinical applications of arterial stiffness, task force III: recommendations for user procedures”, AJH, no.15, pp. 445-452, 2002.
[26] Wentland, AL., Grist, TM., Wieben, O., “Review of MRI-based measurements of pulse wave velocity: a biomarker of arterial stiffnessˮ,
Cardiovascular Diagnosis and Therapy, vol. 4, no. 2, pp. 193-206, 2014.
[27] Watson, PF., Petrie, A., “Method agreement analysis: a review of correct methodologyˮ, Theriogenology, vol. 73, no. 9, pp. 1167-1179, 2010. [28] Weber, T., Ammer, M., Rammer, M., Adji, A., O'Rourke, MF., Wassertheurer, S., Rosenkranz, S., and Eber, B., “Noninvasive determination