Open Access
Proceedings
Analysis of variation in NF-
κ
B genes and expression levels of
NF-
κ
B-regulated molecules
Wen Liu-Mares
1, Zhifu Sun
1, William R Bamlet
2, Elizabeth J Atkinson
2,
Brooke L Fridley
2, Susan L Slager
2, Mariza de Andrade
2and Ellen L Goode*
1Address: 1Division of Epidemiology, Department of Health Sciences Research, Mayo Clinic College of Medicine, 200 First Street Southwest, Rochester, Minnesota 55905, USA and 2Division of Biostatistics, Department of Health Sciences Research, Mayo Clinic College of Medicine, Rochester, 200 First Street Southwest, Harwick 7, Rochester, Minnesota 55905, USA
Email: Wen Liu-Mares - [email protected]; Zhifu Sun - [email protected]; William R Bamlet - [email protected]; Elizabeth J Atkinson - [email protected]; Brooke L Fridley - [email protected]; Susan L Slager - [email protected]; Mariza de Andrade - [email protected]; Ellen L Goode* - [email protected]
* Corresponding author
Abstract
The nuclear factor-kappaB (NF-κB) family of transcription factors regulates the expression of a variety of genes involved in apoptosis and immune response. We examined relationships between genotypes at five NF-κB subunits (NFKB1, NFKB2, REL, RELA, and RELB) and variable expression levels of 15 NF-κB regulated proteins with heritability greater than 0.40: BCL2A1, BIRC2, CD40, CD44, CD80, CFLAR, CR2, FAS, ICAM1, IL15, IRF1, JUNB, MYC, SLC2A5, and VCAM1. SNP genotypes and expression phenotypes from pedigrees of Utah residents with ancestry from northern and western Europe were provided by Genetic Analysis Workshop 15 and supplemented with additional genotype data from the International HapMap Consortium. We conducted association, linkage, and family-based association analyses between each candidate gene and the 15 heritable expression phenotypes. We observed consistent results in association and linkage analyses of the NFKB1 region (encoding p50) and levels of FAS and IRF1 expression. FAS is a cell surface protein that also belongs to the TNF-receptor family; signals through FAS are able to induce apoptosis. IRF1 is a member of the interferon regulatory transcription factor family, which has been shown to regulate apoptosis and tumor-suppression. Analyses in the REL region (encoding c-Rel) revealed linkage and association with CD40 phenotype. CD40 proteins belong to the tumor necrosis factor (TNF)-receptor family, which mediates a broad variety of immune and inflammatory responses. We conclude that variation in the genes encoding p50 and c-Rel may play a role in
NF-κB-related transcription of FAS, IRF1, and CD40.
from Genetic Analysis Workshop 15
St. Pete Beach, Florida, USA. 11–15 November 2006
Published: 18 December 2007
BMC Proceedings 2007, 1(Suppl 1):S126
<supplement> <title> <p>Genetic Analysis Workshop 15: Gene Expression Analysis and Approaches to Detecting Multiple Functional Loci</p> </title> <editor>Heather J Cordell, Mariza de Andrade, Marie-Claude Babron, Christopher W Bartlett, Joseph Beyene, Heike Bickeböller, Robert Culverhouse, Adrienne Cupples, E Warwick Daw, Josée Dupuis, Catherine T Falk, Saurabh Ghosh, Katrina A Goddard, Ellen L Goode, Elizabeth R Hauser, Lisa J Martin, Maria Martinez, Kari E North, Nancy L Saccone, Silke Schmidt, William Tapper, Duncan Thomas, David Tritchler, Veronica J Vieland, Ellen M Wijsman, Marsha A Wilcox, John S Witte, Qiong Yang, Andreas Ziegler, Laura Almasy and Jean W MacCluer</editor> <note>Proceedings</note> <url>http://www.biomedcentral.com/content/pdf/1753-6561-1-S1-info.pdf</url> </supplement>
This article is available from: http://www.biomedcentral.com/1753-6561/1/S1/S126
© 2007 Liu-Mares et al; licensee BioMed Central Ltd.
Methods
The nuclear factor-kappaB (NF-κB) family of transcription factors regulates the expression of hundreds of genes including pro-inflammatory and apoptosis genes [1-3]. Transcription of these genes is activated by five NF-κB sub-units (NFKB1 encoding p50, NFKB2 encoding p52, REL encoding c-Rel, RELA encoding p65, and RELB encoding Rel-B). The NF-κB pathway is a critical candidate gene pathway for numerous cancers and cardiovascular end-points.
Samples and data availability
Genetic Analysis Workshop 15 (GAW15) Problem 1 included data on 14 three-generation pedigrees (two sets of grandparents, one set of parents, and a sibship of eight individuals) consisting of Utah residents with ancestry from northern and western Europe (CEPH-Utah, CEU). Pedigree members had genotypes on ~2882 single-nucle-otide polymorphisms (SNPs) spread throughout the genome and ~3554 phenotypes consisting of expression levels from lymphoblastoid cells hybridized onto Affyme-trix Genome Focus Arrays [4]. Expression density was scaled to 500 and transformed by log2 [4]. Forty-two
par-ticipants (14 trios) were also studied by the International HapMap Consortium; thus, additional genotype data were available on selected individuals (including 28 unre-lated individuals) in families 1340, 1341, 1345, 1346, 1347, 1362, 1408, 1416, and 1454 [5,6].
Genotype selection
Genotypes from 21 GAW15-provided SNPs surrounding ~20 cM of each candidate gene were analyzed: NFKB1 (90.6 cM to 117.5 cM on chromosome 4), NFKB2 (94.5 cM to 119.8 cM on chromosome 10), REL (45.7 cM to 73.4 cM on chromosome 2), RELA (44.7 cM to 78.4 cM on chromosome 11), and RELB (41.2 cM to 58.0 cM on chromosome 19). Denser genotypes from HapMap within 5 kb of each gene were also used: NFKB1 (106 SNPs, mean r2 = 0.25), NFKB2 (3 SNPs, mean r2 = 0.01),
REL (16 SNPs, mean r2 = 0.41), RELA (3 SNPs, mean r2 =
0.07), and RELB (8 SNPs, mean r2 = 0.18).
Phenotype selection and heritability
Regulatory targets of NF-κB transcription (N = 165) were compiled from review of the literature [1-3] and online catalogs [7]. Expression levels of 75 from these target genes were available in the GAW15 Problem 1 data. We estimated heritability (h2) using the Splus/R library multic
[9] assuming a polygenic model in the 14 pedigrees. Fif-teen phenotypes with h2 greater than 0.4 (p-value < 0.001)
were included in the current analysis (Table 1). Additional h2 estimates are available upon request.
Linkage analysis in extended pedigrees
Variance components multipoint linkage analysis of 15 expression levels was performed using multic [9] with GAW15 genotype data among 14 extended pedigrees (194 individuals), assuming 1 Mb~1 cM.
Family-based association
Family-based association tests (single-SNP and three-SNP haplotypes) were performed using the program FBAT [10] to examine the null hypothesis of no association and no linkage. Two analyses were conducted for each pheno-type; first, dense HapMap genotypes in 14 trios, and sec-ond, GAW15 genotypes in 14 extended pedigrees.
Association in unrelated individuals
Using data on 28 unrelated individuals, analysis of vari-ance (ANOVA) tested associations between 15 heritable expression levels and genotypes at dense HapMap SNPs surrounding the five candidate genes. With the Splus library HaploStat [8], score testing assessed haplotype associations.
Results
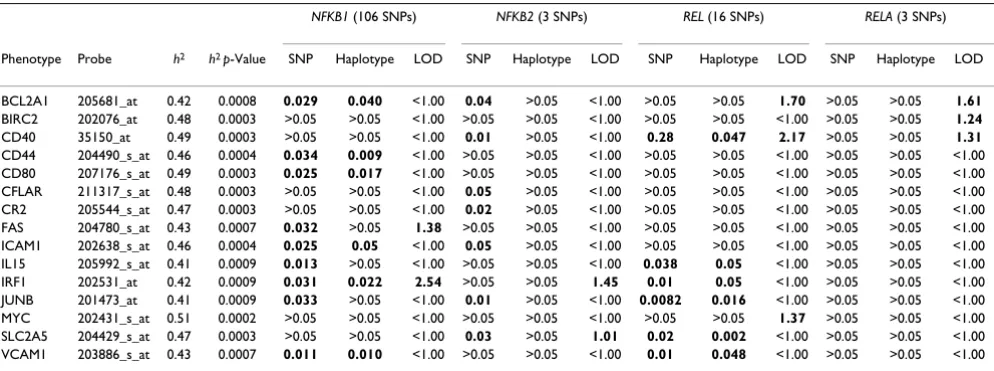
Linkage analysisLinkage analysis showed elevated LOD scores in the NFKB1 (FAS and IRF1 expression), NFKB2 (IRF1 and SLC2A5 expression), REL (CD40, BCL2A1, and MYC expression), and RELA regions (CD40, BCL2A1, and BIRC2 expression). Linkage regions and maximum LOD scores for each gene are presented in Tables 1 and 2.
Family-based association tests (FBAT)
Association in unrelated individuals
We examined associations between 15 expression pheno-types and genopheno-types at HapMap SNPs. Haplotype analy-ses indicated an overlap with the single SNP association results for NFKB1 and REL (Table 1). Among nine pheno-types associated with SNPs in NFKB1, six (BCL2A1, CD44, CD80, ICAM1, IRF1, and VCAM1) had suggestive haplo-type associations. Among six phenohaplo-types associated with REL SNPs, all six phenotypes had suggestive haplotype association (Table 1). More detailed results are available upon request.
Discussion
We utilized a variety of methods (association, linkage, and family-based association) in an attempt to under-stand the relationship between variation in NF-κB genes and expression levels of 15 proteins. We consider this to be an exploratory analysis of publicly available data with a limited sample size. We sought to reveal avenues for future study within the NF-κB pathway. As an assessment of these methods, we concluded that haplotype analysis combined with single-SNP analysis, family-based associa-tion tests, and linkage analysis has helped inform our understanding of the NF-κB pathway. Analyses revealed association and linkage between NFKB1 and FAS, IRF1 expression phenotypes, and between REL and CD40 expression phenotype. FAS is a cell surface protein that belongs to the tumor necrosis factor (TNF) receptor fam-ily; signals through FAS are able to induce apoptosis. IRF1 is a member of the interferon regulatory transcription fac-tor family, which regulates apoptosis and tumor-suppres-sion. CD40 proteins also belong to TNF protein family, which is essential in mediating a broad variety of immune
and inflammatory responses. Based upon our results, we concluded that variation in the NFKB1 and REL genes may play a role in downstream regulation of FAS, IRF1, and CD40 expression.
There are several limitations to this study, including lack of adjustment for multiple tests on multiple loci and use of a small sample size; interpretation of tests on a sample of 14 warrants caution. No results were statistically signif-icant after taking into account the multiple comparisons. Nonetheless, these exploratory analyses provide clues for further large scale studies.
Conclusion
We make three general conclusions. First, single-SNP asso-ciation testing was less conservative than haplotype and FBAT analysis, where haplotype analyses indicated associ-ation, results of single-SNP association testing were also significant; however, association found by single-SNP testing was not always revealed by haplotype analysis. Because this is not simulated data, we do not know whether the single-SNP results represent true or false pos-itives. Second, because haplotype analysis requires two or more SNPs, for those genes with only one or very few SNPs, haplotype analysis might not be an appropriate analysis to perform. Third, FBAT analysis was relatively conservative compared to single-SNP and haplotype asso-ciation analyses. FBAT found fewer SNPs and haplotypes with point-wise significance. In summary, we suggest that single-SNP and haplotype association analyses be used in first-stage analysis to generate a smaller set of candidate SNPs; FBAT and linkage analysis can then narrow down the list of potentially important loci.
Table 1: Heritability (h2), association testing (minimum p-values of SNP and haplotype association test), and linkage analysis
(maximum LOD scores)a
NFKB1 (106 SNPs) NFKB2 (3 SNPs) REL (16 SNPs) RELA (3 SNPs)
Phenotype Probe h2 h2 p-Value SNP Haplotype LOD SNP Haplotype LOD SNP Haplotype LOD SNP Haplotype LOD
BCL2A1 205681_at 0.42 0.0008 0.029 0.040 <1.00 0.04 >0.05 <1.00 >0.05 >0.05 1.70 >0.05 >0.05 1.61 BIRC2 202076_at 0.48 0.0003 >0.05 >0.05 <1.00 >0.05 >0.05 <1.00 >0.05 >0.05 <1.00 >0.05 >0.05 1.24 CD40 35150_at 0.49 0.0003 >0.05 >0.05 <1.00 0.01 >0.05 <1.00 0.28 0.047 2.17 >0.05 >0.05 1.31 CD44 204490_s_at 0.46 0.0004 0.034 0.009 <1.00 >0.05 >0.05 <1.00 >0.05 >0.05 <1.00 >0.05 >0.05 <1.00 CD80 207176_s_at 0.49 0.0003 0.025 0.017 <1.00 >0.05 >0.05 <1.00 >0.05 >0.05 <1.00 >0.05 >0.05 <1.00 CFLAR 211317_s_at 0.48 0.0003 >0.05 >0.05 <1.00 0.05 >0.05 <1.00 >0.05 >0.05 <1.00 >0.05 >0.05 <1.00 CR2 205544_s_at 0.47 0.0003 >0.05 >0.05 <1.00 0.02 >0.05 <1.00 >0.05 >0.05 <1.00 >0.05 >0.05 <1.00 FAS 204780_s_at 0.43 0.0007 0.032 >0.05 1.38 >0.05 >0.05 <1.00 >0.05 >0.05 <1.00 >0.05 >0.05 <1.00 ICAM1 202638_s_at 0.46 0.0004 0.025 0.05 <1.00 0.05 >0.05 <1.00 >0.05 >0.05 <1.00 >0.05 >0.05 <1.00 IL15 205992_s_at 0.41 0.0009 0.013 >0.05 <1.00 >0.05 >0.05 <1.00 0.038 0.05 <1.00 >0.05 >0.05 <1.00 IRF1 202531_at 0.42 0.0009 0.031 0.022 2.54 >0.05 >0.05 1.45 0.01 0.05 <1.00 >0.05 >0.05 <1.00 JUNB 201473_at 0.41 0.0009 0.033 >0.05 <1.00 0.01 >0.05 <1.00 0.0082 0.016 <1.00 >0.05 >0.05 <1.00 MYC 202431_s_at 0.51 0.0002 >0.05 >0.05 <1.00 >0.05 >0.05 <1.00 >0.05 >0.05 1.37 >0.05 >0.05 <1.00 SLC2A5 204429_s_at 0.47 0.0003 >0.05 >0.05 <1.00 0.03 >0.05 1.01 0.02 0.002 <1.00 >0.05 >0.05 <1.00 VCAM1 203886_s_at 0.43 0.0007 0.011 0.010 <1.00 >0.05 >0.05 <1.00 0.01 0.048 <1.00 >0.05 >0.05 <1.00
aNo suggestive results were found for RELB genotypes (8 SNPs) and any phenotype. HapMap data was used for association testing; GAW15 data
was used for linkage analysis.
Table 3: Association analysis of NFKB1 using HapMap dataa
Phenotype SNP p-Value Haplotype p-Value
BCL2A1 rs17032779 0.035 rs17032779-rs230519-rs93059 0.040
CD44 rs230506 0.034 rs230506-rs230505-rs230504 0.009
rs3774934 0.034 rs3774933-rs3774934-rs4647972 0.037
CD80 rs4648091 0.025 rs4648090-rs4648091-rs4648095 0.049
rs4648134 0.025 rs4648133-rs4648134-rs4648135 0.017
FAS rs4648134 0.032 ---
---ICAM1 rs4648134 0.032 rs4648133-rs4648134-rs4648135 0.050
IRF1 rs1598859 0.032 rs1610152-rs1598859-rs3774956 0.040
rs3774959 0.032 rs3821958-rs1020759-rs3774959 0.040
VCAM1 rs7679591 0.011 rs230528-rs7679591-rs230526 0.040
rs17032779 0.014 rs230521-rs230520-rs17032779 0.047
rs4648018 0.014 rs4648016-rs4648018-rs230500 0.046
rs4648069 0.014 rs4648055-rs4648068-rs4608069 0.049
rs4648091 0.014 rs4648090-rs4648091-rs4648095 0.010
rs4648134 0.014 rs4648133-rs4648134-rs4648135 0.050
rs10489114 0.014 rs3774959-rs10489114-rs7377680 0.034
rs4648015 0.014 rs230496-rs4648015-rs230498 0.041
rs4648016 0.014 rs230498-rs4648016-rs4648018 0.046
rs4648043 0.014 rs3774956-rs4648043-rs3821958 0.037
aFamily-based association tests suggested SNP rs4648136 and haplotype rs4648134-rs4648135-rs4648136 associated with CD80, FAS and ICAM1
phenotypes.
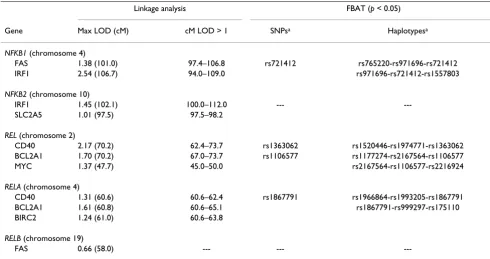
Table 2: Linkage analysis and family-based association tests (FBAT) using GAW15 data
Linkage analysis FBAT (p < 0.05)
Gene Max LOD (cM) cM LOD > 1 SNPsa Haplotypesa
NFKB1 (chromosome 4)
FAS 1.38 (101.0) 97.4–106.8 rs721412 rs765220-rs971696-rs721412
IRF1 2.54 (106.7) 94.0–109.0 rs971696-rs721412-rs1557803
NFKB2 (chromosome 10)
IRF1 1.45 (102.1) 100.0–112.0 ---
---SLC2A5 1.01 (97.5) 97.5–98.2
REL (chromosome 2)
CD40 2.17 (70.2) 62.4–73.7 rs1363062 rs1520446-rs1974771-rs1363062
BCL2A1 1.70 (70.2) 67.0–73.7 rs1106577 rs1177274-rs2167564-rs1106577
MYC 1.37 (47.7) 45.0–50.0 rs2167564-rs1106577-rs2216924
RELA (chromosome 4)
CD40 1.31 (60.6) 60.6–62.4 rs1867791 rs1966864-rs1993205-rs1867791
BCL2A1 1.61 (60.8) 60.6–65.1 rs1867791-rs999297-rs175110
BIRC2 1.24 (61.0) 60.6–63.8
RELB (chromosome 19)
FAS 0.66 (58.0) --- ---
Publish with BioMed Central and every scientist can read your work free of charge "BioMed Central will be the most significant development for disseminating the results of biomedical researc h in our lifetime."
Sir Paul Nurse, Cancer Research UK
Your research papers will be:
available free of charge to the entire biomedical community
peer reviewed and published immediately upon acceptance
cited in PubMed and archived on PubMed Central
yours — you keep the copyright
Submit your manuscript here:
http://www.biomedcentral.com/info/publishing_adv.asp
BioMedcentral
Competing interests
The author(s) declare that they have no competing inter-ests.
Acknowledgements
We gratefully acknowledge the support provided by NIH/NCI grant R25 CA92049 and by the Fraternal Order of Eagles Cancer Research Fund.
This article has been published as part of BMC Proceedings Volume 1 Sup-plement 1, 2007: Genetic Analysis Workshop 15: Gene Expression Analysis and Approaches to Detecting Multiple Functional Loci. The full contents of the supplement are available online at http://www.biomedcentral.com/ 1753-6561/1?issue=S1.
References
1. Pahl HL: Activators and target genes of Rel/NF-κB transcrip-tion factors. Oncogene 1999, 18:6853-6866.
2. Kutuk O, Basaga H: Inflammation meets oxidation: NF-κB as a mediator of initial lesion development in atherosclerosis. Trends Mol Med 2003, 9:549-557.
3. Hayden MS, Ghosh S: Signaling to NF-κB. Genes Dev 2004,
18:2195-2224.
4. Morley M, Molony CM, Weber TM, Devlin JL, Ewens KG, Spielman RS, Cheung VG: Genetic analysis of genome-wide variation in human gene expression. Nature 2004, 430:743-747.
5. Altshuler D, Brooks LD, Chakravarti A, Collins FS, Daly MJ, Donnelly P: International HapMap Consortium: A haplotype map of the human genome. Nature 2005, 437:1299-1320.
6. International HapMap Consortium Database [http:// www.hapmap.org/downloads/samples_individuals/
pedinfo2sample_CEU.txt]
7. Online catalogs [http://bioinfo.lifl.fr/NF-KB/http://people.bu.edu/ gilmore/nf-kb/index.html]
8. Schaid DJ, Rowland CM, Tines DE, Jacobson RM, Poland GA: Score tests for association between traits and haplotypes when linkage phase is ambiguous. Am J Hum Genet 2002, 70:425-434. 9. de Andrade M, Atkinson EJ, Lunde EM, Amos CI, Chen J: Estimating
Genetic Components of Variance in Family Studies using the
Multic Routines. Technical Report Series No 78. Rochester, Minnesota: Department of Health Science Research, Mayo Clinic; 2006. 10. Steen KV, Laird NM: Family-Based Association Tests and the
FBAT-toolkit. User Manual. [http://www.biostat.harvard.edu/ ~fbat/manual.mar4.htm].
Table 4: Association analysis of REL using HapMap dataa
Phenotype SNP p-Value Haplotype p-Value
CD40 rs13422089 0.028 rs6545835-rs10208155-rs13422089 0.070
IL15 rs842648 0.038 rs13422089-rs842648-rs13022703 0.050
IRF1 rs842644 0.010 rs842644-rs6545836-rs10193964 0.050
JUNB rs6545835 0.047 rs6545835-rs10208155-rs13422089 0.050
rs10208155 0.047 ---
---rs13422089 0.008 rs13422089-rs842648-rs13022703 0.048
rs10185028 0.047 rs10185028-rs842647-rs842644 0.027
SLC2A5 rs6545835 0.019 rs6545835-rs10208155-rs13422089 0.020
rs10208155 0.019 rs6545835-rs10208155-rs13422089 0.020
rs13422089 0.035 rs6545835-rs10208155-rs13422089 0.020
rs10185028 0.019 rs10185028-rs842647-rs842644 0.004
rs842644 0.047 rs10185028-rs842647-rs842644 0.004
rs6545836 0.019 rs842647-rs842644-rs6545836 0.004
rs10193964 0.019 rs842644-rs6545836-rs10193964 0.002
VCAM1 rs842644 0.010 rs842644-rs6545836-rs10193964 0.048