Although the neonatal mortality rate in South Africa (SA) has remained stagnant at 12 deaths per 1 000 live births, the infant and under-5 mortality rates have significantly declined since peaking in 2003. Policy changes that have influenced this decline include policies to prevent vertical HIV transmission, earlier treatment of children living with HIV, expanded immunisation policies, strengthening breastfeeding practices, and health policies to contain tobacco and sugar use. The Sustainable Development Goals (2016 - 2030) have shifted the focus from keeping children alive, as expressed in the Millennium Development Goals (1990 - 2015), to achieving optimal health through the ‘Survive, thrive and transform’ global agenda. This paper focuses on important remaining causes of childhood mortality and morbidity in SA, specifically respiratory illness, environmental pollution, tuberculosis, malnutrition and vaccine-preventable conditions. The monitoring of maternal and child health (MCH) outcomes is crucial, and has improved in SA through both the District Health Information and Civil Registration and Vital Statistics systems, although gaps remain. Intermittent surveys and research augment the routinely collected data. However, availability and use of local data to inform quality and effectiveness of care is critical, and this requires ownership at the collection point to facilitate local redress. Potential game changers to improve MCH outcomes include mobile health and community-based interventions. In SA, improved MCH remains a crucial factor for human capital development. There is a pressing need to focus beyond childhood mortality and to ensure that each child thrives.
S Afr Med J 2019;109(11 Suppl 1):83-90. https://doi.org/10.7196/SAMJ.2019.v109i11b.14301
Neonatal, infant and child health in South Africa:
Reflecting on the past towards a better future
A Goga,1-3 PhD; U D Feucht,2,4-6 PhD; H J Zar,7,8 PhD; A Vanker,7,8 PhD; C S Wiysonge,9 PhD; N McKerrow,10,11 MMed;
C Y Wright,12,13 PhD; M Loveday,1,14 PhD; W Odendaal,1,15 MA; V Ramokolo,1 PhD; T Ramraj,1 MPH; L Bamford,16,17 PhD; R J Green,2 DSc,
Y Pillay,18 PhD; N Nannan,19 PhD
1 Health Systems Research Unit, South African Medical Research Council, Pretoria, South Africa
2 Department of Paediatrics and Child Health, Faculty of Health Sciences, University of Pretoria, South Africa 3 HIV Prevention Research Unit, South African Medical Research Council, Pretoria, South Africa
4 Tshwane District Health Services, Gauteng Department of Health, Pretoria, South Africa
5 Research Centre for Maternal, Fetal, Newborn and Child Health Care Strategies, Faculty of Health Sciences, University of Pretoria, South Africa 6 Maternal and Infant Health Care Strategies Research Unit, South African Medical Research Council, Pretoria, South Africa
7 Department of Paediatrics and Child Heath, Faculty of Health Sciences, University of Cape Town and Red Cross War Memorial Children’s Hospital,
Cape Town, South Africa
8 SAMRC Unit on Child and Adolescent Health, University of Cape Town, Cape Town, South Africa 9 Cochrane South Africa, South African Medical Research Council, Cape Town, South Africa
10 Paediatrics and Child Health, KwaZulu-Natal Department of Health, Pietermaritzburg, South Africa
11 Department of Paediatrics and Child Health, Nelson R Mandela School of Medicine, University of KwaZulu-Natal, Durban, South Africa 12 Environment and Health Research Unit, South African Medical Research Council, Pretoria, South Africa
13 Department of Geography, Geoinformatics and Meteorology, Faculty of Natural and Agricultural Sciences, University of Pretoria, South Africa 14 Centre for the AIDS Programme of Research in South Africa, Nelson R Mandela School of Medicine, University of KwaZulu-Natal, Durban, South Africa 15 Department of Psychiatry, Faculty of Medicine and Health Sciences, Stellenbosch University, Cape Town, South Africa
16 Child, Youth, and School Health Chief Directorate, National Department of Health, Pretoria, South Africa 17 School of Health Systems and Public Health, University of Pretoria, South Africa
18 Strategic Health Programmes, National Department of Health, Pretoria, South Africa
19 Burden of Disease Research Unit, South African Medical Research Council, Cape Town, South Africa
Corresponding author: A Goga ([email protected])
The South African Medical Research Council (SAMRC) has had a pivotal role in monitoring maternal, neonatal and under-5 mortality rates in South Africa (SA), serving as a key information source for the National Department of Health (NDoH).[1] In 2009, it was projected
that 95% coverage of basic neonatal care could save 11 500 infants’ lives in SA.[2] In 2014, modelling estimated that 15 key maternal and
child interventions, including labour and delivery management, handwashing, early antenatal HIV treatment and preventing vertical HIV transmission, could save an additional 9 000 newborns and children annually by 2015, reducing maternal mortality to 153 deaths per 100 000 live births and child mortality to 34 deaths per 1 000
live births.[3] At 95% coverage, promoting breastfeeding was the top
intervention.[3] By 2015, the NDoH had adopted all 15 interventions.[3]
The 2017 SAMRC Rapid Mortality Surveillance study reported that the under-5 mortality rate (U5MR) declined from 41 to 32 per 1 000 live births between 2012 and 2017, and that the infant mortality rate (IMR) declined from 27 to 23 per 1 000 live births (Table 1).[4] The
neonatal mortality rate (NMR) remained stagnant at 12 per 1 000 live births, while the maternal mortality ratio decreased from 200 to 134 per 100 000 live births.[4] Consequently, by 2017 the U5MR
the burden of complications from preterm deliveries, particularly the increasing delivery of infants under 1 000 g.[5]
Changes in these indicators may be attributed, in part, to improved policies to prevent vertical HIV transmission (PMTCT), earlier treatment of children living with HIV, expanded immunisation policies, the introduction of combined and new childhood vaccines, and withdrawing the provision of free commercial infant formula for HIV-exposed infants through the PMTCT programme (Fig. 1).[6-10] Many of these policy
changes were influenced by research led by or associated with SAMRC scientists,[7,11-18] in a
supportive context where government sought to ameliorate the social determinants of health, regulate sugar consumption through a sugar tax and entrench the sin tax on named alcohol and tobacco products.[19,20]
Prompted by the realisation that the lives of future generations depend on survival and optimal health, the global child health agenda has shifted to the ‘Every Woman Every Child’ (EWEC) strategy, which includes the objectives ‘survive, thrive and transform’.[21-23]
This vision is captured by the United Nations’ Sustainable Development Goals (SDGs).[24]
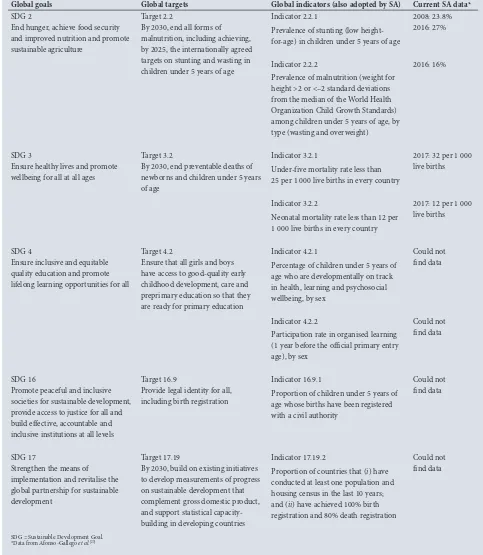
Table 2 lists the SDGs related to child health, their associated indicators and current SA data.[25] SDG 3 aims to reduce the U5MR to
<25 per 1 000 live births in all countries by 2030.[1]
The 2018 global EWEC monitoring report highlights limited progress in reducing neonatal mortality, slow progress in redressing gender inequalities and increasing humanitarian crises as the main stumbling blocks to achieving the 2030 targets.[22] It calls for the introduction of a
nurturing framework that emphasises early childhood development during the first 1 000 days, responsive caregiving, a life-course approach to optimise health, evidence-based innovations to improve women’s, children’s and adolescents’ health, universal health coverage, multisectoral action and collaboration.[22]
This paper reviews the causes of neonatal, infant and under-5 mortality and morbidity in SA, with specific focus on remaining
causes, including respiratory illness, environmental pollution, tuberculosis (TB), malnutrition and vaccine-preventable conditions. We also discuss systems to monitor health outcomes of neonates, infants and children, and potential game changers to improve health outcomes for these groups.
Causes of under-five
mortality
Good-quality data to measure cause-specific under-five mortality are sparse. The second National Burden of Diseases study (NBDS 2),[26]
[image:2.595.160.532.103.570.2]which triangulated and reviewed data from several sources, illustrates that the causes of under-5 mortality changed considerably between 2000 and 2012 (Fig. 2). Between 2000 and 2012, the contribution of HIV/ AIDS reduced from 37% to 19%, but that of pneumonia increased from 9% to 12% and neonatal deaths increased from 21% to 27%, with conditions associated with prematurity, birth asphyxia and severe infections being the main contributors. TB accounted for 1 - 2% of under-5 mortality throughout the period. These results differ from those Table 1. Key maternal and child health indicators (2012 - 2017)
Indicator 2012 (Baseline) 2013 2014 2015 2016 2017
Under-five mortality rate, per 1 000 live births 41 41 40 37 34 32
Infant mortality rate, per 1 000 live births 27 28 28 27 25 23
Neonatal mortality rate, per 1 000 live births 12 11 12 12 12 12
Maternal mortality ratio, per 100 000 live births 200 165 154 164 152 134
Source: Dorrington et al.[4]
2001-2011: Provision of free commercial infant formula to prevent MTCT through BF 1999: Introduction of
Haemophilus influenzae
type B vaccine 2000: Conversion from percutaneous to intradermal route for BCG 2001: Introduction of sdNVP to prevent MTCT 2002: Scale-up of sdNVP nationally
2002: Neonatal tetanus eliminated
2004: Start of paediatric ART programme 2006: South Africa declared polio-free
2008: Maternal AZT for MTCT from 28 weeks with sdNVP, ART if CD4 <200; infant sdNVP and 7-days AZT 2009: Introduction of pneumococcal vaccine and rotavirus vaccine. Switch to acellular pertussis with introduction of combined (pentavalent) vaccine. 2010: Maternal AZT from 14 weeks with sdNVP, ART if CD4 <350 cells/uL; infant NVP through BF. All HIV-positive children <1 year eligible for ART
2013: ART for pregnant and BF women through BF with 6-weeks infant NVP
2015: Lifelong ART for pregnant and BF women with 6-weeks infant NVP 2015: Introduction of combined (hexavalent) vaccine programme 2018: Introduction of sugar tax 90
80 70 60 50 40 30 20 10 0
D
ea
ths per 1 000 liv
e bir
ths
2000 2001 2002 2003 2004 2005 2006 2007 2008 2009 2010 2011 2012 2013 2014 2015 2016 Year
Under-five
Neonatal Infant
Fig. 1. Data on mortality or child mortality indicators from the 2017 Rapid Mortality Surveillance report.[4] Major intervention milestones are indicated. (BCG = bacille Calmette–Guérin;
in the third triennial report of the Committee on Morbidity and Mortality in Children Under Five Years (COMMIC),[27] which
uses vital registration data from Statistics South Africa to monitor U5MR. However, misclassification of AIDS deaths and other issues related to poor-quality data, such as the proportion of ill-defined deaths, compromises the quality of mortality data. According to that report, the leading contributors to under-5 mortality in 2015 were neonatal causes, diarrhoea and pneumonia or lower respiratory tract infections (LRTIs) (Fig. 3).[1,27]
Addressing major causes of under-5
morbidity and mortality
It is our contention that the following issues will have a key role in maintaining the momentum with regard to the decline in maternal, under-five and infant mortality and tackling the stagnant NMR.
Respiratory diseases in children
[image:3.595.63.546.116.671.2]LRTIs – predominantly pneumonia – remain a major cause of morbidity and mortality in children under 5 years of age in low- Table 2. Sustainable Development Goals and associated targets and indicators of direct relevance to children under 5 years of age
Global goals Global targets Global indicators (also adopted by SA) Current SA data*
SDG 2
End hunger, achieve food security and improved nutrition and promote sustainable agriculture
Target 2.2
By 2030, end all forms of malnutrition, including achieving, by 2025, the internationally agreed targets on stunting and wasting in children under 5 years of age
Indicator 2.2.1
Prevalence of stunting (low height-for-age) in children under 5 years of age
2008: 23.8% 2016: 27%
Indicator 2.2.2
Prevalence of malnutrition (weight for height >2 or <–2 standard deviations from the median of the World Health Organization Child Growth Standards) among children under 5 years of age, by type (wasting and overweight)
2016: 16%
SDG 3
Ensure healthy lives and promote wellbeing for all at all ages
Target 3.2
By 2030, end preventable deaths of newborns and children under 5 years of age
Indicator 3.2.1
Under-five mortality rate less than 25 per 1 000 live births in every country
2017: 32 per 1 000 live births
Indicator 3.2.2
Neonatal mortality rate less than 12 per 1 000 live births in every country
2017: 12 per 1 000 live births
SDG 4
Ensure inclusive and equitable quality education and promote lifelong learning opportunities for all
Target 4.2
Ensure that all girls and boys have access to good-quality early childhood development, care and preprimary education so that they are ready for primary education
Indicator 4.2.1
Percentage of children under 5 years of age who are developmentally on track in health, learning and psychosocial wellbeing, by sex
Could not find data
Indicator 4.2.2
Participation rate in organised learning (1 year before the official primary entry age), by sex
Could not find data
SDG 16
Promote peaceful and inclusive societies for sustainable development, provide access to justice for all and build effective, accountable and inclusive institutions at all levels
Target 16.9
Provide legal identity for all, including birth registration
Indicator 16.9.1
Proportion of children under 5 years of age whose births have been registered with a civil authority
Could not find data
SDG 17
Strengthen the means of implementation and revitalise the global partnership for sustainable development
Target 17.19
By 2030, build on existing initiatives to develop measurements of progress on sustainable development that complement gross domestic product, and support statistical capacity-building in developing countries
Indicator 17.19.2
Proportion of countries that (i) have conducted at least one population and housing census in the last 10 years; and (ii) have achieved 100% birth registration and 80% death registration
Could not find data
and middle-income countries (LMICs), including SA, despite high immunisation coverage and a decreasing prevalence of paediatric HIV infection and severe malnutrition.[28] Notwithstanding this, better
immunisation (including pneumococcal conjugate and Haemophilus influenzae type B vaccines), HIV antiretroviral treatment and prevention programmes, and improved socioeconomic conditions have substantially reduced pneumonia incidence, improved outcomes and affected pneumonia aetiology.[29] Data from the Drakenstein
Child Health study, a birth cohort study in a peri-urban area in Cape Town, showed that pneumonia was multipathogenic, resulting from the interaction of several organisms: respiratory syncytial virus (RSV) predominated as a viral pathogen.[28] In addition, a
hospital-based study in Pretoria found that most LRTIs in children have a combination of viruses and bacteria as aetiological agents. However, viruses – most often human rhinovirus – were commonly isolated from healthy children; RSV was seldom isolated from HIV-infected children.[30] Although pneumonia-associated mortality was very
low in the Drakenstein study, early-life pneumonia was associated with impaired lung function in early childhood, possibly setting a trajectory for the development of lifelong respiratory or other non-Ill-defined
15%
Neonatal disorder
30%
GE 10%
Pneumonia 10% Non-natural
8% Congenital
abnormality 6% Other viral disease 2%
HIV 1% TB 1%
Other 13%
[image:4.595.49.533.97.528.2]Malnutrition 4%
Fig. 3. Causes of death in children under 5 years of age in South Africa, 2015. Source: National Department of Health[27] (GE = gastroenteritis;
TB = tuberculosis.)
Preterm 9%
Birth asphyxia 5%
Severe infections 2% Other neonatal
4%
Tuberculosis 1% Diarrhoea
12% Pneumonia
7% Congenital
1%
Other 9%
Injuries 3%
Preterm 11%
Birth asphyxia 6%
Severe infections 4%
Other neonatal 6%
Tuberculosis 2% Diarrhoea
16% Pneumonia
12% Congenital
3% Other
15%
Injuries 6% Preterm
9%
Birth asphyxia 5%
Severe infections 2% Other neonatal
5%
Tuberculosis 1% Diarrhoea
15% Pneumonia
9% Congenital
2%
Other 11%
Injuries 4%
Preterm 10%
Birth asphyxia 5%
Other neonatal
4%
Tuberculosis 2% Diarrhoea
18% Pneumonia
11% Congenital
2% Other
13%
Injuries 4%
2005
(N=83 634)
2010
(N=60 506)
2012
(N=47 759)
2000
(N=67 955)
Neonatal deaths 21%
Neonatal deaths 20%
Neonatal deaths
22% Neonatal deaths 27%
HIV/AIDS 47%
HIV/AIDS 19% HIV/AIDS
37%
HIV/AIDS 28%
[image:4.595.48.282.567.747.2]Severe infections 3%
communicable diseases.[31] In addition, although risk factors such as
poor nutrition, lack of breastfeeding or exposure to tobacco smoke (in utero or postnatal) are known to increase the risk of pneumonia, infant HIV-exposure (i.e. uninfected infants born to HIV positive women) has emerged as an important risk factor for pneumonia in infancy.[32] Consequently, reducing infant HIV exposure by
reducing maternal HIV prevalence, improving nutrition, increasing breastfeeding and reducing tobacco smoke exposure could reduce morbidity and mortality from respiratory disease.
Environmental pollution, including air, water and
sanitation
Although the percentage of households living without any sanitation facilities declined from 12.6% in 2002 to 3.1% in 2017,[33] thousands
of children still face environmental threats daily, at home or at school.[34] Approximately 125 in 100 000 deaths in SA children under
5 years of age are associated with environmental factors;[35] however,
this rate is likely an underestimate owing to a lack of reliable data. Water collected from a communal tap and stored in an open bucket has been found to have levels of Escherichia coli far exceeding WHO standards.[36]
Air pollution is increasingly recognised as a significant risk factor for ill health, with more than 90% of children worldwide breathing in polluted air.[37] Although SA has experienced major societal and
political changes over the past two decades, the majority of the population still live in suboptimal environmental circumstances, with significant exposure to both indoor and outdoor air pollution,[38,39]
compounded by a high prevalence of primary and secondary tobacco exposure.[40,41] Environmental exposures negatively affect
lung health in utero and have been linked to impaired lung development and disturbed development of the immune system, with subsequent decreased lung function in infancy and childhood, increased respiratory symptoms and the development of childhood asthma.[42] Several potential mechanisms for the association of
pollution with asthma have been suggested, with one hypothesis referring to the high levels of particulate matter degrading the ozone layer.[41,43] Air pollution may also contribute to the development of
acute and chronic respiratory symptoms by disrupting lung defence mechanisms and the lung microbiome.[42,44] A novel finding in the
Drakenstein study was that household exposure to toluene, a volatile organic compound that possibly originates from paraffin burners used for cooking, was associated with hypoxia and hospitalisation for pneumonia, illustrating the dangers of alternative fuels.[45]
It is thus clear that in SA, safe housing and sanitation, clean, adequate water supply, and clean air are imperative for children to thrive and lead healthy, economically productive adult lives.
Tuberculosis
SA has a high childhood TB burden, with an estimated 38 000 cases of TB in children <15 years in 2017 representing 12% of the country’s TB burden.[46] There is no agreement on the proportion of
the U5MR attributed to TB, with estimates ranging between 1.6% and 10%;[47] TB diagnosis in children is challenging, given the nonspecific
symptoms (including presentation as acute pneumonia) and the lack of microbiological confirmation.[48,49] Untreated childhood TB infection
can rapidly progress to serious disease and death. Although the proportion of children dying from TB in SA has decreased significantly over the last decade, TB is still the fourth most common cause of mortality in this age group.[50] In addition, as HIV disproportionately
affects women of reproductive age, the corresponding increase in the number of TB-HIV co-infections in this population increases TB exposure in young, vulnerable children, increasing TB rates in this
age group.[51] TB-HIV co-infection complicates TB care: TB diagnosis
is difficult, as other HIV-associated respiratory illnesses may mimic TB, disease progression is more rapid, and concurrent use of TB and HIV medication has many potential side-effects or interactions.[52,53]
Pulmonary TB may also be associated with the development of chronic respiratory disease into adulthood. Prevention of childhood TB is therefore important. Vaccination with bacille Calmette-Guérin (BCG) reduces the risk of disseminated disease or TB meningitis in young children, but offers no consistent protection against pulmonary disease.[54] Currently the national Expanded Programme
of Immunisation (EPI) offers all infants a single dose of BCG vaccine after birth,[55] and national coverage of BCG is >90%.[56] However, if
the mother had TB during pregnancy and subsequently had a negative TB screen, the infant should receive 6 weeks of isoniazid prophylaxis followed by BCG vaccination.[55] According to current national policy,
any HIV-infected child, irrespective of age, and children under 5 years of age who have household contact with TB, must receive isoniazid prophylaxis.[55] The rising number of children infected with
drug-resistant TB (DR-TB) further complicates TB prevention and management in SA.[57] Besides the challenge of diagnosing DR-TB,
its treatment in childhood is challenging owing to the need for expanded treatment regimens and a lack of paediatric formulations. New and repurposed drugs have now been included in DR-TB treatment regimens in SA.[58,59] These, implemented together, may
reduce TB-related mortality and morbidity.
Malnutrition
In 2012, the World Health Assembly (WHA) committed to reducing childhood stunting, wasting and overweight, and increasing the rate of exclusive breastfeeding.[60] The 2016 South African Demographic
and Health Survey (SADHS) documented the prevalence of stunting, wasting, underweight-for-age and overweight in under-fives as 27.4%, 2.5%, 6% and 13.3%, respectively.[56] Stunting prevalence
has not changed from the 2003 survey; however, wasting decreased from 5% to 3% and underweight-for-age increased from 11.5% to 13%.[56,61] Although breastfeeding was initiated within 1 hour of
delivery in two-thirds of children, only 32% of children under the age of 6 months were exclusively breastfed, and only 23% of children between 6 and 23 months were fed a minimum acceptable diet.[56]
Although these percentages appear low, the exclusive breastfeeding (EBF) prevalence in 2016 represents an increase from the 2003 estimate of 8.3%.[62] Analysis of three SAMRC-led nationally representative
surveys between 2010 and 2013, shows a population-wide effect of increasing EBF during this time (Jackson et al., under review). Notwithstanding this improvement, data from the hospital-based Child Healthcare Problem Identification Programme show that ~31% of children who died in hospital over the period 2012-2013 were malnourished.[63] A double burden of malnutrition in children is
emerging, with both under- and overnutrition associated with short- and long-term disease (such as cardiovascular disease) in adults.[64,65]
Investing in promoting and supporting exclusive breastfeeding for the first 6 months and continued breastfeeding thereafter will be a key intervention to reduce malnutrition.
Vaccine-preventable conditions and immunisation gaps
Despite the unparalleled success of immunisation in the control of vaccine-preventable diseases, immunisation coverage is suboptimal in SA.[56,66] In the 2016 SADHS, only 57.7% of children
about these estimates, given that they rely on self-report and stem from small sample sizes. In May 2012, the WHA endorsed the Global Vaccine Action Plan and committed to achieving at least 90% national coverage with three doses of diphtheria-tetanus-pertussis vaccines (DTP3) in children under 1 year of age by 2015.[67] SA
had set a goal of achieving at least 92% national DTP3 coverage by 2017.[68] According to the 2016 SADHS, uptake of the 14-week
vaccine was 82% and 77.4% among children aged 12 - 23 months and 24 - 35 months, respectively; uptake of measles immunisation was 64.6% among children aged 12 - 23 months and 62.4% among children aged 24 - 35 months.[56] The low childhood immunisation
coverage is a serious concern and may see the country battle the re-emergence of previously controlled infectious conditions, including diphtheria, pertussis and measles.[69,70] However, the introduction of
pneumococcal conjugate and rotavirus vaccines into the national EPI programme has been an important advance in reducing childhood mortality, pneumonia, diarrhoea and hospitalisation. A nationally representative immunisation survey is underway to obtain valid estimates of immunisation coverage in SA.
Monitoring the under-5 mortality
rate: Current gaps
A high-quality civil registration and vital statistics (CRVS) system can collect data on mortality rates among the neonatal, infant and under-five population, causes of death, teenage fertility rates, low birthweight rates and the variations between geographical regions.[71] Such CRVS
systems constitute a continuous source of monitoring births and deaths, providing critical demographic and health information that could form the backbone of the public health surveillance system.[71]
However, the utility of CRVS data depends on the quality of the information, and CRVS data do not provide information on coverage of services.[72] SA has achieved commendable improvement in the
completeness of birth and death registration since the turn of the century and since 2011 data from the National Population Register have been used to calculate key mortality indicators.[73] Nationally,
these data can be used with minimal adjustment for under-reporting; however, under-reporting, especially in rural, underserved areas, prohibits valid comparison at subnational level. Monitoring mortality reductions at subnational level will be possible only if adequate CRVS reporting is assured in all parts of the country, including underserved areas. Central to achieving the SDG targets is the importance of monitoring equity[74] by assessing CRVS systems at a subnational
level, which is currently a challenge in SA. Demographic and health surveys,[75] of which SA has conducted three, provide empirical data,
particularly with regard to coverage of specific maternal and child health programmes. However, as mortality improves, subnational mortality estimates from surveys become less accurate. The District Health Information System collects and collates health facility data on an array of health indicators, which could be used to monitor mortality and improve programmes at the point of service delivery, if data quality is improved.[76] District-level data on key child health
indicators are published annually in the District Health Barometer, an annual SA publication on health districts’ performance.
A new approach to monitoring
neonatal, infant and child health
Previous efforts to monitor neonatal, infant and child health concentrated on progress towards achieving the Millennium Development Goals, with limited attention to child wellbeing beyond survival and almost no consideration of the needs of older children or adolescents.[77] The EWEC agenda[24] created a new focus for
monitoring child health, using a life-course approach, to measure
the three broad concepts of ‘survive’, ‘thrive’ and ‘transform’[23] among
children over the first two decades of life. Such a focus should explore adolescent mortality, child and adolescent development and wellbeing, and the quality and effectiveness of care. This requires prioritised indicators and accountability at the collection point to improve the quality of data and to facilitate review and redress at the local level. Discussions in this regard are currently underway both locally and globally.
Possible game changers
Mobile health (mHealth) and community health worker
interventions
We conducted a preliminary search across five databases for systematic reviews (Cochrane Library, Centre for Research and Dissemination, PDQ, Pubmed (filtered for systematic reviews) and Turning Research into Practice) to identify game changers to improve maternal, neonatal and child health in LMICs. We focused on interventions that use platforms such as mHealth and community-based services. Although there is increasingly robust evidence for the effectiveness of these platforms, data from mHealth interventions implemented at scale are lacking.[78-84] An exception is the NDoH’s
MomConnect programme, which provides pregnant and postpartum women with health information via text messages twice a week, has a help desk for patient queries and serves as a platform for patient feedback to facilities.[85,86] It has reached approximately 63% of all
pregnant women attending their first antenatal appointment and covers over 95% of public health facilities in SA.[85] Although users
are overwhelmingly positive about the service,[87] research evaluating
its effectiveness on health outcomes for mother and baby still needs to be conducted.
We found three reviews about community-based services. Cogia et al.[88]
included five cluster randomised controlled trials (RCTs), assessed at low risk of bias, and concluded that various interventions by community healthcare workers during pregnancy, birth and the neonatal period significantly reduced neonatal mortality. The review by Lassi et al.,[89] in which 24 of the 26 studies were cluster RCTs,
concluded that training community-level healthcare workers on basic antenatal, natal and postnatal care, preventive newborn care and community mobilisation, significantly reduced maternal morbidity and neonatal and perinatal mortality. A modelling analysis to estimate the costs and effectiveness of interventions by community-based healthcare workers on child mortality found that nine interventions can prevent 8 891 deaths by 2030.[90] Handwashing with soap (21%)
accounts for the highest number of deaths prevented, followed by therapeutic feeding (19%) and oral rehydration therapy (16%). The top five interventions account for 77% of all deaths prevented. At scale, an estimated USD169.5 million (USD3 per capita) per year will be required to cover community health worker costs. Finally, it should be noted that a recent investment case report on such health workers in SA confirms the positive outcomes reported in systematic reviews: for example, modelling shows that a 10% increase in interventions by community-based health workers may avert 3 500 under-five deaths annually.[91] Although evidence for the effectiveness
of community-based services appears to be robust, more data at scale are needed to establish the effectiveness of mHealth interventions on neonatal, infant and under-5 health.
Approaches to quality improvement
The implementation of quality-improvement (QI) approaches has been shown to improve the provision of care and outcomes for maternal and neonatal health in Africa and Asia;[92] however, these
ELMA Philanthropies, Clinton Health Access Initiative, SAMRC, University of Pretoria-SAMRC Extramural Unit on Maternal and Infant Health Care Strategies and University of Limpopo Trust, the NDoH is currently embarking on the Mphatlalatsane project. This integrated QI project is being rolled out in 17 districts across the country and is linked explicitly to implementing the revised District Health Planning and Monitoring Framework. Three catchment areas situated around apex hospitals in four districts will receive intensified QI support. The project aims to optimise the way health systems and clinical care are organised and delivered for maternal and neonatal populations, and will contribute to an investment case to obtain funding for full national scale-up within 4 years. An evaluation will assess the effectiveness of the QI interventions on maternal and perinatal health outcomes and improvement in patients’ experience of care. A key component of QI interventions is leadership training and accountability, which have been identified as a key gap in service delivery.[2]
Conclusion
Although there have been remarkable reductions in infant and under-five mortality, NMRs have remained stagnant. Interventions to address the key causes of mortality, such as neonatal causes (27%), HIV/AIDS (19%), diarrhoea (16%) and pneumonia (12%), need to be tested and scaled-up. In addition, there is a pressing need to focus beyond childhood mortality to ensure that each child can thrive. In utero and early-life exposures have a direct effect on long-term child health. At the macro level, environmental conditions (air pollution, contaminated water and suboptimal sanitation) and access to better-quality diets need to improve, through legislation and enforcement of taxes such as sugar or tobacco tax. At the facility level, QI interventions to improve immunisation coverage and feeding practices and optimise systems for monitoring child health outcomes are needed. Furthermore, given the proven benefits of community-based health workers, their role in the health system needs to be formalised and supported, and mHealth interventions need to be implemented at scale with robust evaluation designs. Although our country’s achievements in the improvement of the CRVS system have been heralded internationally, remaining challenges are to further improve the quality and completeness of data to monitor child morbidity, mortality and long-term health.
Acknowledgements. The authors acknowledge the SAMRC for funding this publication.
Author contributions. As lead author, AG conceptualised the paper, managed all input and prepared the paper in final form. UDF and TR reviewed all drafts and provided editorial support. HJZ and AV contributed the section on respiratory disease and air pollution. CSW prepared the section on immunisation. NM wrote the section on monitoring and CYW was responsible for the section on environment and health. ML contributed the section on TB and WO wrote the section on game changers. VR wrote the section on malnutrition. NN contributed the tables and graphs on mortality trends, wrote the section on current gaps in monitoring the under-five mortality rate and contributed to all drafts. LB and RJG provided strategic inputs and contributed to all drafts and the final paper. All authors read and commented on earlier drafts and approved the final version.
Funding. AG, ML, CSW, CYW, WO, VR, NN and TR are employed by the SAMRC. HJZ runs a research unit that is partly funded by the SAMRC. Conflicts of interest. None.
1. Bamford LJ, McKerrow NH, Barron P, Aung Y. Child mortality in South Africa: Fewer deaths but better data are needed. S Afr Med J 2018;108(3a):S25-S32. https://doi.org/10.7196/SAMJ.2017.v108i3b.12779 2. Chopra M, Daviaud E, Pattinson R, Fonn S, Lawn JE. Saving the lives of South Africa’s mothers, babies, and children: Can the health system deliver? Lancet 2009;374(9692):835-846. https://doi.org/10.1016/ s0140-6736(09)61123-5
3. Chola L, Pillay Y, Barron P, Tugendhaft A, Kerber K, Hofman K. Cost and impact of scaling up interventions to save lives of mothers and children: Taking South Africa closer to MDGs 4 and 5. Glob Health Action 2015;8(1):27265. https://doi.org/10.3402%2Fgha.v8.27265
4. Dorrington R, Bradshaw D, Laubscher R, Nannan N. Rapid Mortality Surveillance Report 2017. Cape Town: South African Medical Research Council, 2019.
5. Ramokolo V, Mlaba T, Rhoda N, Kauchali S, Goga A. A landscape analysis on preterm birth in South Africa: Systemic gaps and solutions. South African Health Reviews (in press).
6. Dlamini NR, Majali P. The Expanded Programme on Immunisation in South Africa: A story yet to be told. S Afr Med J 2016;106(7):675. https://doi.org/10.7196/samj.2016.v106i7.10956
7. Goga AE, Dinh TH, Jackson DJ, et al. First population-level effectiveness evaluation of a national programme to prevent HIV transmission from mother to child, South Africa. J Epidemiol Community Health 2015;69:240-248. https://doi.org/10.1136/jech-2014-204535
8. National Department of Health. Guidelines for the Management of HIV in Children, 2010. https://sahivsoc. org/Files/Guidelines_for_Management_of_HIV_in_Children_2010.pdf (accessed 13 June 2019). 9. National Department of Health. National Consolidated Guidelines for the Prevention of Mother to
Child Transmission of HIV (PMTCT) and the Management of HIV in Children, Adolescents and Adults. Pretoria: NDoH, 2015. https://sahivsoc.org/Files/Consolidated%20ART%20guidelines%20_ Jan%202015.pdf (accessed 13 June 2019).
10. National Department of Health. The Tshwane Declaration of Support for Breastfeeding in South Africa. S Afr J Clin Nutr 2011;24(4):214.
11. Colvin M, Chopra M, Doherty T, et al. Operational effectiveness of single-dose nevirapine in the South African programme to prevent mother-to-child transmission of HIV. Bull World Health Organ 2007;85(6):466-473. https://doi.org/10.2471/BLT.06.033639
12. Goga A, Dinh T, Jackson D, et al. Population-level effectiveness of maternal antiretroviral treatment initiation before or during the first trimester and infant antiretroviral prophylaxis on early mother-to-child transmission of HIV, South Africa: Implications for eliminating MTCT. J Glob Health 2016;6(2):020405. https://doi.org/10.7189/jogh.06.020405
13. Goga AE, Doherty T, Jackson DJ, et al. Infant feeding practices at routine PMTCT sites, South Africa: Results of a prospective observational study amongst HIV exposed and unexposed infants – birth to 9 months. Int Breastfeeding J 2012;7(4). https://doi.org/10.1186/1746-4358-7-4
14. Jackson DJ, Chopra M, Doherty TM, et al. Operational effectiveness and 36 week HIV-freesurvival in the South African programme to prevent mother-to-child transmission of HIV-1. AIDS 2007;21(4):509-516. https://doi.org/10.1097/qad.0b013e32801424d2
15. Coutsoudis A, Goga AE, Rollins N, Coovadia HM, Child Health Group. Free formula milk for infants of HIV-infected women: Blessing or curse? Health Policy Plan 2002;17(2):154-160. https://doi. org/10.1093/heapol/17.2.154
16. Doherty T, Chopra M, Jackson D, Goga A, Colvin M, Persson L-A. Effectiveness of the WHO/UNICEF guidelines on infant feeding for HIV-positive women: Results from a prospective cohort study in South Africa. AIDS 2007;21(13):1791-1797. https://doi.org/10.1097/qad.0b013e32827b1462
17. Doherty T, Sanders D, Goga A, Jackson D. Implications of the new WHO Guidelines on HIV and infant feeding for child survival in South Africa. Bull World Health Organ 2011;89(1):62-67. https:// doi.org/10.2471/BLT.10.079798
18. Zar HJ, Madhi SA. Pneumococcal conjugate vaccine – advancing child health in South Africa. S Afr J Child Health 2008;2(3):94-95.
19. Pontsho P, Green A. Sugary drinks tax turns one year old – amid opposition. https://www. dailymaverick.co.za/article/2019-04-01-sugary-drinks-tax-turns-one-year-old-amid-opposition/ (accessed 13 June 2019).
20. South African Government News Agency. Sin taxes, levies increase. https://www.sanews.gov.za/south-africa/sin-taxes-levies-increase (accessed 13 June 2019).
21. The Children’s Institute. Survive, thrive and transform. Invest in children for sustainable development. Cape Town: The Children’s Institute, 2017. http://www.ci.uct.ac.za/sites/default/files/image_tool/ images/367/Child_Gauge/South_African_Child_Gauge_2017/Child_Gauge_2017_Poster.pdf (accessed 13 June 2019).
22. World Health Organization. Survive, Thrive, Transform – Global Strategy for Women’s, Children’s and Adolescents’ Health (2016 - 2030) – 2018 monitoring report: Current status and strategic priorities. Geneva: WHO, 2018.
23. United Nations. The Global Strategy for Women’s, Children’s and Adolescents’ Health (2016-2030): Survive, Thrive, Transform. https://www.who.int/life-course/partners/global-strategy/ globalstrategyreport2016-2030-lowres.pdf (accessed 13 July 2019).
24. United Nations. Goal 3: Ensure healthy lives and promote well-being for all at all ages. https://www. un.org/sustainabledevelopment/health/ (accessed 13 June 2019).
25. Afonso-Gallegos A, Bekele-Thomas N, Dayal H, et al. Implementing the sustainable development goals in South Africa: Challenges and opportunities. Pretoria: South African SDG Hub, 2018. https://www. sun.ac.za/si/en-za/Documents/Trending/Implementing%20the%20SDGs%20in%20SA_Digital.pdf (accessed 13 July 2019).
26. Msemburi W, Pillay-Van Wyk V, Dorrington R, et al. Second National Burden of Disease Study for South Africa: Cause-of-death profile for South Africa, 1997 - 2012. Cape Town: South African Medical Research Council, 2016. http://www.samrc.ac.za/reports/second-national-burden-disease-study-south-africa-cause-death-profile-report-1997-2012 (accessed 13 July 2019).
27. South African National Department of Health. Third Triennial Report of the Committee on Morbidity and Mortality in Children under 5 Years (COMMIC): 2017 - 2017. Pretoria: NDoH, 2017. 28. Zar HJ, Barnett W, Stadler A, Gardner-Lubbe S, Myer L, Nicol MP. Aetiology of childhood pneumonia
in a well vaccinated South African birth cohort: A nested case-control study of the Drakenstein Child Health Study. Lancet Respir Med 2016;4(6):463-472. https://doi.org/10.1016/S2213-600(16)00096-5 29. GBD 2015 HIV Collaborators. Estimates of global, regional, and national incidence, prevalence,
and mortality of HIV, 1980-2015: The Global Burden of Disease Study 2015. Lancet HIV 2016;3(8):e361-e87. https://doi.org/10.1016/S2352-3018(16)30087-X
30. Annamalay A, Abbbott S, Sikazwe C, et al. Respiratory viruses in young South African children with acute lower respiratory infections and interactions with HIV. J Clin Virol 2016;81:58-63. https://doi. org/10.1016/j.jcv.2016.06.002
31. Gray DM, Turkovic L, Willemse L, et al. Lung function in African infants in the Drakenstein Child Health Study. Impact of lower respiratory tract illness. Am J Respir Crit Care Med 2017;195(2):212-220. https://doi.org/10.1164/rccm.201601-0188oc
32. Le Roux DM, Myer L, Nicol MP, Zar HJ. Incidence and severity of childhood pneumonia in the first year of life in a South African birth cohort: The Drakenstein Child Health Study. Lancet Glob Health 2015;3(2):e95-e103. https://doi.org/10.1016/s2214-109x(14)70360-2
33. Statistics South Africa. World Toilet Day 2018. http://www.statssa.gov.za/?p=11757 (accessed 13 July 2019).
35. World Health Organization. Inheriting a sustainable world? Atlas on children’s health and the environment. Geneva: WHO, 2017. https://www.who.int/ceh/publications/inheriting-a-sustainable-world/en/ (accessed 13 June 2019).
36. Kapwata T, Mathee A, Le Roux WJ, Wright CY. Diarrhoeal disease in relation to possible household risk factors in a hot, rural setting. Int J Environ Res Public Health 2018;15(8):1665. https://doi. org/10.3390/ijerph15081665
37. World Health Organization. Air pollution and child health: Prescribing clean air. Summary. Geneva: WHO, 2018. https://www.who.int/ceh/publications/Advance-copy-Oct24_18150_Air-Pollution-and-Child-Health-merged-compressed.pdf (accessed 13 July 2019).
38. Statistics South Africa. The South African MPI: Creating a multidimensional poverty index using census data. Pretoria: StatsSA, 2014. http://www.statssa.gov.za/publications/Report-03-10-08/ Report-03-10-082014.pdf (accessed 13 June 2019).
39. Statistics South Africa. General household survey 2012. Statistical release P0318. Pretoria: StatsSA, 2013. 40. Swart D, Panday S. The Surveillance and Monitoring of Tobacco Control in South Africa. http://www. who.int/tobacco/training/success_stories/en/best_practices_south_africa_surveillance.pdf (accessed 13 June 2019).
41. Öberg M, Jaakkola MS, Woodward A, Peruga A, Prüss-Ustün A. Worldwide burden of disease from exposure to second-hand smoke: A retrospective analysis of data from 192 countries. Lancet 2011;377(9760):139-146. https://doi.org/10.1016/s0140-6736(10)61388-8
42. Korten I, Ramsey K, Latzin P. Air pollution during pregnancy and lung development in the child. Paediatric Respir Rev 2017;21:38-46. https://doi.org/10.1016/j.prrv.2016.08.008
43. Dockery D, Pope CA 3rd. Acute respiratory effects of particulate air pollution. Annu Rev Public Health 1994;15:107-132. https://doi.org/10.1146/annurev.publhealth.15.1.107
44. Gordon SB, Bruce NG, Grigg J, et al. Respiratory risks from household air pollution in low and middle income countries. Lancet Respir Med 2014;2(10):823-860. https://doi.org/10.1016/S2213-2600(14)70168-7
45. Vanker A, Barnett W, Workman L, et al. Early-life exposure to indoor air pollution or tobacco smoke and lower respiratory tract illness and wheezing in African infants: A longitudinal birth cohort study. Lancet Planet Health 2017;1(8):e328-e336. https://doi.org/10.1016/s2542-5196(17)30134-1 46. World Health Organization. Global Tuberculosis Report 2018. Geneva: WHO, 2018. https://www.who.
int/tb/publications/global_report/en/ (accessed 13 June 2019).
47. Nannan N, Groenewald P, Pillay-Van Wyk V, et al. Child mortality trends and causes of death in South Africa, 1997-2012, and the importance of a national burden of disease study. S Afr Med J 2019;109(7):480-485. https://doi.org/10.7196/SAMJ.2019.v109i7.13717
48. Marais BJ, Graham SM, Cotton MF, Beyers N. Diagnostic and management challenges for childhood tuberculosis in the era of HIV. J Infect Dis 2007;196(Suppl 1):S76-S85. https://doi.org/10.1086/518659 49. Nicol MP, Zar HJ. New specimens and laboratory diagnostics for childhood pulmonary TB: Progress
and prospects. Paediatr Respir Rev 2011;12(1):16-21. https://doi.org/10.1016/j.prrv.2010.09.008 50. Statistics South Africa. Mortality and causes of death in South Africa, 2015: Findings from death
notification. Pretoria: StatsSA, 2017. http://www.statssa.gov.za/publications/P03093/P030932015.pdf (accessed 13 June 2019).
51. Perez-Velez CM, Marais BJ. Tuberculosis in children. N Engl J Med 2012;367(4):348-361. https://doi. org/10.1056/NEJMra1008049
52. Marais BJ, Rabie H, Cotton MF. TB and HIV in children – advances in prevention and management. Paediatr Respir Rev 2011;12(1):39-45. https://doi.org/10.1016/j.prrv.2010.09.002
53. Hesseling AC, Cotton MF, Jennings T, et al. High incidence of tuberculosis among HIV-infected infants: Evidence from a South African population-based study highlights the need for improved tuberculosis control strategies. Clin Infect Dis 2009;48(1):108-114. https://doi.org/10.1086/595012 54. Trunz BB, Fine P, Dye C. Effect of BCG vaccination on childhood tuberculous meningitis and
miliary tuberculosis worldwide: A meta-analysis and assessment of cost-effectiveness. Lancet 2006;367(9517):1173-1180. https://doi.org/10.1016/s0140-6736(06)68507-3
55. National Department of Health. Guidelines for the Management of Tuberculosis in Children. Pretoria: NDoH, 2017.
56. National Department of Health, Statistics South Africa, South African Medical Research Council, ICF. South African Demographic and Health Survey 2016. Pretoria: NDoH, 2019.
57. Institute of Medicine. The emerging threat of drug-resistant tuberculosis in southern Africa: Global and local challenges and solutions. Summary of a Joint Workshop. National Academies Press: Washington DC, 2011. https://www.assaf.org.za/files/reports/proceedings/emergingthreatofdrugresistanttbinsouthafricaWH. PDF (accessed 13 June 2019).
58. National Department of Health. Interim Clinical Guidance for the Implementation of Injectable-Free Regimens for Rifampicin-Resistant Tuberculosis in Adults, Adolescents and Children. Pretoria: NDoH, 2018. http://www.tbonline.info/media/uploads/documents/dr_tb_clinical_guidelines_for_ rsa_september_2018.pdf (accessed 13 June 2019).
59. Sentinel Project. Statement on injectable free regimens for children under the age of 12 years with rifampicin-resistant tuberculosis. http://sentinel-project.org/wp-content/uploads/2018/07/ Recommendations-for-Injectible-Free-Regimens-in-Children-with-Rif-Resistant-TB.pdf (accessed 13 June 2019).
60. World Health Assembly. Sixty-fifth World Health Assembly. Resolutions and decisions. 2012. http:// apps.who.int/gb/DGNP/pdf_files/A65_REC1-en.pdf (accessed 13 July 2019).
61. National Department of Health, Medical Research Council, Demographic and Health Surveys Macro International. South African Demographic and Health Survey 1998. http://www.mrc.ac.za/bod/ dhsfin1.pdf (accessed 13 June 2019).
62. Department of Health, Medical Research Council, OrcMacro. South Africa Demographic and Health Survey 2003. Pretoria: DoH, 2007. https://dhsprogram.com/publications/publication-fr206-dhs-final-reports.cfm (accessed 13 June 2019).
63. Stephen CR, ed. Saving children: 2012-2013: An eighth survey of child healthcare in South Africa. Pretoria: Tshepesa Press, 2016.
64. Kimani-Murage E. Exploring the paradox: Double burden of malnutrition in rural South Africa. Glob Health Action 2013;6:19249. https://doi.org/10.3402/gha.v6i0.19249
65. Vorster H, Kruger A. Poverty, malnutrition, underdevelopment and cardiovascular disease: A South African perspective. Cardiovasc J Afr 2007;18(5):321–324.
66. Wiysonge C, Ngcobo N, Jeena P, et al. Advances in childhood immunisation in South Africa: Where to now? Programme managers’ views and evidence from systematic reviews. BMC Public Health 2012;12:578. https://doi.org/10.1186/1471-2458-12-578
67. World Health Organization. Global Vaccine Action Plan 2011 - 2020. 2011. https://www.who.int/ immunization/global_vaccine_action_plan/GVAP_doc_2011_2020/en/ (accessed 13 June 2019). 68. National Department of Health. Annual Report 2016/17. Pretoria: NDoH, 2017. https://www.gov.za/
sites/default/files/gcis_document/201710/national-department-health-annual-report-2016-2017a.pdf (accessed 13 June 2019).
69. National Institute for Communicable Diseases. Measles outbreaks and surveillance update in South Africa, January - September 2017. Communicable Diseases Communiqué 2017;16(9):1. http://www.nicd. ac.za/wp-content/uploads/2017/09/Measles-outbreak1.pdf (accessed 13 June 2019).
70. National Institute for Communicable Diseases. Diphtheria: Update on outbreak in KwaZulu-Natal Province. Communicable Diseases Communiqué 2015;14(7):1. http://nicd.ac.za/assets/files/Diptheria. pdf (accessed 13 June 2019).
71. Bradshaw D, Kielkowski D, Sitas F. New birth and death registration forms – a foundation for the future, a challenge for health workers? S Afr Med J 1998;88(8):971-974.
72. Mahapatra P, Shibuya K, Lopez AD, et al. Civil registration systems and vital statistics: Successes and missed opportunities. Lancet 2007;370(9599):1653-1663.https://doi.org/10.1016/s01406736(07)61308-7 73. Bradshaw D, Dorrington R, Laubscher R. Rapid Mortality Surveillance Report 2011. Cape Town: South African Medical Research Council, 2012. http://www.mrc.ac.za/sites/default/files/files/2017-05-26/ RapidMortality2011.pdf (accessed 13 July 2019).
74. Mikkelsen L, Phillips DE, AbouZahr C, et al. A global assessment of civil registration and vital statistics systems: Monitoring data quality and progress. Lancet 2015;386(10001):1395-1406. https://doi. org/10.1016/s0140-6736(15)60171-4
75. National Department of Health, Statistics South Africa, South African Medical Research Council, ICF. South Africa Demographic and Health Survey 2016. Pretoria and Rockville: NDoH, Stats SA, SAMRC, ICF, 2019.
76. Massyn N, Peer N, English R, Padarath A, Barron P, Day C, eds. District Health Barometer 2015/16. Durban: Health Systems Trust, 2016.
77. United Nations. The Millennium Development Goals Report 2015. New York: United Nations, 2015. https://www.un.org/millenniumgoals/2015_MDG_Report/pdf/MDG%202015%20rev%20(July%201). pdf (accessed 13 June 2019).
78. Amoakoh-Coleman M, Borgstein AB-J, Sondaal SF, et al. Effectiveness of mHealth interventions targeting health care workers to improve pregnancy outcomes in low- and middle-income countries: A systematic review. J Med Internet Res 2016;18(8):e226. https://doi.org/10.2196/jmir.5533
79. Colaci D, Chaudhri S, Vasan A. mHealth interventions in low-income countries to address maternal health: A systematic review. Ann Glob Health 2016;82(5):922-935. https://doi.org/10.1016/j. aogh.2016.09.001
80. Chen H, Chai Y, Dong L, Niu W, Zhang P. Effectiveness and appropriateness of mHealth interventions for maternal and child health: Systematic review. JMIR MHealth UHealth 2018;6(1):e7. https://doi. org/10.2196/mhealth.8998
81. Lee SH, Nurmatov UB, Nwaru BI, Mukherjee M, Grant L, Pagliari C. Effectiveness of mHealth interventions for maternal, newborn and child health in low- and middle-income countries: Systematic review and meta-analysis. J Glob Health 2016;6(1):010401. https://doi.org/10.7189/jogh.06.010401 82. Sondaal SFV, Browne JL, Amoakoh-Coleman M, et al. Assessing the effect of mHealth interventions in
improving maternal and neonatal care in low- and middle-income countries: A systematic review. PLoS One 2016;11(5):e0154664. https://doi.org/10.1371/journal.pone.0154664
83. Rivera-Romero O, Olmo A, Muñoz R, Stiefel P, Miranda ML, Beltrán LM. Mobile health solutions for hypertensive disorders in pregnancy: Scoping literature review. JMIR MHealth U Health 2018;6(5):e130. https://doi.org/10.2196/mhealth.9671
84. Feroz A, Perveen S, Aftab W. Role of mHealth applications for improving antenatal and postnatal care in low and middle income countries: A systematic review. BMC Health Serv Res 2017;17(1):704. https:// doi.org/10.1186/s12913-017-2664-7
85. Barron P, Peter J, LeFevre AE, et al. Mobile health messaging service and helpdesk for South African mothers (MomConnect): History, successes and challenges. BMJ Glob Health 2018;3(Suppl 2):e000559. https://doi.org/10.1136/bmjgh-2017-000559
86. LeFevre AE, Dane P, Copley CJ, et al. Unpacking the performance of a mobile health information messaging program for mothers (MomConnect) in South Africa: Evidence on program reach and messaging exposure. BMJ Glob Health 2018;3(Suppl 2):e000583. https://doi.org/10.1136/ bmjgh-2017-000583
87. Skinner D, Delobelle P, Pappin M, et al. User assessments and the use of information from MomConnect, a mobile phone text-based information service, by pregnant women and new mothers in South Africa. BMJ Glob Health 2018;3(Suppl 2):e000561. https://doi.org/10.1136/bmjgh-2017-000561
88. Gogia S, Sachdev HP. Home-based neonatal care by community health workers for preventing mortality in neonates in low- and middle-income countries: A systematic review. J Perinatol 2016;36(Suppl 1):S55-73. https://doi.org/10.1038/jp.2016.33
89. Lassi ZS, Bhutta ZA. Community‐based intervention packages for reducing maternal and neonatal morbidity and mortality and improving neonatal outcomes. Cochrane Database Syst Rev 2015(3):CD007754. https://doi.org/10.1002/14651858.cd007754.pub3
90. Nkonki L, Chola L, Tugendhaft A, Hofman K. Modelling the cost of community interventions to reduce child mortality in South Africa using the Lives Saved Tool (LiST). BMJ Open 2017;7(8):e011425. https:// doi.org/10.1136/bmjopen-2016-011425
91. Daviaud E, Besada D, Budlender D, Sanders D, Kerber K. Saving lives, saving costs: Investment case for community health workers in South Africa. 2018. http://www.mrc.ac.za/sites/default/files/ files/2017-10-30/SavingLivesSavingCosts.pdf (accessed 13 July 2019).

![Fig. 3. Causes of death in children under 5 years of age in South Africa, 2015.Source: National Department of Health[27] (GE = gastroenteritis; TB = tuberculosis.)](https://thumb-us.123doks.com/thumbv2/123dok_us/8238349.270866/4.595.49.533.97.528/causes-children-africa-source-national-department-gastroenteritis-tuberculosis.webp)
