2017 2nd International Conference on Computer, Network Security and Communication Engineering (CNSCE 2017) ISBN: 978-1-60595-439-4
Supervised PU Learning for Cyber Security Event Prioritization
Wang-yan FENG* and Shu-ning WU
Symantec Corporation, 380 Ellis St, Mountain View, CA 94043, USA *Corresponding author
Keywords: Supervised PU learning, Security event prioritizations, Cyber security.
Abstract. To ensure the cyber security of an enterprise, typically a SIEM (Security Information and Event Management) system is in place to alert security events and assign each of them a severity score based on some pre-determined rules. Analysts in the security operations center (SOC) investigate the high severity events to decide if they are truly malicious or not. However, generally, the number of events is overwhelmingly large, far exceeding the SOC’s budget to handle them. There is a great need for a machine learning system to assist for the accurate detection of malicious events. Traditional supervised learning algorithms cannot be directly applied to this problem because there are only a very small percentage of events that are verified and labelled malicious events (called positively labelled) by SOC analysts and vast majority of events are unlabeled as they are not even investigated. In this paper, we propose to aggregate security events to host level and use supervised PU (Positive Unlabeled) learning technique to accurately detect the high risk hosts. We use Support Vector Machine with radial basis kernel for label propagation and classification and achieve a high classification accuracy of AUC (area under the curve) of 0.96 and lift of 18 relative to the current rule-based alerting mechanism.
Introduction
Cyber security incidents can cause significant financial and reputation impacts on an enterprise. In order to detect malicious activities, a SIEM (Security Information and Event Management) system is often used to normalize and correlate events from endpoints, firewalls, intrusion detection systems, DNS (domain name system) logs, DHCP (dynamic host configuration protocol) logs, Windows event logs, VPN (Virtual Private Network) logs etc. A security operations center (SOC) team develops use cases with pre-determined severities based on analyst experience and expertise. The severity assignments are typically rule-based, involving one or two indicators. Some examples of use cases and corresponding severities are:
• Detection of multiple malware infections that cannot be cleaned by endpoint protection software: Severity = 7
• Detection of traffic to or from a known malicious website: Severity = 2
If any event triggers one or multiple use cases, the SIEM system will generate an alert in real time. Then the SOC analyst will investigate the alert to decide whether the host related to the alert is risky (true positive) or not (false positive). However, SIEM systems typically generate many alerts, with a very high false positive rate. The number of alerts per day can be hundreds of thousands, far more than the budget of the SOC team to investigate all of them manually. Because of this, SOC analysts may choose to investigate only a small percent of the alerts with high severity (i.e., Severity > 5) to determine if a host related to an alert has been compromised. After the investigation, an event deemed to be compromised will be labeled as “malicious” (positive sample) and escalated for remediation. For the majority of events that have not been investigated, their labels are unknown (unlabeled samples). In a real enterprise environment, very few events (<<1%) in the dataset are labelled.
for network intrusion detection and malware classification, risky host detection using PU learning has not been addressed before. Traditional supervised machine learning algorithms do not fit our problem as we only have one class label and do not have negative samples (i.e., normal, or not compromised machines). Considering that most machine learning algorithms do not work well for unbalanced datasets, we perform label propagation based on PU learning as the first step to infer more positive labels. Then we mark the original positive label and the inferred label as “1”, and the remaining unlabeled samples as “0”. This becomes a traditional binary classification problem and different classifiers can be applied. The main contributions of this paper are as follows:
• Propose a PU learning method to detect risky hosts from multiple data sources.
• Demonstrate that PU learning is able to effectively detect risky hosts with traditional
classification algorithm.
The remainder of the paper is organized as follows. In Section 2, the related work is summarized. Section 3 explains our algorithm on PU learning. Section 4 describes the raw data from a real SIEM system and the feature engineering process to provide a context of the specific industry problem we try to address. In Section 5, experimental results on real industry data are discussed. Section 6 concludes the whole paper.
Related Work
Label propagation is the method of inferring labels on unlabeled samples U from known positive
samples P so that machine learning algorithms can be trained on a more balanced dataset. Generally
speaking, previous research on learning from Positive and Unlabeled samples can be divided into two categories: supervised ensemble learning and semi-supervised graph inference.
Supervised PU learning [Liu et al, 2003] generally follows a two-step strategy: Step 1 identifies a reliable positive and/or negative dataset from unlabeled samples, then in Step 2, a series of classifiers are trained on the “reliable” labels and combined to yield the predictions. Such approaches include S-EM [Liu et al., 2003], PEBL [Yu et al., 2002], Roc-SVM [Li and Liu, 2003], Adaptive Classifiers [Elkan and Noto, 2008] and Ensemble SVM [Claesen et al., 2014]. Supervised PU learning has been applied to text/webpage classification [Liu et al, 2003; Yu et al, 2002], time series classification [Nguyen et al, 2011] and disease gene identification [Yang et al, 2012].
Semi-supervised label propagation methods are built on a graph Laplacian similarity matrix [Zhu and Ghahramani, 2002; Zhou, et al, 2004; Delalleau, et al, 2005]. The main idea of these algorithms is that close data points should have similar labels. The algorithms construct a probabilistic transition
matrix T based on the graph similarity value , between samples and , that is, , =
→ = ,
∑ , , and keep propagating the labels until the propagated labels converge (Original
labels do not change or are less likely to change during the propagation). But these algorithms require both positive and negative labels to start with, which cannot be directly applied to our problem where only risky or “positive” hosts are available.
To the best of our knowledge, we have not seen previous research that applies PU learning and label propagation techniques to the cyber security domain, specifically for risky host detection.
Supervised PU Learning and Label Propagation
The label propagation problem can be viewed as a supervised Positive Unlabeled Learning problem [Liu et al., 2003], where the data only includes positive and unlabeled samples, but no negative samples. We use P to denote the positive samples (i.e. risky hosts from analysts’ annotations) and U
to denote unlabeled samples. The supervised PU learning is performed as follows:
1. Assign each sample in P the class label 1; Assign each sample in U the class label 0;
2. Create m bootstrapped samples from both P and U;
4. Apply those m classifiers to classify P and U and combine the predictions by weighted
averaging. Select the top k% samples with highest ensemble predictions and label them as 1. k can be
adjusted based on the input data.
Any classifier can be used in Steps 3 and 4. We chose the Support Vector Machine (SVM) in our experiment as this method is widely used in other PU learning research.
Raw Data and Feature Engineering
The raw data was collected from an enterprise’s internal security logs. It consists of alerts from the SIEM system, and logs from different sources, including firewalls, intrusion detection/prevention system (IDS/IPS), HTTP/FTP/DNS network traffic, host vulnerability scanning, end point protections, Windows security events, VPN logons and so on. The raw data can be classified as IP based data such as IDS/IPS logs where the identifiable entity is IP address; and host based such as of end point protection and Windows security events where the identifiable entity is the host name. Through a dynamic IP to host mapping, we aggregate IP based data to host level and we create features at the individual host level, as our main goal is to predict the host’s risk. We have created 100 features in four categories to describe a host:
• Summary features: these features are statistical summaries. For example, the number of “Malware Not Remediated” events over the last 24 hours
• Indicator features: these features are in binary (0 or 1) format, for example, whether the “Malware Not Remediated” event happens over the weekend
• Temporal features: these features include time information, for example, security event hourly arrival rate
An analyst’s investigation “notes” or annotations are usually stored in a ticketing system as free-form text. The note contains information on whether an alert is true positive or not and we use it to create initial labels for the machine learning dataset. Text mining techniques, such as key word or topic extraction and sentiment analysis, are used to extract the host’s actual state from SOC analysts’ investigation notes.
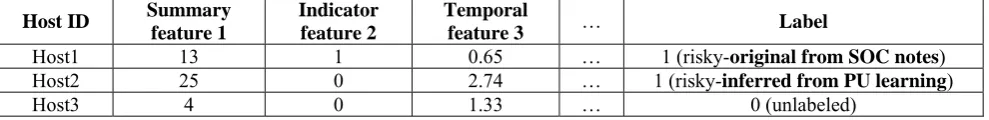
[image:3.595.52.547.534.594.2]After the feature engineering and the label determination, we have an initial dataset that are positive and unlabeled. Then we perform the PU learning with label propagation and combine verified labels with the inferred ones as the targets for the machine learning model. The final modeling dataset looks like this:
Table 1. Example of Final Modelling Dataset
Host ID Summary
feature 1
Indicator feature 2
Temporal
feature 3 … Label
Host1 13 1 0.65 … 1 (risky-original from SOC notes)
Host2 25 0 2.74 … 1 (risky-inferred from PU learning)
Host3 4 0 1.33 … 0 (unlabeled)
Experiment Results
Our initial dataset include 25,715 distinct hosts and 100 features. And 1.17% of the hosts have been verified as compromised by security analysts. We do an 80%/20% split for training and test. The test data has 5,143 hosts, of which 60 have been verified as risky by security analysts, are used to measure PU learning effectiveness as defined in Equation (1) to (3) below:
Model AUC ≈ ∑ × − , where , is the point on ROC curve (1)
Model Detection Rate = Number of Verified Risky Hosts in Certain PredictionsNumber of Verified Risky Hosts × 100% (2)
Model Detection Lift = Proportion of Verified Risky Hosts in Certain Predictions
Area under ROC curve (AUC) evaluates the model’s overall accuracy by approximating the region under the Receiver Operating Characteristic (ROC) curve. ROC curve displays the tradeoff between the true positive rate (TPR) and false positive rate (FPR) of a classifier, where TPR is plotted along the y axis and FPR is plotted along the x axis. The closer the ROC gets to the optimal point of perfect prediction (where FPR=0 and TPR=1), the closer the AUC gets to 1.
In contrast to the AUC that evaluates the model on the whole test data, detection rate and lift reflect how good the model is in discovering risky hosts among different portions of predictions. To calculate these two metrics, the results are first sorted by the model scores (in our case, the probability of a host being risky) in descending order. Detection rate measures the effectiveness of a classification model as the ratio between the results obtained with and without the model. Lift measures how many times it is better to use a model in contrast to not using a model. Assuming we have 30 risky hosts captured in the top 10% of predictions, the lift on these predictions is equal to (30/514)/(60/5,143)≈5. Higher lift implies better performance from a model on certain predictions.
The settings of the experiment are:
• Classifier used in Supervised PU learning and final prediction: Support Vector Machine (with radial basis function kernel)
• We split the data randomly into training (80% of the samples) and test (remaining 20%) sets. We tried different training/test splits and noticed that varying the sample assignment had little impact on the final result. Due to the space limitation, we only report the results from one single split here.
• We select top 10% samples with highest predictions from PU Learning and label them as 1. We tried other proportions, and found that 10% is a good balance between model accuracy and generalizability for our data.
Table 2 shows the AUC values on test data from PU Learning. Note that PU learning goes over the training data twice: first it uses SVM to fit the initial label for label propagation and second it uses another SVM for the final prediction. It is promising that SVM with PU learning achieves a much higher AUC of 0.9639 than SVM model on initial labels without label propagation.
Table 2. AUC Values on Test Data
Area Under Curve (AUC)
SVM with Initial Label 0.8394
SVM with Supervised PU Learning 0.9639
Table 3 lists the detection rates on the top 5% to 20% of predictions respectively. Considering that we only have 1.17% of risky hosts in the test dataset, it is promising that PU learning is able to detect 90% of the true risky cases with only top 10% of predictions.
Table 3. Detection Rates on Top 5%~20% Predictions
Top % of Predictions SVM with Initial Label SVM with Supervised PU Learning
5% 68.33 76.67
10% 68.33 90.00
15% 68.33 93.33
20% 70.00 96.67
Finally, we also evaluate the model lifts on the top 5% to 20% of predictions as listed in Table 4. All lift values are higher than 1, hence the classifier is better than random guessing. Also the model tends to capture the more risky hosts in higher predictions, which can be seen from the monotonically decreasing lift values. The classifier based on PU learning obtained a high lift value of 18.63 in the
top 5% of predictions, meaning that the classifier is almost 19 times better than the current rule-based
system, which is very encouraging.
Table 4. Lifts on Top 5%~20% Predictions
Top % of Predictions SVM with Initial Label SVM with Supervised PU Learning
5% 16.22 18.63
10% 7.41 10.03
15% 4.80 6.69
Conclusions
PU learning using SVM with radial basis kernel for label propagation and classification achieves a high classification accuracy of AUC of 0.96 and lift of 19 times in comparison of the current rule-based alerting mechanism. It has been implemented in a production environment. The features and labels are being updated daily from historical data. Then the machine learning model is trained, refreshed and deployed to the scoring engine daily to make sure it captures the latest patterns from the data. After that, the risk scores are generated in real time when new alerts are triggered, so SOC analysts can take action right away for high risk hosts based on model predictions. Finally, SOC analysts’ notes are collected and fed back into historical data for future model refinement. The whole process has been streamlined automatically from data integration to score generation.
As to future work, we will work on optimizing the classification performance after the label propagation by using more sophisticated classifiers, other than SVM, as described in this paper.
References
[1] B. Liu, et al. “Building text classifiers using positive and unlabeled examples.” Proceedings of the Third IEEE International Conference on Data Mining, 2003.
[2] C. Elkan and K. Noto. “Learning classifiers from only positive and unlabeled data.” Proceeding of the 14th ACM SIGKDD international conference on Knowledge discovery and data mining, 2008 [3] D. Zhou, et al. “Learning with local and global consistency.” Advances in Neural Information Processing Systems 16: 321-328, 2004.
[4] H. Yu, J. Han and K. C. Chang. “PEBL: positive example based learning for web page
classification using SVM.” Proceedings of the 8th ACM SIGKDD international conference on
Knowledge discovery and data mining, 2002
[5] M. Claesen, et al. “A Robust Ensemble Approach to Learn From Positive and Unlabeled Data Using SVM Base Models.” Neurocomputing: Special Issue on Advances in Learning with Label Noise, 2014
[6] M. N. Nguyen, X. Li and S. K. Ng. “Positive Unlabeled Learning for Time Series Classification.” Proceedings of the 22nd international joint conference on Artificial Intelligence, 2011
[7] O. Delalleau, Y. Bengio and N. L. Roux. “Efficient Non-Parametric Function Induction in Semi-Supervised Learning.” Proceedings of the 10th International Workshop on Artificial Intelligence and Statistics, 2005
[8] P. Yang, et al. “Positive-Unlabeled Learning for Disease Gene Identification.” Bioinformatics 28 (20): 2640-2647, 2012
[9] X. Li and B. Liu. “Learning to classify text using positive and unlabeled data.” Proceedings of the 18th international joint conference on Artificial intelligence, 2003
[10] X. Zhu and Z. Ghahramani. “Learning from labeled and unlabeled data with label