IJPAR |Vol.7 | Issue 1 | Jan - Mar -2018 Journal Home page: www.ijpar.com
Research article Open Access
RP-HPLC method for simultaneous estimation of simvastatin and
ezetimibe in tablet dosage forms
Srikanth Choudary Pallothu
1*, Jogu Chandrudu
2,
Sriram. N
31
Associate Professor, Omega College of Pharmacy, Edulabad, Hyderabad, Ghatkesar, Telangana 501301.
2
Assistant Professor, Scient Institute of Pharmacy, Nagarjuna Sagar Highway, Rangareddy,
Ibrahimpatnam, Telangana 501506.
3
Holy Mary Institute of Technology and Science, Telangana 501506.
*Corresponding Author:Srikanth Choudary Pallothu
Email: [email protected]
ABSTRACT
A rapid, precise, specific, accurate and robust simple RP-HPLC method for the simultaneous determination of Simvastatin and Ezetimibehas been developed and validated. The Stationary phase (column) is Inertsil-ODS C18 (250
x 4.6 mm, 5 µ) and Mobile Phase is Methanol: Acetonitrile (80:20), with flow rate of 1.0ml/min using UV detection at 240 nm. The retention time if simvastatin and ezetimibe is 3.125 and 3.380 respectively. The Method shows linearity in the range of simvastatin and ezetimibe with correlation coefficient of 0.9999 for both. The limit of detection (LOD) and limit of quantification (LOQ) for simvastatin and ezetimibe were found to be 0.22 and 0.25 respectively. The % recovery for simvastatin and ezetimibe were found within the range of 99.83 and 99.55 respectively. The developed RP-HPLC method was innovation, suitable for detecting both simvastatin and ezetimibe in tablet dosage form.
Keywords:
RP-HPLC, Simultaneous estimation, Simvastatin, Ezetimibe and Tablet dosagre form.INTRODUCTION
Spectrophotometry is generally preferred especially by small-scale industries as the cost of the equipment is less and the maintenance problems are minimal. The method of analysis is based on measuring the absorption of a monochromatic light by colorless compounds in the near ultraviolet path of spectrum (200-380nm). The photometric methods of analysis are based on the Bouger-Lambert-Beer’s law, which establishes the absorbance of a solution is directly proportional to
the concentration of the analyte. The fundamental principle of operation of spectrophotometer covering UV region consists in that light of definite interval of wavelength passes through a cell with solvent and falls on to the photoelectric cell that transforms the radiant energy into electrical energy measured by a galvanometer[1-4].
High-Performance Liquid Chromatography (HPLC) is a special branch of column chromatography in which the mobile phase is forced through the column at high speed. As a
result the analysis time is reduced by 1-2 orders of magnitude relative to classical column chromatography and the use of much smaller particles of the adsorbent or support becomes possible increasing the column efficiency substantially. The essential equipment consists of an eluent, reservoir, a high-pressure pump, and an injector for introducing the sample, a column containing the stationary phase, a detector and recorder. The development of highly efficient micro particulate bonded phases has increased the versatility of the technique and has greatly improved the analysis of multi component mixtures.
MATERIALS AND METHODS
Preparation of Standard Solution
Weigh down 10mg’s of Simvastatin and Ezetimibe drugs and dissolved in 10ml of Mobile phase taken in two 10ml of volumetric flasks seperately and sonicated for 20 minutes to get 1000ppms and 1 ml was taken from each solution into a 10ml volumetric flask and diluted to 10 ml with mobile phase.
Chromatographic Conditions
Flow rate : 1.0ml/min
Column : Inertsil - C18, BDS column Detector wavelength: 240nm
Column temp : Ambient Injection volume : 20µl Run time : 10min
Retention time : 3.125min for SMVSTATN and 3.380 for EZTMBE.
Optimized Method
Mobile Phase: Degassed Acetonitrile and
Buffer in the ratio of 60:40 V/V.
Preparation of stock solution
Reference solution: The solution was prepared by dissolving 25.0 mg of accurately weighed Simvastatin and 25.0 mg Ezetimibe in Mobile phase, in two 100.0 mL volumetric flasks separately and sonicate for 20min. From the above solutions take 10.0 mL from each solution into a 50.0 mL volumetric flask and then makeup with mobile phase and sonicate for 10min.
Preparation of working standard solution
The stock solutions equivalent to 20ppm to 80ppm with respect to both drugs were prepared in combination of Simvastatin and Ezetimibe above, sonicated and filtered through 0.45µ membrane.
Preparation of sample drug solution for
pharmaceutical formulations
Twenty tablets were weighed accurately and a quantity of tablet powder equivalent to 40 mg Simvastatin and 40 mg Ezetimibe was weighed and dissolved in the 70 mL mobile phase with the aid of ultrasonication for 20 min. The content was diluted to 100 mL with mobile phase to furnish a stock test solution. The stock solution was filtered through a 0.45 µm Nylon syringe filter and 10.0 mL of the filtrate was diluted into a 100.0 mL volumetric flask to give a test solution containing 40 µg/mL Simvastatin and 40 µg/mL Ezetimibe[5].
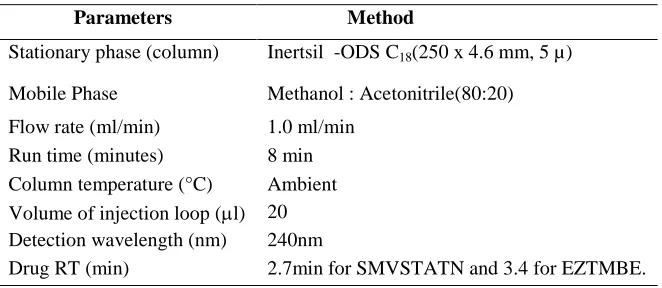
Table 1: Optimized chromatographic conditions
Parameters Method
Stationary phase (column) Inertsil -ODS C18(250 x 4.6 mm, 5 µ)
Mobile Phase Methanol : Acetonitrile(80:20) Flow rate (ml/min) 1.0 ml/min
Run time (minutes) 8 min Column temperature (°C) Ambient Volume of injection loop (l) 20 Detection wavelength (nm) 240nm
Simvastatin
Figure 1. Structure of Simvastatin
Chemical Formula : C25H38O5
Molecular Weight : 418.5662 g/mole
IUPAC :(1S,3R,7S,8S,8aR)-8-{2-[(2R,4R)-4-hydroxy-6-oxooxan-2-yl]ethyl}-3,7-dimethyl-1,2,3,7,8,8a
hexahydronaphthalen-1-yl 2,2-dimethylbutanoate.
Category : Anticholestermicagents, hypolipidemic agents.
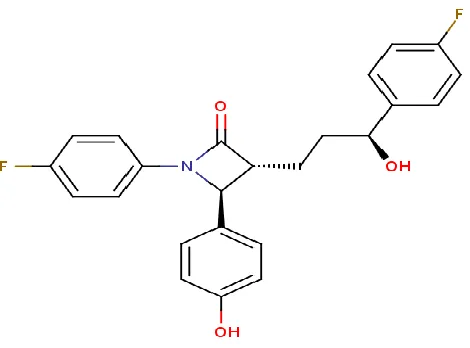
Ezetimibe
Figure 1. Structure of Ezetimibe
Chemical formula : C24H21F2NO3
Molecular Weight : 409.4252 g/mole
IUPA: (3R,4S)-1-(4-fluorophenyl)-3-[(3S)-3-(4-fluorophenyl)-3-
hydroxypropyl]-4-(4-hydroxyphenyl)azetidin-2-one
METHOD VALIDATION
System Suitability
A Standard solution was prepared by using Simvastatin and Ezetimibe working standards as per test method and was injected Five times into the HPLC system. The system suitability parameters were evaluated from standard chromatograms by calculating the % RSD from five replicate injections for Simvastatin and Ezetimibe,
retention times and peak areas.
Acceptance Criteria
1. The % RSD for the retention times of principal peak from 5 replicate injections of each Standard solution should be not more than 2.0 %
2. The % RSD for the peak area responses of principal peak from 5 replicate injections of each standard Solution should be not more than 2.0%. 3. The number of theoretical plates (N) for the
Simvastatin and Ezetimibe peaks is NLT 3000. 4. The Tailing factor (T) for the Simvastatin and
Ezetimibe peaks is NMT 2.0
Observation
The %RSD for retention times and peak areas were found to be within the limit.
Specificity
Simvastatin and Ezetimibe
Solutions of standard and sample were prepared as per the test method are injected into chromatographic system.
Acceptance Criteria
Chromatograms of standard and sample should be identical with near Retention time.
Observation
The chromatograms of Standard and Sample were same identical with same retention time.
Precision
Repeatability
a. System precision: Standard solution prepared as per test method and injected five times.
b. Method precision: Prepared six sample preparations individually using single as per test method and injected each solution.
Acceptance Criteria
The % relative standard deviation of individual Simvastatin and Ezetimibe, from the six units should be not more than 2.0%. The individual assays of Simvastatin and Ezetimibe should be not less than 98% and not more than 102.0%.
Observation
Test results are showing that the test method is precise. Intermediate precision (analyst to analyst variability)
A study was conducted by two analysts as per test method
Acceptance Criteria
The individual assays of Simvastatin and Ezetimibe should be not less than 98% and not more than 102% and %RSD of assays should be NMT2.0% by both analysts.
Observation
Individual %assays and % RSD of Assay are within limit and passes the intermediate precision,
Accuracy (Recovery)
A study of Accuracy was conducted. Drug Assay was performed in triplicate as per test method with equivalent amount of Simvastatin and Ezetimibe into each volumetric flask for each spike level to get the concentration of Simvastatin and Ezetimibe equivalent to 50%, 100%, and 150% of the labeled amount as per the test method. The average % recovery of Simvastatin and Ezetimibe were calculated.
Acceptance Criteria
The mean % recovery of the Simvastatin and Ezetimibe at each spike level should be not less than 98.0% and not more than 102.0% for both the drugs separately.
Amount found
The recovery results indicating that the test method has anacceptable level of accuracy.
Linearity of Test Method
A Series of solutions are prepared using Simvastatin and Ezetimibe working standards at concentration levels from 20ppm to 80 ppm of target concentration .Measure the peak area response of solution at Level 1 and Level 6 six times and Level 2 to Level 5 two times[6-12].
Acceptance Criteria
Correlation Coefficient should be not less than 0.9990.
% of y- Intercept should be ±2.0.
% of RSD for level 1 and Level 6 should be not more than 2.0%.
Observation
The linear fit of the system was illustrated graphically.
Ruggedness of Test Method
System to system variability
System to system variability study was conducted on different HPLC systems, under similar conditions at different times. Six samples were prepared and each was analyzed as per test method. Comparison of both the results obtained on two different HPLC systems, shows that the assay test method are rugged for System to system variability.
Acceptance Criteria
The % relative standard deviation of Simvastatin and Ezetimibe from the six sample preparations should be not more than 2.0% the % assay of Simvastatin and Ezetimibe should be between 98.0%-102.0%.
Observation
The % RSD was found within the limit. Ref tables: 3 &7.
Column to column variability
Column to column variability study was conducted by using different columns. Six samples were prepared and each was analyzed as per test method
Acceptance Criteria
The %RSD of Simvastatin and Ezetimibe tablets should be NMT2.0%. The %assay of Simvastatin and Ezetimibe should be between 98.0% and 102.0% for individual drugs.
Observation
The results obtained by comparing with both two types were within limit. Refer tables: 3 &9
Robustness
Effect of variation of flow rate
A study was conducted to determine the effect of variation in flow rate. Standard solution prepared as per the test method was injected into the HPLC system using flow rates, 1.0ml/min and 1.2ml/min. The system suitability parameters were evaluated and found to be within the limits for 1.0ml/min and 1.2ml/min flow. Simvastatin and Ezetimibe and was resolved from all other peaks and the retention times were comparable with those obtained for mobile phase having flow rates 1.0ml/min.
Acceptance Criteria
The Tailing Factor of Simvastatin and Ezetimibe standards should be NMT 2.0 for Variation in Flow.
Observation
The tailing factor for Simvastatin and Ezetimibe was found to be within the limits.
Effect of variation of temperature
A study was conducted to determine the effect of variation in temperature. Standard solution prepared as per the test method was injected into the HPLC system at 20ºC temperature. The system suitability parameters were evaluated and found to be within the limits for a temperature change of 20ºc.
Similarly sample solution was chromatographed at 25ºC temperature. Simvastatin and Ezetimibe were resolved from all other peaks and the retention times were comparable with those
Acceptance Criteria
Limit of Detection and Quantitation (LOD
and LOQ)
From the linearity data calculate the limit of detection and quantitation, using the following formula.
LOD= 3.3 σ S
σ = standard deviation of the response
S = slope of the calibration curve of the analyte. LOQ = 10 σ
S
σ = standard deviation of the response
S = slope of the calibration curve of the analyte.
RESULTS AND DISCUSSION
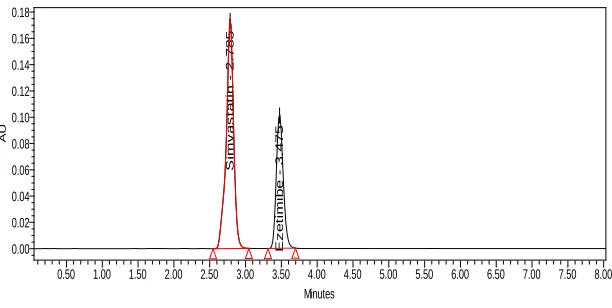
Method development
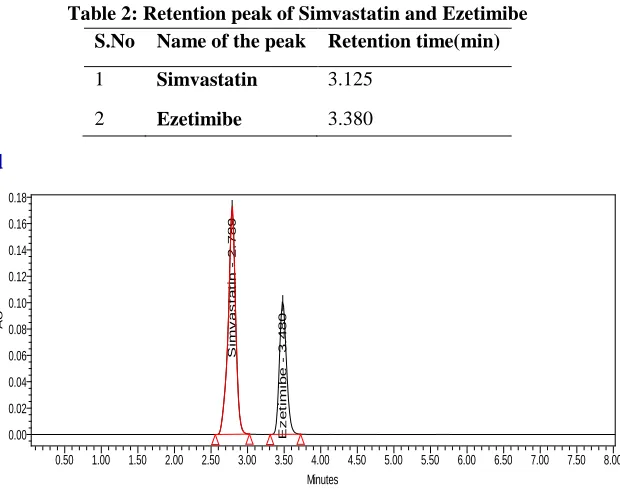
Fig 3: Chromatogram of Trial 1
Table 2: Retention peak of Simvastatin and Ezetimibe S.No Name of the peak Retention time(min)
1 Simvastatin 3.125
2 Ezetimibe 3.380
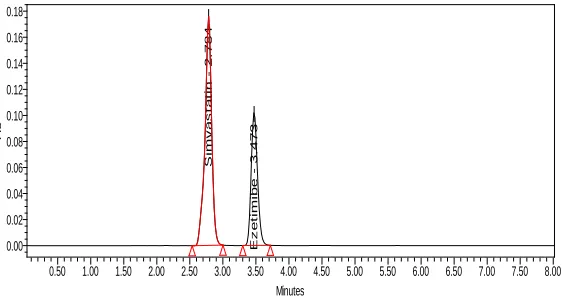
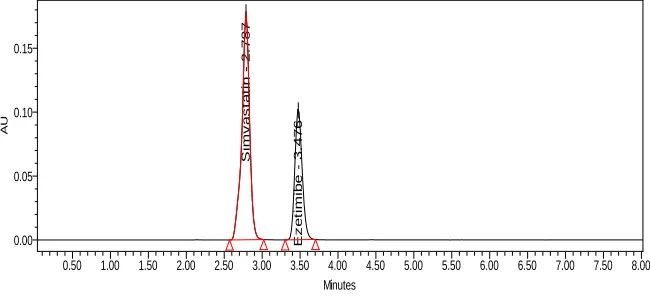
Optimized Method
Fig 4: Chromatogram of standard
3
.1
2
5
3
.3
8
0
AU
0.00 0.05 0.10 0.15 0.20 0.25 0.30 0.35 0.40 0.45 0.50
Minutes
0.50 1.00 1.50 2.00 2.50 3.00 3.50 4.00 4.50
S
im
v
a
s
ta
ti
n
2
.7
8
9
E
z
e
ti
m
ib
e
3
.4
8
0
AU
0.00 0.02 0.04 0.06 0.08 0.10 0.12 0.14 0.16 0.18
Minutes
Table 3: Retention peak of Simvastatin and Ezetimibe S.No Name of the peak Retention time(min)
1 Simvastatin 2.789
2 Ezetimibe 3.480
System Suitability
Table 5: Data of System Suitability for Simvastatin
Injection RT Peak Area USP Plate count USP Tailing
Mean 2.789 1228070.6 8891.11744 0.889742 SD 0.00707 21061.68 --- --- % RSD 0.025353 1.71 --- ---
Table 4: Data of System Suitability forEzetimibe
Injection RT Peak Area USP Plate count USP Tailing
Mean 3.479 677206.8 6109.379 1.154635 SD 0.001817 7252.993 --- --- % RSD 0.05221 1.071016 --- ---
Fig 5: Chromatograms of system suitability
Specificity
Fig 6: Chromatogram of standard
S im v a s t a t in -2 . 7 8 9 E z e t im ib e -3 . 4 8 0 AU 0.00 0.02 0.04 0.06 0.08 0.10 0.12 0.14 0.16 0.18 Minutes
0.50 1.00 1.50 2.00 2.50 3.00 3.50 4.00 4.50 5.00 5.50 6.00 6.50 7.00 7.50 8.00
S im v a s t a t in -2 . 7 8 4 E z e t im ib e -3 . 4 7 3 AU 0.00 0.02 0.04 0.06 0.08 0.10 0.12 0.14 0.16 0.18 Minutes
Ezetimibe
Fig 7: Chromatogram of sample
Precision
Repeatability- System precision
Table 6: Data of Repeatability (System precision) forSimvastatin
Concentration 40ppm
Injection Peak Areas of
Simvastatin %Assay
1 1239704 99.95
2 1246846 100.24
3 1252530 100.06
4 1261073 99.30
5 1266667 100.00
Statistical Analysis
Mean 1253364 99.91
SD 10795.53 0.35819
% RSD 0.861324 0.35
Table 7: Data of Repeatability (System precision) for Ezetimibe
Concentration 40ppm
Injection Peak Areas of
Ezetimibe %Assay
1 676488 98.66
2 683935 99.30
3 686924 101.53
4 687698 100.53
5 694665 99.98
Statistical Analysis
Mean 685942 100.00
SD 6586.819 1.107678
% RSD 0.960259 1.10
S
im
v
a
s
ta
ti
n
2
.7
8
5
E
z
e
ti
m
ib
e
3
.4
7
5
AU
0.00 0.02 0.04 0.06 0.08 0.10 0.12 0.14 0.16 0.18
Minutes
Fig 8: Chromatograms of system
Method precision
Table 8: Data of Repeatability (Method precision) for Simvastatin
Concentration 40ppm
Injection Peak Areas of
Simvastatin %Assay
1 1214943 98.6
2 1220150 99.02
3 1220212 98.12
4 1219505 98.31
5 1265543 98.81
6 1220150 98.36
Statistical Analysis
Mean 1226751 98.48
SD 19113.65 0.352647
% RSD 1.558071 0.35
Table 9: Data of Repeatability (Method precision) for Ezetimibe
Concentration 40ppm
Injection Peak Areas of
Ezetimibe %Assay
1 674665 98.55
2 672015 98.88
3 672211 99.40
4 677612 99.30
5 689531 100.53
6 672015 98.28
Statistical Analysis
Mean 676341.5 99.278
SD 6824.749 0.827236
% RSD 1.009068 0.83
S
im
v
a
s
ta
ti
n
2
.7
8
7
E
z
e
ti
m
ib
e
3
.4
7
6
AU
0.00 0.05 0.10 0.15
Minutes
Fig 9: Chromatograms of Repeatability
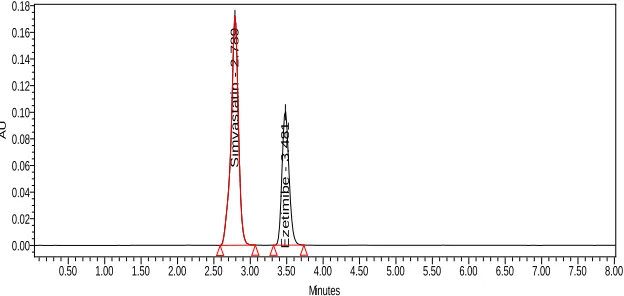
Accuracy (Recovery)
Fig 10: Chromatograms for accuracy (50%)
Linearity
Fig 11: Linearity Plot (Concentration Vs Response) of Simvastatin
S
im
v
a
s
ta
ti
n
2
.7
8
9
E
z
e
ti
m
ib
e
3
.4
8
1
AU
0.00 0.02 0.04 0.06 0.08 0.10 0.12 0.14 0.16 0.18
Minutes
0.50 1.00 1.50 2.00 2.50 3.00 3.50 4.00 4.50 5.00 5.50 6.00 6.50 7.00 7.50 8.00
S
im
v
a
s
ta
ti
n
2
.7
9
3
E
z
e
ti
m
ib
e
3
.4
8
2
AU
0.00 0.02 0.04 0.06 0.08 0.10
Minutes
0.50 1.00 1.50 2.00 2.50 3.00 3.50 4.00 4.50 5.00 5.50 6.00 6.50 7.00 7.50 8.00
y = 30432x - 15666 R² = 0.9995
Series1
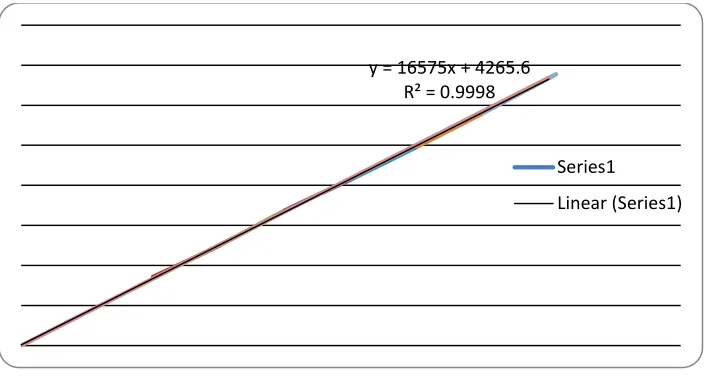
Fig 12: Linearity Plot (Concentration Vs Response) ofEzetimibe
Ruggedness- System to System variability
Table 10: Data of system to system variability (Simvastatin)-System-2
S.NO: Peak area
Assay % of Simvastatin
Mean 1230010 99.07667
%RSD 1.579467 0.56
Table 11: Data of system to system variability (Ezetimibe)- System-2
S.NO: Peak area
Assay % of Ezetimibe
Mean 677087 98.64
%RSD 0.959095 0.12
Fig 13: Chromatogram of system to system variability
y = 16575x + 4265.6 R² = 0.9998
Series1
Linear (Series1)
S
im
v
a
s
ta
ti
n
2
.7
8
9
E
z
e
ti
m
ib
e
3
.4
7
8
AU
0.00 0.05 0.10 0.15
Minutes
Robustness
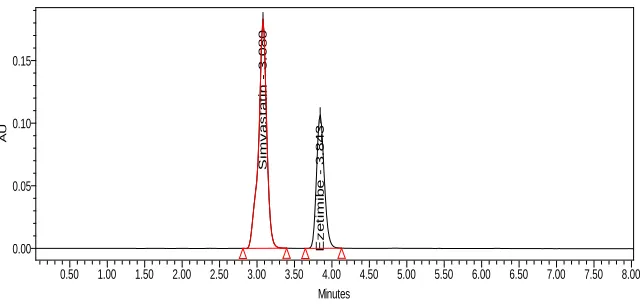
Fig 14: Chromatograms of robustnesso
Limit of Detection and Limit of Quantitation
(LOD and LOQ)
Simvastatin
From the linearity plot the LOD and LOQ are calculated
LOD = 0.22 LOQ = 0.69
Ezetimibe
LOD = 0.25
LOQ = 0.75
CONCLUSION
The developed methods were validated as per ICH guidelines and were found to be within the prescribed limit. It concludes that the developed methods are simple, accurate, sensitive and precise and suitable for both authentic and tablet dosage form.
REFERENCES
[1]. Elkady EF, Fouad MA. Two liquid chromatographic methods for the simultaneous determination of ibuprofen and methocarbamol or chlorzoxazone in the presence of their degradation products. J Liq Chromatogr Relat Technol. 2012, 882-95.
[2]. Gul S, Sultana N, Arayne MS, et al. New method for optimization and simultaneous determination of sparfloxacin and non-steroidal anti-inflammatory drugs: Its in-vitro application. Am J Analyt Chem. 2012, 328-37.
[3]. Harde M, Wankhede S, Chaudhari P. Development of validated UV spectrophotometric method for simultaneous estimation of ibuprofen, paracetamol and caffeine in the bulk drug and marketed formulation. World J Pharm Res. 2015, 1428-36.
[4]. Haritha P, Sreenivasa Rao B, Sunandamma Y. Method development and validation for simultaneous determination of Paracetamol and Ketoprofen by RPHPLC Technique. Int J Appl Biol Pharm. 2014, 110-22. [5]. Liu J. Determination of 4-isobutyl acetophenone in ibuprofen injections by HPLC. 2012, 672-673.
[6]. N Bassanese D. Protocolsfor finding themostorthogonal dimensions for two dimensional high performance liqui d chromatography. Talanta. 2015, 402-408.
[7]. Tuani YT, Nartey VK, Akanji O, et al. Simultaneous quantification of Paracetamol and Ibuprofen in fixed dose combination using RP-HPLC with UV detection. IJPCR. 2014, 7-15.
[8]. Santini, A.O., de Oliveira, J. E., Pezza, H.R., pezza, L. A new potentiometric ibuprofen ion sensor immobilized in a graphite matrix for determination of ibuprofen in tablets. Microchemical J., 84(1-2), 2006, 44 49. 8. [9]. Singhvi, I., Chaturvedi, S.C. Spectrophotometric methods for simultaneous estimation of ibuprofen and
pseudoephedrine hydrochloride from tablets. Indian Drugs 35(4), 1998, 234-238.
S
im
v
a
s
ta
ti
n
3
.0
8
0
E
z
e
ti
m
ib
e
3
.8
4
3
AU
0.00 0.05 0.10 0.15
Minutes
[10].Sachan, A., Trivedi, P., First derivative spectrophotometric estimation of ibuprofen and dextropropoxyphene hydrochloride in solid dosage formulations. Indian Drugs 35(12), 1998, 762-765
[11]. Ivanovic, D., Medenica, M., Markovic, S., Mandic, G., Second-derivative spectrophotometric assay of pseudoephedrine, ibuprofen and loratadine in pharmaceuticals. ArzneimittelForschung/ Drug Research. 50(11), 2000, 1004-1008.
[12]. Damiani, P. C., Bearzotti, M., Cabezon, M. A., Spectrofluorometric determination of ibuprofen in pharmaceutical formulations. J. of pharmaceutical and Biomedical analysis 25(3-4), 2001, 679-683.