A New Maximum Test via the Dependent Samples t-Test
and the Wilcoxon Signed-Ranks Test
Saverpierre Maggio, Shlomo S. Sawilowsky
1
Department of Psychology, University of Windsor, Windsor, Canada
2
Department of Evaluation and Research, Wayne State University, Detroit, USA
Email:
Received October 16, 2013; revised November 16, 2013; accepted November 23,2013
Copyright © 2014 Saverpierre Maggio, Shlomo S. Sawilowsky. This is an open access article distributed under the Creative Com- mons Attribution License, which permits unrestricted use, distribution, and reproduction in any medium, provided the original work is properly cited. In accordance of the Creative Commons Attribution License all Copyrights © 2014 are reserved for SCIRP and the owner of the intellectual property Saverpierre Maggio, Shlomo S. Sawilowsky. All Copyright © 2014 are guarded by law and by SCIRP as a guardian.
ABSTRACT
A maximum test in lieu of forcing a choice between the two dependent samples t-test and Wilcoxon signed-ranks test is proposed. The maximum test, which requires a new table of critical values, maintains nominal α while gu- aranteeing the maximum power of the two constituent tests. Critical values, obtained via Monte Carlo methods, are uniformly smaller than the Bonferroni-Dunn adjustment, giving it power superiority when testing for treat- ment alternatives of shift in location parameter when data are sampled from non-normal distributions.
KEYWORDS
Maximum Test; Dependent Samples t-Test; Wilcoxon Signed-Ranks Test; Bonferroni-Dunn Adjustment; Experiment-Wise Type I Error; Inferential Statistics; Monte Carlo Method
1. Introduction
The process of selection of a test can be complicated, confusing, and in some cases disappointing. In choosing a particular test, consideration must be given to its robustness properties with respect to Type I errors for depar- tures from population normality and that it has favorable comparative statistical power [1]. When parametric con- ditions are violated one test or another may be found to be more powerful than its competitor analogue under a given set of circumstances [1]. Therefore, the choice is often left to intuitive selection or guesswork [2].
In the context of two samples when testing for a treatment modeled as a shift in location parameter, both the parametric t-test and nonparametric Wilcoxon signed-ranks (WSR) test are possibilities. Under normality, the t-test is the uniformly most powerful unbiased test. However, that distinction is lost when data are sampled from non-normal distributions [3]. Blair and Higgins [3] found no instance where the t-test held more than a modest power advantage over the Wilcoxon test, whereas the latter held a clear power advantage, as much as 0.895, over the t-test for data obtained from skewed distributions. See also references [4-8].
Although they disagreed with the practice, Sawilowsky and Fahoome [9] noted transforming data to fit para- metric assumptions which is commonly recommended when confronting with nonnormally distributed data. This practice (a) suffers from not knowing a priori which transformation is to use, and (b) conducts the hypothesis test on a metric that is often irrelevant to the research context [9]. Other solutions, such as conducting both the t-test and the Wilcoxon signed-ranks test and accepting the latter if it is significant, or conducting a preliminary test for normality prior to a test of effects, merely serve to increase the Experiment-Wise Type I error rate [9].
2. Maximum Test
on taking the more significant result of the dependent sample t (DT) and Wilcoxon signed-ranks (WSR) tests. In order to avoid inflation of Type I errors, the larger of the two obtained critical values must then be compared with the appropriate critical value obtained from the joint sampling distribution of the two tests.
A maximum test has useful diagnostic properties with extreme component statistics that is sensitive to any statistical departures from normal null hypothesis [2]. The advantage of the maximum test was “the fact that the test is automatically adaptive to the weight in the tail of the population from which the data were sampled” [2, p. 17]. Type I error rates are not inflated, because the critical value of a maximum test is a single test based on the joint sampling distribution of the component tests. Other important advantages of the maximum test are (1) avoidance of the task to choose one test over another or others without running the risk of power losses and (2) avoidance of the task to conduct post hoc alpha adjustments such as the Bonferroni-Dunn.
3. Statement of the Problem
The three-fold purpose of this study is to 1) create a maximum test using the parametric dependent samples t-test and the non-parametric Wilcoxon sign rank test 2) obtain critical values via Monte Carlo methods using sample deviates obtained randomly and with replacement from a contaminated (mixed) normal distribution. Critical values will be derived for nominal alpha levels of 0.05, 0.025, 0.01 and 0.005 for sample sizes 8 - 30, 45, 60, 90, and 120, and 3) to demonstrate the critical values compare favorably to the Bonferroni-Dunn adjustment.
4. Model
Algina, Blair and Coombs [10, p. 28] defined the maximum test as a statistic “for a particular data set, two or more statistics and test the same hypothesis and selecting as the test statistic the one with the smallest p value” and in the event that “each statistic has the same critical value the maximum statistic is simply the most extreme of the calculated statistics”.
Cox [2, p. 50] described a significance test as a procedure for measuring the consistency of data with a null hypothesis Hohaving the form where “an observed vector, y, of response variables, or sometimes written as yobs,
and null hypothesis Ho according to which y is the observed value of a random variable Y, with sampling space
Sy, and having a probability density fY
( )
y in some family Ho.” The function t=t y( )
of the observations, ora test statistic. The corresponding random variable is represented by T. Thus the observed level of significance and the allowance for selection is,
(
obs)
obs pr(
obs(
obs)
; o)
,p y = p = T ≥t =t y H (1)
where pobs is the observed value of a random variable. Cox [2] provided the following form of the a maximum test
which Cox [2] credited to Tippet [11],
(
1)
min ,k
q= pp (2)
where pj is the significance level in the jth test and small values of q are evidence against Ho. The required level of
significance and the allowance for selection was noted as
(
obs o(
obs o)
pr Q≤q ;H = −1 pr Pj >q ;j=l,, ;k H . (3)
If component tests are independent and continuous (3) becomes 1
(
1 obs)
kq
− − , and that an upper bound for (3) is in any case kqobs.
Hence the maximum test via the dependent sample t-test and the Wilcoxon signed-rank test was defined as
;
;
WSR WSR DT MAX
DT DT WSR
t t t
t
t t t
>
=
>
. (4)
Both the DT and WSR were computed in the same metric as the DT. The variable tWSR refers to the probabili-
ty of the acquired Z from the WSR test that was converted to an obtained t associated with n1+n2−2 degrees
of freedom. In the event scores are tied tWSR = tDT then either DT or the WSR was used.
Assumptions
mixed normal distribution, they are useful for general mixed normal distributions and other non-normal shapes.
5. Method
Monte Carlo simulation methods were used to obtain critical values. A FORTRAN program employing various subroutines of the International Mathematical and Statistical Libraries [12] was developed in order to create the test and to obtain critical values.
Deviates were randomly sampled from a contaminated (mixed normal) distribution based on two populations which differ in respective means and/or variances. It was formed by sampling with a probability of 0.95 from a normal distribution with mean of 0 and a standard deviation of 1, and with a probability of 0.05 from a normal distribution with a mean equal to 22 and a standard deviation of 10. The contaminated (mixed normal) distribu- tion was chosen for this study because it is familiar to many readers, it’s commonly used in robustness studies and they are important population models across a variety of disciplines [13]. This maximum test could gener- ally be used for any model of mixed normal populations, and to a lesser extent any non-normal model.
Critical values were obtained as follows. Random deviates were assigned to two groups. Both the dependent samples t-test and the Wilcoxon signed-ranks test were computed. Subsequently, the probability of the obtained Z from the Wilcoxon test was converted to an obtainedtthat would be associated with the degrees of freedom using the IMSL tin(p, df) subroutine [12]. Then, the two obtained t values were compared, and whichever was the higher was recorded. This process was repeated 200,000 times and the results were stored in an array, which was subsequently sorted from low to high. Then, the value corresponding to the percentile associated with the desired alpha level was selected. For example, the value at the 95th percentile represents the critical value for the nominal alpha = 0.05 level.
6. Monte Carlo Simulations Results
6.1. Critical Values
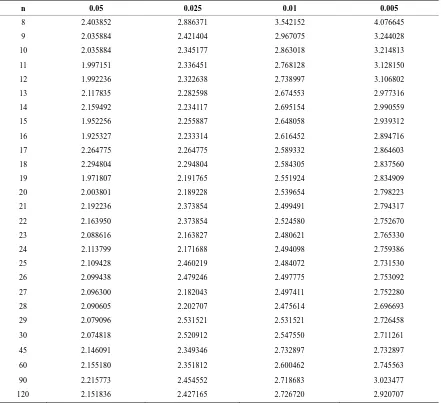
Critical values were selected from the ordered array to represent values at the 0.05, 0.025, 0.01 and 0.005 signi- ficance levels. This process was repeated for sample sizes n = 8 through 30, 45, 60, 90 and 120. The critical values are presented in Table 1.
As expected, the tabled critical values moved inversely with sample size, meaning that as the sample size in- creased the tabled values decreased. In some instances, critical values reversed direction, and then returned to the descending pattern as n increased. In a few instances, the critical values repeated at different samples sizes and alpha levels. Both anomalies are attributed to the computational nature of the maximum test, and were pre- viously noted by other workers on the maximum test [9,14]. Hence, although these two phenomena appear anti- thetical, they are expected and are not disconcerting.
6.2. Inspection of Maximum Test Critical Values and Comparison with Bonferroni-Dunn Critical Values
As noted in Tables 2 and 3 on the following page, the critical values for the maximum test were systematically larger than critical values for the t-test. This behavior controls the inflation of Type I errors.
The fallback plan in avoiding Type I error inflation is to use a Bonferroni-Dunn adjustment when conducting multiple statistical tests. Bonferroni-Dunn attempts to control the probability of rejecting at least one true hy- pothesis at some specified level a by testing each of the hypotheses of interest at level of significance α. It is used “when conducting multiple tests of significance to set an upper bound on the overall significance level α” [15]. Simes [15, p. 751] explained that “If T1,,Tn” is a set of n statistics with corresponding p-values
1, , n
P P , for testing hypotheses H1,,Hn, the classical Bonferroni multiple test procedure is usually per-
formed by rejecting Ho=
{
H1,,Hn}
if any p-value is less than α/n. Furthermore the specific hypothesis H1is rejected for each Pi≤Sα n i
(
=1,,n)
.” Usually, the adjustment is too conservative and lacks requisite power to reject an individual hypothesis as the number of tests increases, thereby having the effect of missing real differences [16].Critical values for the maximum test are compared with values obtained via Bonferroni-Dunn adjustment, NT
Table 1. Two-tailed critical values for the two dependent samples maximum test.
n 0.05 0.025 0.01 0.005
8 2.403852 2.886371 3.542152 4.076645
9 2.035884 2.421404 2.967075 3.244028
10 2.035884 2.345177 2.863018 3.214813
11 1.997151 2.336451 2.768128 3.128150
12 1.992236 2.322638 2.738997 3.106802
13 2.117835 2.282598 2.674553 2.977316
14 2.159492 2.234117 2.695154 2.990559
15 1.952256 2.255887 2.648058 2.939312
16 1.925327 2.233314 2.616452 2.894716
17 2.264775 2.264775 2.589332 2.864603
18 2.294804 2.294804 2.584305 2.837560
19 1.971807 2.191765 2.551924 2.834909
20 2.003801 2.189228 2.539654 2.798223
21 2.192236 2.373854 2.499491 2.794317
22 2.163950 2.373854 2.524580 2.752670
23 2.088616 2.163827 2.480621 2.765330
24 2.113799 2.171688 2.494098 2.759386
25 2.109428 2.460219 2.484072 2.731530
26 2.099438 2.479246 2.497775 2.753092
27 2.096300 2.182043 2.497411 2.752280
28 2.090605 2.202707 2.475614 2.696693
29 2.079096 2.531521 2.531521 2.726458
30 2.074818 2.520912 2.547550 2.711261
45 2.146091 2.349346 2.732897 2.732897
60 2.155180 2.351812 2.600462 2.745563
90 2.215773 2.454552 2.718683 3.023477
[image:4.595.84.528.533.618.2]120 2.151836 2.427165 2.726720 2.920707
Table 2. Two tailed critical values for the t, Maximum Test, and Bonferroni-Dunn (n = 8).
α t Maximum Test Bonferroni-Dunn
0.05 2.36462 2.403852 2.841245
0.025 2.841244 2.886371 3.335292
0.01 3.499484 3.542152 4.029338
0.005 4.029337 4.076645 4.594619
Table 3. Two tailed critical values for the t, Maximum Test and Bonferroni-Dunn (n = 120).
α t Maximum Test Bonferroni-Dunn
0.05 1.98010 2.151836 2.270117
0.025 2.270117 2.270117 2.536239
0.01 2.617776 2.726720 2.860317
[image:4.595.87.528.648.732.2]6.3. Example of Use of the Maximum Test
Suppose a test of difference in average performance of a treatment versus a control group was conducted with n1
= n2 = 20, for a two-sided test with α = 0.05. The first step is to conduct both the dependent t-test and Wilcoxon
signed-ranks test. The second step is to select whichever obtained statistic is higher in magnitude (i.e., select the statistic whose absolute value is greater). The third step is to enter Table 1with n = 20, α = 0.025, and retrieve the critical value of ±2.189228. If the obtained maximum statistic is either greater than 2.189228, or if it is less than −2.189228, reject the null hypothesis in favor of the alternative.
7. Discussion and Conclusions
The maximum test’s critical values were systematically lower than the Bonferroni-Dunn test and therefore the more powerful test, and were systematically larger than critical values for the t-test which controls the inflation of Experiment-Wise Type I errors when conducting both the dependent samples t and Wilcoxon signed-ranks test. The maximum test eliminates the need to make a forced choice between the dependent sample t-test and the WSR test when the distribution from which samples are drawn remain unknown, or are known to be non-normally distributed. The test permits the safe application of both the classical and non-parametric tests with the maximum of the two referred to the new table of critical values that are designed to maintain the Type I error rate to nominal α while guaranteeing the maximum power of the two tests. The maximum test also renders the Bonferroni-Dunn adjustment method unnecessary.
REFERENCES
[1] C. R. Blair, “Combining Two Nonparametric Tests of Location,” Journal of Modern Applied Statistical Methods, Vol. 1, No. 1, 2002, pp. 13-18.
[2] D. R. Cox, “The Role of Significance Tests,” Scandinavian Journal of Statistics, Vol. 4, No. 2, 1977, pp. 49-70.
[3] R. C. Blair and J. J. Higgins, “Comparison of the Power of the Paired Samples t test to that of Wilcoxon’s Sign-Ranks Test Under Various Population Shapes,” Psychological Bulletin, Vol. 97, No. 1, 1985, pp. 119-128.
[4] H. J. Arnold, “Small Sample Power of the One Sample Wilcoxon Test for Non-Normal Shift Alternatives,” The Annals of Mathematical Statistics, Vol. 36, No. 6, 1965, pp. 1767-
[5] R. Randles and D. Wolfe, “Introduction to the Theory of Nonparametric Statistics,” John Wiley & Sons, New York, 1979. [6] R. C. Blair and J. J. Higgins, “The Power of t and Wilcoxon Statistics: A Comparison,” Evaluation Review, Vol. 4, No. 5, 1980,
pp. 645-656
[7] T. A. Gerke and H. A. Randles, “A Method for Resolving Ties in Asymptotic Relative Efficiency,” Statistics and Probability Letter, Vol. 80, No. 13-14, 2010, pp. 1065-
[8] W. T. Wiederman and R. W. Alexandrowicz, “A Modified Normal Scores Test for Paired Data,” European Journal of Re- search Methods for the Behavioral and Social Sciences, Vol. 7, No. 1, 2011, pp. 25-38.
[9] S. S.Sawilowsky and G. F. Fahoome, “Statistics through Monte Carlo Simulation with FORTRAN,” Journal of Modern Ap-plied Statistical Methods Inc., Michigan, 2003.
[10] J. Algina, R. C. Blair and W. T. Coombs, “A Maximum Test for Scale: Type I Error Rates and Power,” Journal of Educational and Behavioral Statistics, Vol. 20, No. 1, 1995, pp. 27-39.
[11] L. H. C. Tippett, “The Methods of Statistics,” Williams and Norgate, England, 1934. [12] “International Mathematical and Statistical Libraries,” IMSL Library, Houston, 1980.
[13] S. S. Sawilowsky, R. C. Blair and J. J. Higgins, “An Investigation of the Type I Error and Power Properties of the Rank Trans- form in Factorial ANOVA,” Communications in Statistics, Vol. 14, No. 3, 1989, pp. 255-267.
[14] R. C. Blair and J. J. Higgins (unpublished, 1992) as referred to in S. S Sawilowsky and G. F. Fahoome, “Statistics through Monte Carlo Simulation with FORTRAN,” Journal of Modern Applied Statistical Methods Inc., Michigan, 2003.
[15] R. J. Simes, “An Improved Bonferroni Procedure for Multiple Tests of Significance,” Biometrika, Vol. 73, No. 3, 1986, pp.
751-754.
[16] Y. Hochberg, “A Sharper Bonferroni Procedure for Multiple Tests of Significance,” Biometrika, Vol. 75, No. 4, 1988, pp.
800-802.