ISSN: www.jatit.org E-ISSN:
SYMBOLIC DATA CONVERSION METHOD USING THE
KNOWLEDGE-BASED EXTRACTION IN ANOMALY
INTRUSION DETECTION SYSTEM
1JATUPHUM JUANCHAIYAPHUM,2*NGAMNIJ ARCH-INT, 3SOMJIT ARCH-INT, 4SAIYAN SAIYOD
123Semantic Mining Information Integration Laboratory (SMIIL)
4Hardware-Human Interface and Communications Laboratory (H2I-Comm)
Computer Science Department, Science Faculty, Khon Kaen University, Khon Kaen, Thailand, 40002 E-mail: [email protected] , 2*[email protected] , [email protected] , [email protected]
ABSTRACT
In anomaly intrusion detection systems, machine learning algorithms, e.g. KNN, SOM, and SVM, are widely used to construct a model of normal system activity that are designed to work with numeric data. Consequently, symbolic data (e.g., TCP, SMTP, FTP, OTH, etc.) need to be converted into numeric data prior to being analyzed. From the previous works, there were different methods proposed for handling the symbolic data; for example, excluding symbolic data, arbitrary assignment, and indicator variables. However, these methods may entail a very difficult classification problem, especially an increase of the dimensionality of data that directly affect the computational complexity of machine learning algorithm. Thus, this paper proposed a new symbolic conversion method in order to overcome limitations of previous works by replacing the symbolic data with their risk values, obtained from knowledge-based extraction. The experiments affirmed that our proposed method was more effective in improving the classifier performance than did the previous works, and it did not increase the dimensionality of data.
Keywords: Symbolic Conversion, Knowledge Extraction, Anomaly Detection, IDS, Machine Learning
1.INTRODUCTION
In order to ensure the accessibility, confidentiality, and integrity of data stored on the computer systems, an intrusion detection system (IDS) was designed to detect an unauthorized use of, or access to, computer system. There are two major categories existing for IDS including misuse and anomaly detections. Misuse detection systems utilized the information of prior attacks to search for the attack traces. One of the most common examples of these detections is signature-based systems. Anomaly detection systems construct a model of normal system activity and then consider the deviations from this model as a potential intrusion [1]. The key advantage of anomaly detection systems over signature-based misuse approaches is the ability in identifying the new attack patterns though signature did not exist.
To discover the knowledge in pattern recognition and network security, many machine learning algorithms provide a classification of intrusion attacks and normal network. In misuse detection system, some machine learning algorithms (e.g., Decision tree and Association
rule) are used to extract signatures of attack that process qualitative data naturally; meanwhile, in anomaly detection system, some algorithms (e.g., Artificial Neural Network: ANN, K-Nearest Neighbor: KNN, Self-Organizing Map: SOM and Support Vector Machine: SVM) are used to construct a model of normal system activity. However, the success of these algorithms is based on the selection of a set of significant features taken out from the network traffic data stream [2]. These features can be either numeric or symbolic data. The examples of the numeric data include time duration (0, 4070, 58329, etc.) and number of data bytes (147, 739, 2463, etc.); and of the symbolic data are protocol type (ICMP, TCP and UDP), service type (HTTP, SMTP, FTP, etc.) and connection status flag (OTH, REJ, RSTO, etc.). As most of the algorithms are used to classify anomaly intrusion that work with numeric data, the symbolic data need to be transformed into numeric data prior to being analyzed in an anomaly detection system.
ISSN: www.jatit.org E-ISSN: proposed in [3], the arbitrary assignment (the
symbolic data is mapped into sequential integer value or converting the category name to a decimal number by adding the ASCII values of all its characters) suggested in [4-8] and the indicator variables (converting the symbolic data into numeric data using means score of a binary coding scheme) proposed in [2, 9]. Still, there are these method contains several limitations. Firstly, some features such as protocol type, service type, and connection status flag, are very important for the classification methods, so excluding these features may decrease the efficiency of the classification. Secondly, if reasonable values are disregarded, the arbitrary assignment may lead to a very difficult classification problem; a proper assignment may greatly reduce the complexity of the problem [2]. Finally, conversion of features to the indicator variables may increase the dimensionality of data and this fact may cause the problems to the classifier due to an increase of computational time, CPU usage, and memory usage.
In order to overcome these limitations, this paper proposed the symbolic conversion method using knowledge-based method to replace a symbolic feature with their risk values obtained from knowledge-based extraction. Since the network traffic contains a large number of different symbolic feature categories, the manual conversion of these features to the numeric data is time consuming. Consequently, we extracted the risk values from a large network traffic data, such as the Knowledge Discovery and Data mining 1999 data set (KDD’99). KDD’99 which has been broadly used as a benchmark in the network intrusion detection experiments. In other words, KDD’99 contains the information and previous work of the experts in the system security; therefore, our proposed method could replace the symbolic features with reasonable numeric value without increasing the dimensionality of data.
More details were discussed in each section. Section 2 described how to handle the symbolic features, as section 3 illustrated the certain steps of the proposed method. The experimental setup and results of our method were given in section 4. Finally, the study's conclusion was discussed in section 5.
2.RELATEDWORKS
Symbolic features are common in network traffic data stream. Nevertheless, most machine learning algorithms (such as KNN, SOM and SVM) are designed to work with numeric data. In case that these methods utilized the information from the symbolic features in detection, some coding schemes or conversion are also exploited. The commonly used one is the excluding symbolic feature that can be analyzed without the symbolic features. As this method was being criticized, three approaches for this codification were proposed and explained in the following sub-sections.
2.1Arbitrary Assignment
[image:2.595.362.452.404.539.2]Arbitrary assignment is a method of mapping each category into sequential integer values, or renaming the symbolic value category to a decimal number by adding the ASCII values of all its characters. Table 1 presents the results obtained from arbitrary assignment that applied in [8].
Table 1: The Result Of The Connection Status Flag Conversion With Arbitrary Assignment [8]
flag value
SF 0
S0 1
S3 2
REJ 3
RSTO 4
S1 5
S2 6
RSTR 7
SH 8
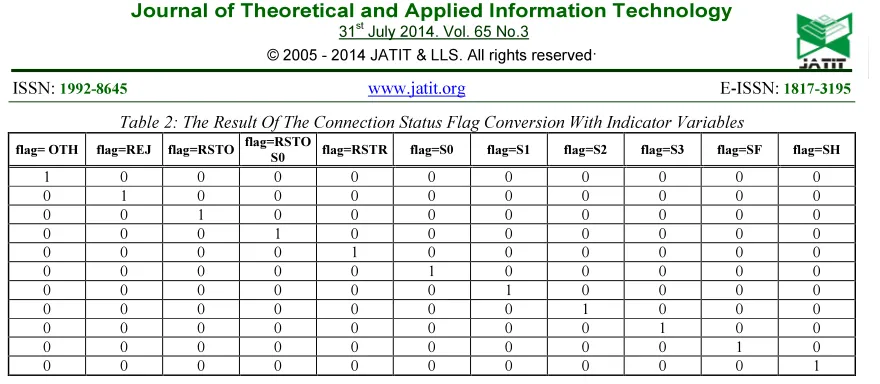
2.2Indicator Variables
ISSN: www.jatit.org E-ISSN:
Table 2: The Result Of The Connection Status Flag Conversion With Indicator Variables
flag= OTH flag=REJ flag=RSTO flag=RSTO
S0 flag=RSTR flag=S0 flag=S1 flag=S2 flag=S3 flag=SF flag=SH
1 0 0 0 0 0 0 0 0 0 0
0 1 0 0 0 0 0 0 0 0 0
0 0 1 0 0 0 0 0 0 0 0
0 0 0 1 0 0 0 0 0 0 0
0 0 0 0 1 0 0 0 0 0 0
0 0 0 0 0 1 0 0 0 0 0
0 0 0 0 0 0 1 0 0 0 0
0 0 0 0 0 0 0 1 0 0 0
0 0 0 0 0 0 0 0 1 0 0
0 0 0 0 0 0 0 0 0 1 0
0 0 0 0 0 0 0 0 0 0 1
As shown in Table 2, the dimensionality of data was increased, directly proportional to the number of the symbolic feature categories.
2.3Combination Of Arbitrary Assignment And Indicator Variables
In order to overcome the limitation of arbitrary assignment and indicator variables, the combination of these methods was applied in [2, 9]. The clustering technique using the domain knowledge was used to reduce the number of variables by grouping similar values into a few numbers of necessary categories before creating indicator variables. For example, Table 3 shows service types that were grouped into eight clusters classified by their usages. Table 4 shows the connection status flag grouped into five clusters classified by their natures of the connections. Each feature was converted to label depending on its cluster before creating indicator variables.
Table 3: Cluster of service features [2, 9]
Label Description
S1 Services used to get the remote access of another machine (e.g., telnet, ssh).
S2 Services used in file and document transfer (e.g., ftp, tftp).
S3 Services used in mail transfer (e.g., smtp, imap4).
S4 Services used in web application (e.g., http). S5 Services used to get system parameters and
statistics (e.g., systat, netstat).
S6 Services used in name servers (e.g., hostname, domain).
[image:3.595.298.514.283.559.2]S7 Services used in ICMP protocol. S8 Other.
Table 4: Cluster of flag features [2, 9]
Label Variable Description
F1 S0 Connection attempt seen, no reply REJ Connection attempt rejected
F2
S1 Connection established but not terminated
SF Normal establishment and termination
OTH No SYN seen, just midstream traffic
F3
S2 Connection established and close attempt seen by originator
RSTO Connection established, originator aborted
F4
S3 Connection established and close attempt seen by responder
RSTR Connection established, responder aborted
F5
RSTOS0
Originator sent a SYN followed by a RST, SYN, ACK not seen by the responder
SH
Originator sent a SYN followed by a FIN, SYN, ACK not seen by the responder
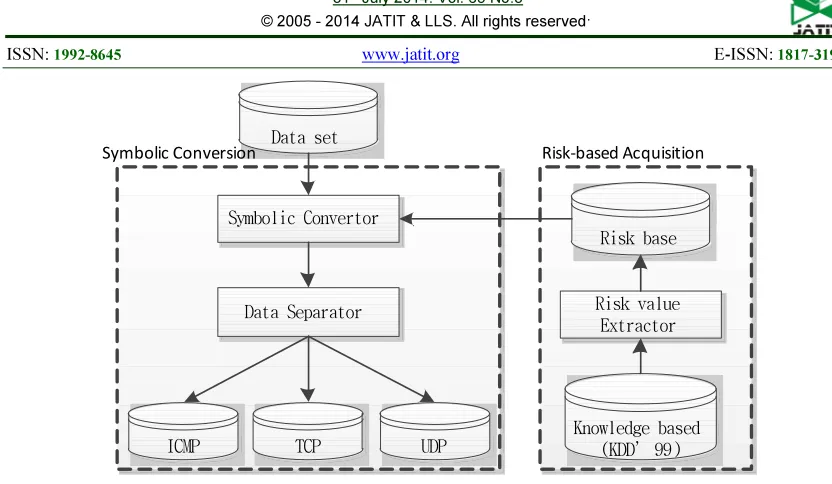
3.METHODOLOGY
ISSN: www.jatit.org E-ISSN:
Data set
ICMP TCP UDP
Symbolic Convertor
Knowledge based (KDD’ 99) Data Separator
Risk base
Risk value Extractor
Risk-based Acquisition Symbolic Conversion
Figure 1: The Process Of Symbolic Conversion Method
3.1Risk-based Acquisition
This paper intended to replace the symbolic data with numeric data using knowledge of security domain. Since the symbolic data (such as protocol type, service type and connection status flag) can distinguish the types of anomaly intrusions, these features can reflect the risk of intrusion. This process was designed to extract the risk value from the knowledge-based such as KDD’99 which consists of 1074992 unique connection records, and, hence, all risk values were collected and stored in Risk base. The risk value can be obtained from the following equation.
(1)
[image:4.595.85.501.88.330.2]As is risk value of the symbolic value, , is the normal class and is the number of categories of the symbolic.
Table 6 presents the risk values of service types and Table 5 shows the risk values of the connection status flag that were obtained from Risk-based Acquisition process.
Table 5: Risk value of connection status flag
flag risk flag risk flag risk
OTH 0.729 RSTR 0.882 S3 0.08
REJ 0.519 S0 0.998 SF 0.016
RSTO 0.886 S1 0.008 SH 0.993
RSTOS0 1 S2 0.05
[image:4.595.305.500.372.598.2]
Table 6: Risk value of service type
service risk service risk service risk
aol 1 echo 1 hostnames 1
auth 0.31 eco_i 0.8 http 0.01
bgp 1 ecr_i 0.87 http_2784 1
courier 1 efs 1 http_443 1
csnet_ns 1 exec 1 http_8001 1
ctf 1 finger 0.27 imap4 1
daytime 1 ftp 0.26 IRC 0
discard 1 ftp_data 0.06 iso_tsap 1
domain 0.96 gopher 1 klogin 1
domain_u 0 harvest 1 kshell 1
ldap 1 nntp 1 rje 1
link 1 ntp_u 0 shell 1
login 1 other 0.12 smtp 0.01
mtp 1 pm_dump 1 sql_net 1
name 1 pop_2 1 ssh 1
netbios_dgm 1 pop_3 0.53 sunrpc 1
netbios_ns 1 printer 1 supdup 1
netbios_ssn 1 private 0.97 systat 1
netstat 1 red_i 0 telnet 0.48
nnsp 1 remote_job 1 tftp_u 0
time 0.88 uucp 1 X11 0.04
tim_i 0.33 uucp_path 1 Z39_50 1
urh_i 0 vmnet 1 urp_i 0
whois 1
3.2Symbolic Conversion
This process consists of two parts as follows: •Symbolic convertor: This part was designed to replace the symbolic features (such as service type and connection status flag) with risk values from the Risk-based data.
•Data separator: Each sample of a data set was grouped into 3 groups classified by its protocol typed such as ICMP, TCP and UDP.
3.3Limitation of the proposed method
[image:4.595.305.499.376.595.2]ISSN: www.jatit.org E-ISSN: with risk values. To solve this issue, the new
features are replaced with the arithmetic mean of risk values in the Risk-based data.
4.EXPERIMENT
In this section, we present a performance analysis of the proposed method. The well-known KDD’99 and NSL-KDD were used as a benchmark. Each data set was classified using three machine learning algorithms: KNN, SOM, and SVM. KNN and SVM were computed using WEKA 3.7.10 [12]. SOM was computed using Orange 2.7 [13].
4.1Data set
We have selected two data subsets from the Knowledge Discovery and Data mining 1999 data set (KDD’99) [14] which contains 44,911 connection records and NSL-KDD data set [15], an improved version of KDD’99, which contains 25,192 connection records. Each dataset consists of 41 features. In order to evaluate and compare our method against related the previous works under the same conditions, we applied the data set into three groups as follows:
•KDD I and NSL-KDD I: The data set was processed without symbolic features such as protocol type, service type, and connection status flag, which consists of 38 features.
•KDD II and NSL-KDD II: The data set converted the symbolic feature by the proposed method as presented in [2, 9] consisting of 54 features.
•KDD (Proposed) and NSL-KDD (Proposed): The data set converted the symbolic features by the proposed method, which consists of 40 features.
4.2 Experimental setup
We used a classification strategy along with 10-fold cross validation method to produce the final classification results in terms of normal or intrusion. The experiment was conducted using a machine with an Intel Core i7 3.40 GHz and 7.89 GB of RAM running with Windows 7 SP1. The configuration of each classifier was illustrated as follows:
•KNN: the number of neighbor is one, the nearest neighbor search obtained from equation(2) [16].
(2)
The samples are described by attributes. •SOM: a hexa type of topology, with 100 epoch time, a dimension size of 10 x 10, the best matching unit obtained from equation (3), and a
topological neighborhood function obtained from equation (4).
(3) As is referred to winning unit, is weight vector and is input vector.
(4)
As is the lateral distance between neuron and on the grid of neurons, is the scope of the neighborhood.
•SVM: C-SVM of SVM type, and kernel type with Radial Basis Function (RBF) obtained from equation (5)
(5)
4.3Performance metrics
[image:5.595.233.494.494.762.2]To evaluate the detection performance of different symbolic conversion methods, five widely used performance metrics viz., the detection rate (DR, also known as the true positive rate or sensitivity), precision (PR), F-score, false positive rate (FPR, also known as a false alarm rate), and accuracy (ACC), were applied and these metrics could be calculated using the confusion matrix as presented in Table 7 These metrics are defined as follows:
Table 7: Confusion Matrix
Actual class
Predicted class
Negative class (Normal)
Positive class (Attack)
Negative class (Normal)
True negative (TN)
False positive (FP)
Positive class (Attack)
False negative (FN)
True positive (TP)
(6)
(7)
(8)
(9)
ISSN: www.jatit.org E-ISSN: 4.4Results and discussion
The primary aim of this study was to propose a new method to convert the symbolic data into numeric data in order to improve the outcome of particular classification methods. This work was not to compare the effects of the classification method, but to demonstrate the symbolic conversion effect on the classifier performance.
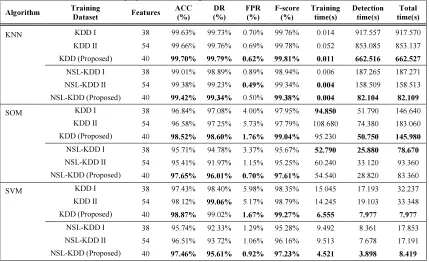
In this section, we evaluated the performance of our proposed method and compared the outcome with the previous works. Table 8 described the classification results and computational times of the three methods, obtained with KNN, SOM and SVM
in the attack recognition phase. The comparison was conducted on the performance of these classifiers in terms of their ACC, DR, FPR and F-score.
[image:6.595.87.516.295.557.2]The results indicated that our proposed method had a more positive effect on the classifier performance than did method II (the combination between the arbitrary assignment and indicator variables) and method I (the excluding symbolic features). More importantly, our method required a shorter period of the computational times compared with method I, and method II.
Table 8: The overall detection performance, training, and detection times obtained with KNN, SOM, and SVM
Algorithm Training
Dataset Features
ACC (%)
DR (%)
FPR (%)
F-score (%)
Training time(s)
Detection time(s)
Total time(s)
KNN KDD I 38 99.63% 99.73% 0.70% 99.76% 0.014 917.557 917.570
KDD II 54 99.66% 99.76% 0.69% 99.78% 0.052 853.085 853.137
KDD (Proposed) 40 99.70% 99.79% 0.62% 99.81% 0.011 662.516 662.527
NSL-KDD I 38 99.01% 98.89% 0.89% 98.94% 0.006 187.265 187.271
NSL-KDD II 54 99.38% 99.23% 0.49% 99.34% 0.004 158.509 158.513
NSL-KDD (Proposed) 40 99.42% 99.34% 0.50% 99.38% 0.004 82.104 82.109
SOM KDD I 38 96.84% 97.08% 4.00% 97.95% 94.850 51.790 146.640
KDD II 54 96.58% 97.25% 5.73% 97.79% 108.680 74.380 183.060
KDD (Proposed) 40 98.52% 98.60% 1.76% 99.04% 95.230 50.750 145.980
NSL-KDD I 38 95.71% 94.78% 3.37% 95.67% 52.790 25.880 78.670
NSL-KDD II 54 95.41% 91.97% 1.15% 95.25% 60.240 33.120 93.360
NSL-KDD (Proposed) 40 97.65% 96.01% 0.70% 97.61% 54.540 28.820 83.360
SVM KDD I 38 97.43% 98.40% 5.98% 98.35% 15.045 17.193 32.237
KDD II 54 98.12% 99.06% 5.17% 98.79% 14.245 19.103 33.348
KDD (Proposed) 40 98.87% 99.02% 1.67% 99.27% 6.555 7.977 7.977
NSL-KDD I 38 95.74% 92.33% 1.29% 95.28% 9.492 8.361 17.853
NSL-KDD II 54 96.51% 93.72% 1.06% 96.16% 9.513 7.678 17.191
NSL-KDD (Proposed) 40 97.46% 95.61% 0.92% 97.23% 4.521 3.898 8.419
5.CONCLUSION
In this paper, we have proposed a new method of the symbolic data conversion in anomaly intrusion detection by utilizing the knowledge-based to replace a symbolic feature with the risk values. This study was conducted with an aim to improve the newly proposed method to be compared with those suggested in the previous works, so we used the two well-known data sets, KDD’99 and NSL-KDD as a benchmark of the classifier’s performances, in which each data set was classified using three machine learning algorithms i.e. KNN, SOM, and SVM. Finally, the experiments affirmed that our proposed method was more effective in improving the classifier
performance than did the previous works, and it did not increase the dimensionality of data.
As future work, we plan to apply our method into the hybrid intrusion detection system to detect the attacks in a real-world environment.
REFRENCES:
[1] C.-F. Tsai, Y.-F. Hsu, C.-Y. Lin, and W.-Y. Lin, "Intrusion detection by machine learning: A review," Expert Systems with Applications, vol. 36, pp. 11994-12000, 2009.
ISSN: www.jatit.org E-ISSN: comparison applied to an intrusion detection
problem," Expert Systems with Applications, vol. 36, pp. 10612-10617, 2009.
[3] Z. Ma, "Reason for Hierarchical Self Organized Map-Based Intrusion Detection System Incapable of Increasing Detection Rate," in Information Engineering and Electronic Commerce, 2009. IEEC '09. International Symposium on, 2009, pp. 150-154.
[4] H. Gunes Kayacik, A. Nur Zincir-Heywood, and M. I. Heywood, "A hierarchical SOM-based intrusion detection system," Engineering Applications of Artificial Intelligence, vol. 20, pp. 439-451, 2007.
[5] O. Depren, M. Topallar, E. Anarim, and M. K. Ciliz, "An intelligent intrusion detection system (IDS) for anomaly and misuse detection in computer networks," Expert Systems with Applications, vol. 29, pp. 713-722, 2005. [6] M. M. Alsulaiman, A. N. Alyahya, R. A.
Alkharboush, and N. S. Alghafis, "Intrusion Detection System using Self-Organizing Maps," in Network and System Security, 2009. NSS'09. Third International Conference on, 2009, pp. 397-402.
[7] F. Amiri, M. Rezaei Yousefi, C. Lucas, A. Shakery, and N. Yazdani, "Mutual information-based feature selection for intrusion detection systems," Journal of Network and Computer Applications, vol. 34, pp. 1184-1199, 2011.
[8] A. Aneetha and S. Bose, "THE COMBINED APPROACH FOR ANOMALY DETECTION
USING NEURAL NETWORKS AND
CLUSTERING TECHNIQUES," Computer Science & Engineering, vol. 2, 2012.
[9] M.-L. Shyu, K. Sarinnapakorn, I. Kuruppu-Appuhamilage, S.-C. Chen, L. Chang, and T. Goldring, "Handling nominal features in anomaly intrusion detection problems," in Research Issues in Data Engineering: Stream Data Mining and Applications, 2005. RIDE-SDMA 2005. 15th International Workshop on, 2005, pp. 55-62.
[10]S. Garavaglia and A. Sharma, "A smart guide to dummy variables: four applications and a macro," in Proceedings of the Northeast SAS Users Group Conference, 1998.
[11]J. Neter, W. Wasserman, and M. H. Kutner, Applied linear statistical models vol. 4: Irwin Chicago, 1996.
[12]M. Hall, E. Frank, G. Holmes, B. Pfahringer, P. Reutemann, and I. H. Witten, "The WEKA data mining software: an update," ACM SIGKDD Explorations Newsletter, vol. 11, pp. 10-18, 2009.
[13]Janez Demšar , Tomaž Curk, Aleš Erjavec, Črt
Gorup, Tomaž Hočevar, Mitar Milutinovič, et
al., "Orange: Data Mining Toolbox in Python," Journal of Machine Learning Research, vol. 14, pp. 2349-2353, 2013.
[14]S. Hettich and S. D. Bay. (1999, 06.08.13). The UCI KD. Available: http://kdd.ics.uci.edu/data bases/ kddcup99/kddcup99.html
[15]M. Tavallaee, E. Bagheri, W. Lu, and A.-A. Ghorbani, "A detailed analysis of the KDD CUP 99 data set," in Proceedings of the Second
IEEE Symposium on Computational
Intelligence for Security and Defence Applications 2009, 2009.
![Table 1: The Result Of The Connection Status Flag Conversion With Arbitrary Assignment [8]](https://thumb-us.123doks.com/thumbv2/123dok_us/8912481.960045/2.595.362.452.404.539/table-result-connection-status-flag-conversion-arbitrary-assignment.webp)