Research on Minimum Energy Excited to Plasma Coating
for Reducing Radar Cross Section of Target
Dan Cheng1, 2, *, Hong-Cheng Yin3, and Hong-Xing Zheng2
Abstract—To reduce the radar cross section (RCS) of a target, plasma coating on perfectly electric conducting plate is studied in this paper. Nonuniform helium plasma produced by a minitype solid rocket engine is with collisional and unmagnetized. Energy excited for generating helium plasma is investigated. Based on the collisional, unmagnetized, and cold plasma model, backscattering RCS is computed by using finite-difference time-domain method. Principle of RCS reduction is explained. To find minimum input energy while RCS reduced, relationship between input power and RCS reduction is discussed, and numerical optimization is also implemented. We can identify optimal parameters and choose the best electron density profile under condition of given input power level.
1. INTRODUCTION
Stealth aircraft design tends to make use of special surface shape or microwave-absorbing coating, sometimes, of both to reduce the radar cross section (RCS). However, these techniques may not be effective in some situations where the use is for a wide-band radar wave frequency [1]. Since 1990s, plasma stealth technology has been paid attention to [2–9]. It is found that inhomogeneous plasma behaves as frequency selective medium and can be used as a broadband absorbing layer in general shielding and military stealth applications [2]. For complex target surfaces on ship and aircraft, the geometry model can be divided into some simple parts approximately to analyze the RCS at the beginning. These parts, such as flat plate, cone frusta, spheroid and edge, etc., have been modeled isolately. The target response to the radar wave is dependent upon a limited number of individual parts. We can focus on these responses of our attention instead of the composite target. Here, we choose a perfectly electric conducting (PEC) plate coated with plasma as an investigated target. Helium plasma is produced by a minitype solid rocket engine. Electron density profile affects the reflection, absorption and transmission of the electromagnetic energy in plasma for such application. In literature, different electron density functions are considered such as exponential, parabolic, steepened, hyperbolic, tangent, sinusoidal and exponential with time variation [4–6, 8]. In laboratory, we use the spatial distribution of plasma electron density which is measured for illustration [10]. So it is very important to find a theoretical model to suit for the electron density profile. Another important issue is that the energy required to sustain the plasma must be concerned [2, 7]. It is significant to use minimum energy to produce plasma coating for reducing the RCS of target. To calculate the electromagnetic wave propagation in plasma, the finite-difference time-domain (FDTD) method is adopted [3, 8, 9].
In this paper, the electromagnetic wave interaction with nonuniform plasma is studied. The FDTD method used in collisional, unmagnetized, cold plasma is introduced in Section 2. Numerical experiment is verified. To validate the proposed model, bistatic RCS of a PEC plate coated with plasma is calculated in Section 3. The principle of RCS reduction is explained. In the case of minimum RCS, Section 4
Received 25 January 2016, Accepted 19 February 2016, Scheduled 9 March 2016
* Corresponding author: Dan Cheng (chengdan [email protected]).
1 Information Engineering School, Communication University of China, Beijing 100024, China. 2Institute of Antenna and Microwave
36 Cheng, Yin, and Zheng
involves numerical study to determine the minimum input power. The best-suited electron density profile is discussed. Finally, important conclusions are obtained.
2. METHODOLOGY
2.1. FDTD Method in Collisional, Unmagnetized, Cold Plasma
The complex relative dielectric constant for plasma is [11]
εr(ω) =εr(ω)−jεr(ω) = 1− ω
2
p
ω2+υ2 −j
υ ω
ω2p
ω2+υ2 (1)
where ωp = Nee2/ε0me is the plasma frequency, Ne the plasma electron density, e the electron
charge,methe electron mass,ε0 the free-space permittivity, andωthe angular frequency of the incident
electromagnetic wave. Here we use the continuous wave, sinusoidal function as incident source, and υ is the electron momentum-transfer collision rate.
When the frequency of incident wave is a constant, the plasma can be regarded as a lossy dielectric. The FDTD calculation needs to know the dielectric constant ε and electrical conductivity σ of every cell. The equations are given in [12], and we have
ε = ε0− e
2N
e
me(ω2+υ2) (2)
σ = Nee
2υ
me(ω2+υ2) (3)
where the collision rate υ is also constant, and εand σ only depend on the variation of Ne. IfNe is a
variable, the plasma is nonuniform. Furthermore, the plasma that we discuss is unmagnetized, so the equivalent magnetic loss σm = 0. Thus we can use the conventional FDTD method to calculate the
electromagnetic fields in collisional, unmagnetized, cold, nonuniform plasma.
2.2. Numerical Experiment
The plasma can be taken as a lossy dielectric when the incident frequency is a constant. To validate the method used in plasma, we calculate the bistatic RCS of a lossy dielectric cube. The edge length of the cube is 0.5 m, and the relative permittivity is εr = 2.0−j0.5. A 750 MHz x-direction polarized
plane electromagnetic wave is incident from the−z-direction, andθis used to denote the angle between incident direction and z-axis. Figure 1 shows the bistatic RCS of the dielectric cube for E plane and H plane. We can see that most of the calculated results agreed well with the volume integral equation (VIE) method solution [13] except for some weak scattering region. The validity of the FDTD method that we used is verified.
3. PEC PLATE COATED WITH NONUNIFORM PLASMA
3.1. Numerical Results
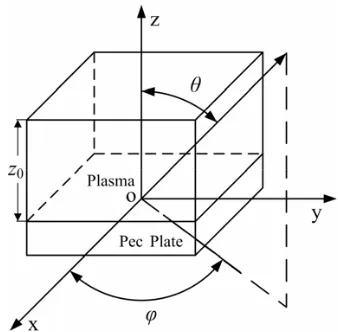
A square PEC plate with side length of 40 mm and thickness of 4 mm, located inx-yplane, is coated with a 60 mm thick plasma shroud. A 10 GHz x-direction polarized plane electromagnetic wave is incident from the −z-direction. The coordinate system can be seen in Figure 2.
We assume that the plasma is produced by a minitype solid rocket engine in helium gas. Different nonuniform plasma flow fields can be generated by choosing different engine parameters and propellants. The electron density distributions measured with electrostatic probe are given in [10]. The measured results show that the electron density is approximately Gaussian distributed as shown in Equation (4), and we have
Ne(z) =Ne0exp
−z2/L2 (4)
whereNe0is the peak electron density andLthe gradient scale length. Here, we setNe0 = 1.1×10¹⁷/m3,
Figure 1. Bistatic RCS of the dielectric cube. Figure 2. The coordinate system of PEC plate covered with nonuniform plasma. The electron density has a Gaussian variation in thez-direction and uniform distribution in the x-y plane.
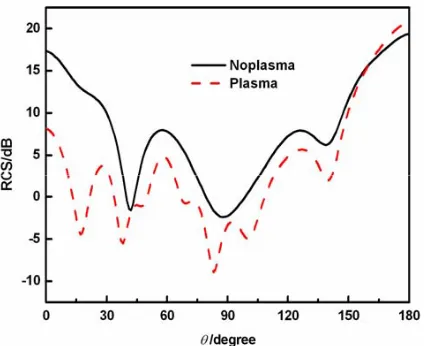
a plasma shroud. We can see that there is an obvious RCS reduction from θ = 0◦ to 90◦, where the plate is covered with plasma. The largest reduction of 8.21 dB is obtained in the backscatter direction, and forward scattering is a little increased compared with that of the unshielded plate.
3.2. Attenuation of Electromagnetic Waves in Plasma
From Figure 3, we can see that significant backscatter RCS reduction is achieved. In this part, we will analyze the principle of the electromagnetic wave attenuation in plasma.
According to Equation (1), we can find the propagation constantkfor an electromagnetic wave in collisional plasma
k=k0
εr(ω) =kr+jki (5)
where k0 is propagation constant in free space, and kr and ki are the real and imaginary parts of the
propagation constant, respectively. The electron-ion and electron-neutral collisions cause the existence of the imaginary part of the propagation constant, and the imaginary part describes the attenuation rate when electromagnetic wave propagates in the plasma. For an electromagnetic wave which enters the plasma atz=z0, propagates to the PEC plate at z= 0, and then returns through the plasma, the
net reflected power in the plasma is estimated by
Pn =P0exp
−4Im
0
z0
k(z)dz (6)
whereP0 is the power incident on the vacuum-plasma interface.
The double-pass attenuation of the electromagnetic wave is
Att(dB) =10 lgP(z0) P0
=17.36Im
0
z0
k(z)dz (7)
Consequently, the reduction of the received power is mainly due to the absorption of electromagnetic wave in plasma, and the RCS of target is also reduced.
4. THE RELATIONSHIP BETWEEN INPUT POWER AND RCS
38 Cheng, Yin, and Zheng
part, the relationship between the input power and RCS reduction will be discussed, and numerical optimization will be implemented.
An approximation for the power per unit volume required to sustain plasma is [2]
P/V = NeEi
τ (8)
where P is the continuous-wave power deposited in plasma, V the plasma volume, Ei the energy to
generate an electron-ion pair, and τ the plasma lifetime. The power per unit volume for noble gas plasma reduces to
P/V =KrNe2Ei (9)
where Kr is the two-body recombination rate constant. Vidmar [2] has shown that plasma lifetimes in a noble gas are much longer than in air, which reduces the power requirement significantly. As an example, a plasma withNe = 1017/m3at 760 torr in air, the plasma lifetime is 10 ns;Ei is 33.7 eV;P/V is 54 MW/m3 for impact ionization. However, P/V in helium gas under the same condition as that in air is only 672 W/m3. So the power optimization study is implemented assuming that the plasma is produced in helium gas by a minitype solid rocket engine. The electron density in +z direction is approximately Gaussian distribution as shown in Equation (4). We adjust Ne0 and L to discuss the
relationship between the input power and the reduction in RCS.
Figure 3. Bistatic RCS versus angle θ for the PEC plate with and without a plasma shroud.
Figure 4. Electron density variation in +z -direction whileL= 0.01, 0.03, 0.05, 0.07, 0.09 m, respectively.
4.1. Plasma-Coated PEC Plate
Here, we consider the same plasma-coated PEC plate as depicted in Section 3.1. The geometric model is also shown in Figure 2. The incident wave frequency is equal to 10 GHz, and the effective collision rate is 1.85×10¹¹Hz. In order to make electromagnetic wave of different frequencies be absorbed or refracted in plasma,Ne0 is varied from 2×10¹⁷/m3 to 2.9×10¹⁸/m3, with an increment of 3×10¹⁷/m3.
Five discussed L values are 0.01, 0.03, 0.05, 0.07, and 0.09 m, respectively. So there are 50 parameter sets needing to be considered.
Figure 5. Backscatter RCS reduction versus input power while scale length L = 0.01, 0.03, 0.05, 0.07, 0.09 m, respectively for plasma-coated PEC plate.
Figure 6. Bistatic RCS of the PEC plate without plasma and the PEC plate with plasma shroud after optimization.
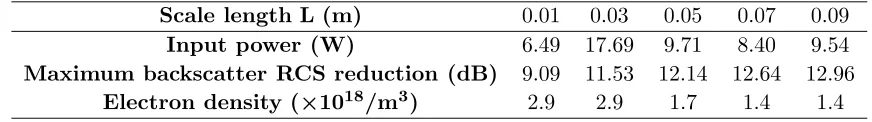
Table 1. Corresponding parameters for different electron density profiles.
Scale length L (m) 0.01 0.03 0.05 0.07 0.09
Input power (W) 6.49 17.69 9.71 8.40 9.54
Maximum backscatter RCS reduction (dB) 9.09 11.53 12.14 12.64 12.96
Electron density (×1018/m3) 2.9 2.9 1.7 1.4 1.4
The bistatic RCSs for all 50 sets have been calculated. The difference between the backscatter RCSs for the PEC plate with and without plasma is defined as RCS reduction. Figure 5 shows the RCS reduction versus input power required, corresponding to fiveLvalues. We can see that the backscatter RCS reductions are not simply monotone increasing as the input power increasing, but increase with input power up to optimal points, and then show some tendency to saturate, except for the conditions L = 0.01 m and L = 0.03 m. That is because of the limitation of the peak density. Moreover, as L increases, backscatter RCS decreases. In real-life system, the electron density distribution is nonuniform in order to make plasma absorbing or refracting the electromagnetic wave of different frequencies. Therefore, the bigger size theLis, the smaller RCS is obtained under the condition that the requirement of absorption frequency range is satisfied.
The corresponding parameters of different electron density profiles are shown in Table 1. The results at L = 0.07 m and L = 0.09 m are better than others, while the peak electron densities are both 1.4×10¹⁸/m3. Comparing two cases, 8.4 W input power can get RCS reduction of 12.64 dB while L= 0.07 m, and 9.54 W input power can get RCS reduction of 12.96 dB whileL= 0.09 m. Although the obtained RCS reduction corresponding toL= 0.09 m is greater than that corresponding toL= 0.07 m, the required input power per unit RCS reduction whileL= 0.07 m is less than that while L= 0.09 m. Thus, the optimal values are Ne0 = 1.4×10¹⁸/m3 and L= 0.07 m. The corresponding bistatic RCS is
shown in Figure 6. A reduction of 12.64 dB in the backscattering direction is obtained.
4.2. Plasma-Coated PEC Sphere
40 Cheng, Yin, and Zheng
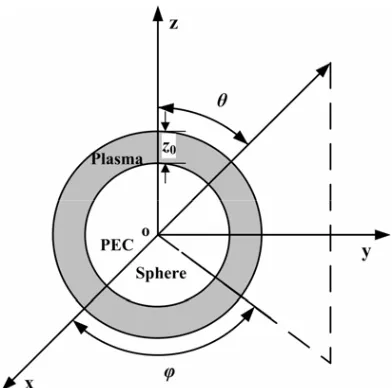
Figure 7. The coordinate system of PEC sphere covered with nonuniform plasma. The electron density has a Gaussian variation along radial axis.
(a) (b)
(e)
Figure 8. Backscatter RCS reduction versus input power required corresponding to fiveLvalues while the frequencies of incident wave are 5, 7, 12 and 15 GHz, respectively for plasma-coated PEC sphere. (a)f = 5 GHz, (b)f = 7 GHz, (c) f = 10 GHz, (d)f = 12 GHz, (e)f = 15 GHz.
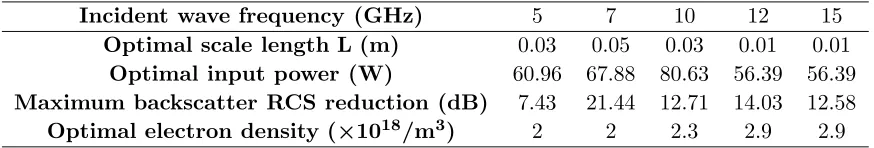
Table 2. The optimal values for corresponding incident wave frequencies.
Incident wave frequency (GHz) 5 7 10 12 15
Optimal scale length L (m) 0.03 0.05 0.03 0.01 0.01
Optimal input power (W) 60.96 67.88 80.63 56.39 56.39
Maximum backscatter RCS reduction (dB) 7.43 21.44 12.71 14.03 12.58
Optimal electron density (×1018/m3) 2 2 2.3 2.9 2.9
required corresponding to five L values while the frequencies of incident wave are 5, 7, 10, 12 and 15 GHz, respectively. The calculated results can be seen in Figure 8. From it, we can see that the tendencies of the backscatter RCS reduction versus input power required are almost the same while the incident wave frequencies are different. The backscatter RCS reductions are not simply monotone increasing as the input power increasing, but increase with input power up to optimal points, and then show some tendency to decrease, or show some tendency to saturate, except the condition L = 0.01. That is also because of the limitation of the peak density.
From Figure 8 we can also see that the optimal values are different while the frequencies are different. According to the analysis in Section 4.1, we can get optimal values for corresponding incident wave frequencies which can be seen in Table 2. It can be found that the optimal electron density increases as the incident wave frequency increases. The maximum backscatter RCS reduction while f = 7 GHz is much greater than others. That is because the attenuation of incident wave in different frequency is different in plasma.
5. CONCLUSION
42 Cheng, Yin, and Zheng
ACKNOWLEDGMENT
This work was supported by the National Natural Science Foundation of China, the Science Research and Development Foundation of Tianjin University of Technology and Education, China, the Natural Science Foundation of Tianjin Municipality, China, and the Excellent Young Teachers Program of Tianjin, China, under Grant 61371043, KJ14-38, 14JCQNJC0110, and RC14-39, respectively.
REFERENCES
1. Knott, E. F., J. F. Shaeffer, and M. T. Tuley, Radar Cross Section, Scitech Publ. Inc., Raleigh, NC, 2004.
2. Vidmar, R. J., “On the use of atmospheric pressure plasma as electromagnetic reflectors and absorbers,”IEEE Trans. on Plasma Science, Vol. 18, No. 4, 733–741, 1990.
3. Yang, L. X., Y. T. Xie, and P. P. Yu, “Study of bandgap characteristics of 2D magnetoplasma photonic crystal by using M-FDTD method,” Microwave and Optical Technology Letters, Vol. 53, No. 8, 1778–1784, 2011.
4. Tang, D. L., A. P. Sun, X. M. Qiu, and K. Chu, “Interaction of electromagnetic waves with a magnetized nonuniform plasma slab,” IEEE Trans. on Plasma Science, Vol. 31, No. 3, 405–410, 2003.
5. Liu, M., X. Hu, Z. Jiang, S. Zhang, C. Lan, and Y. Pan, “Reflection of a wave from a thin plasma layer attached to a metal plate by finite-difference time-domain analysis,” Plasma Sources Sci. Technol., Vol. 16, 614–618, 2007.
6. Zobdeh, P., R. Sadighi-Bonabi, H. Afarideh, E. Yazdani, and R. Rezaei Nasirabad, “Using the steepened plasma profile and wave breaking threshold in laser-plasma interaction,” Contributions to Plasma Phys., Vol. 48, 555–560, 2008.
7. Gurel, C. S. and E. Oncu, “Frequency selective characteristics of a plasma layer with sinusoidally varying electron density profile,”Int. J. Infrared Millimeter Waves, Vol. 30, 589–597, 2009. 8. Chaudhury, B. and S. Chaturvedi, “Study and optimization of plasma-based radar cross section
reduction using three-dimensional computations,”IEEE Trans. on Plasma Science, Vol. 37, No. 11, 2116–2127, 2009.
9. Liu, J. F., X. L. Xi, G. B. Wan, and L. L. Wang, “A high efficient SO-FDTD method for magnetized collisional plasma,”Journal of Electromagnetic Waves and Applications, Vol. 26, Nos. 14–15, 1911– 1921, 2012.
10. Zeng, X. J., P. Ma, Z. F. Yu, Z. J. Wang, X. Y. Ma, and J. Li, “Experimental investigation and analysis on jet-plasma stealth in air surroundings,” Journal of Experiments in Fluid Mechanics, Vol. 22, No. 1, 49–54, 2008 (in Chinese).
11. Heald, M. A. and C. B. Wharton,Plasma Diagnositics with Microwaves, Krieger, New York, 1978. 12. Howatson, A. M.,An Introduction to Gas Discharges, Pergamon, New York, 1976.
13. Bakir, O., “Domain decomposition based hybrid methods for solving real-life electromagnetic scattering and radiation problems,” Ph. D. Thesis, University of Michigan, 2012.