International Journal of COPD
Dove
press
O r I g I n a l r e s e a r C h
open access to scientific and medical research
Open access Full Text article
Differential changes in quality of life components
over 5 years in chronic obstructive pulmonary
disease patients
Katsura nagai1
hironi Makita1
Masaru suzuki1
Kaoruko shimizu1
satoshi Konno1
Yoichi M Ito2
Masaharu nishimura1
On behalf of the
hokkaido COPD Cohort study Investigators 1First Department of Medicine, hokkaido University school of Medicine, 2Department
of Biostatistics, hokkaido University graduate school of Medicine, sapporo, Japan
Background: The aim of the study was to examine the longitudinal change in quality of life components of patients with chronic obstructive pulmonary disease (COPD).
Methods: In the Hokkaido COPD Cohort Study, 261 subjects were appropriately treated and followed over 5 years with a 74% follow-up rate at the end. The longitudinal changes in St George’s Respiratory Questionnaire (SGRQ) scores were annually evaluated with forced expiratory volume in 1 second (FEV1). The subjects were classified into the rapid decliners, slow decliners, and sustainers based on ΔFEV1/year.
Results: The activity component of SGRQ generally deteriorated over time, and its annual decline was the greatest in the rapid decliners (25th percentile). In contrast, the symptom component improved significantly year by year in the sustainers (75 percentile), and it did not deteriorate even in the rapid decliners. Of the baseline data, predictors for worsening of the activity component were older age and lower body mass index. Larger reversibility was related to symptom component improvement. Of the follow-up data, ΔFEV1/year was the best predictor for worsening of the components of SGRQ. Continuous smoking was another factor for worsening of the activity component. For the symptom component, a history of exacerbation by admission definition was the determinant of its deterioration, whereas use of beta agonists was related to improvement.
Conclusion: The longitudinal changes of quality of life and their determinants are markedly different and independent between its components. The activity component of SGRQ generally deteriorated over years, while the symptom component rather improved in some patients with COPD under appropriate treatment.
Keywords: annual change, forced expiratory volume in 1 second, SGRQ, smoking, exacerbation
Introduction
Health-related quality of life (QOL) is being recognized as an important outcome when evaluating patients with chronic obstructive pulmonary disease (COPD). Factors such as dyspnea, depression, anxiety, and exercise tolerance have been reported to be better correlated with health status than the widely-used spirometric values.1
Generally, COPD results in progressive worsening of QOL over time. It is well known that the cross-sectional studies have shown that the correlation of pulmo-nary function represented by forced expiratory volume in 1 second (FEV1) with the St George’s Respiratory Questionnaire (SGRQ) total score is significant but weak in patients with COPD.2 The SGRQ is a standardized, self-completed questionnaire for
measuring impaired health and perceived well-being and QOL in chronic airways disease.3,4 The total score of the SGRQ consists of three components: symptoms,
measuring the frequency and severity of respiratory symptoms; activity, measuring
Correspondence: Masaharu nishimura First Department of Medicine, hokkaido University school of Medicine n-15 W-7, Kita-Ku, sapporo 060-8638, Japan Tel +81 11 706 5911
Fax +81 11 706 7899
email [email protected]
Journal name: International Journal of COPD Article Designation: Original Research Year: 2015
Volume: 10
Running head verso: Nagai et al
Running head recto: Quality of life components over 5 years in COPD DOI: http://dx.doi.org/10.2147/COPD.S77586
International Journal of Chronic Obstructive Pulmonary Disease downloaded from https://www.dovepress.com/ by 118.70.13.36 on 22-Aug-2020
For personal use only.
This article was published in the following Dove Press journal: International Journal of COPD
13 April 2015
Dovepress
nagai et al
limitation of activities by breathlessness and activities that cause breathlessness; and impacts, measuring disturbances in social and psychological functioning due to COPD. Thus, the total score summarizes the effect of the disease on overall health status. Recently, accumulating data have suggested that longitudinal annual changes in FEV1 are more variable than generally thought in patients with COPD when they are advised to quit smoking and are adequately treated.5–7
We indeed demonstrated that there are even “sustainers”
who maintained their FEV1 over 5 years in the Hokkaido
COPD Cohort Study.6 Despite such wide individual
varia-tions in the annual change in FEV1, there have been very few studies examining longitudinal annual changes in QOL in relation to changes in FEV1 over 5 years.8 In one particular
study from the Understanding Potential Long-term Impacts on Function with Tiotropium (UPLIFT®) trial,9 the authors
did not examine the three component scores of the SGRQ in relation to lung function decline. The SGRQ total score generally deteriorated overall as pulmonary function declined over 4 years.
In this study, we hypothesized that the longitudinal change in SGRQ scores would be different and indepen-dent between its components, and if that was the case, such differences would be more markedly seen when patients were classified based on the annual changes in FEV1. We thus examined the longitudinal changes of SGRQ scores, particularly focusing on its components over 5 years in the subjects of the Hokkaido COPD Cohort Study, where they were classified into rapid decliners, slow decliners, and sustainers, depending on annualized ΔFEV1. In addition, we sought to find predictors and/or determinants of annual changes of SGRQ component scores at baseline and during 5-year follow-up. The main results of the Hokkaido COPD Cohort Study have already been published.6
Methods
study protocol
The details of the study protocol of the Hokkaido COPD Cohort Study have been reported previously.6 Briefly, all
COPD patients were recruited at Hokkaido University Hos-pital and nine affiliated hosHos-pitals from May 2003 to May 2005. A total of 279 subjects were diagnosed with COPD by spirometry (stage 1: n=72 [26%], 2: n=126 [45%], 3: n=68 [24%], and 4: n=13 [5%]) and their eligibility con-firmed for subsequent follow-up.10 The Ethics Committee
of Hokkaido University School of Medicine approved the study protocol (med02-001), and written informed consent was obtained from all participants. Most subjects visited
outpatient clinics at each hospital monthly or bimonthly. All subjects were advised to participate in the follow-up study every 6 months for the following 5 years (from visit one to eleven). Patients were appropriately treated at each physician’s discretion and were continuously encouraged to stop smoking. Daily physical activity was recommended, but the subjects did not participate in an intensive rehabili-tation program. Assessments of exacerbations during the study were described in detail previously.6,11,12 Physicians,
clinical research coordinators, and paramedical staff ensured that patients were in a stable condition at each visit. When an exacerbation of COPD occurred within 1 month of a scheduled visit, the assessment was postponed for 1 month until the patient recovered. QOL assessed by the SGRQ was evaluated every year, including the first visit. Further details of the procedures are provided in the supplementary materials.
subjects
In order to analyze the association between pulmonary func-tion decline and the annual change in QOL, all subjects who had at least three spirometric measurements, as in the previ-ous report, were eligible for this analysis (n=261).6 Patients
were classified into the three groups as rapid FEV1 decliners (25th percentile, -63±2 mL/year: mean ± standard error), slow FEV1 decliners (25th–75th percentile, -31±1 mL/ year), and FEV1 sustainers (75th percentile, -2±1 mL/ year), as defined in our previous publication.
statistics
Summary statistics for subject characteristics are presented using frequencies and proportions for categorical data and means ± standard deviation for continuous quantitative variables. Tukey’s post hoc test was used for comparing quantitative continuous variables among the three groups when results were significant on one-way analysis of vari-ance. Annual changes in SGRQ scores were analyzed by a linear mixed-effects model for each group, taking into account dropouts (fixed effect = year, random effect = id, id×year: interaction term between id and year).13 The
dependent variable was the annual SGRQ score (two to six data points for each subject). Additionally, the changes in SGRQ scores estimated by a mixed-effects model were compared among the three groups classified by annualized ΔFEV1 for each year. To identify which variables at base-line were predictive of changes in SGRQ total scores at 5 years, unadjusted and adjusted linear mixed-effects models were created (fixed effect = year and variables
International Journal of Chronic Obstructive Pulmonary Disease downloaded from https://www.dovepress.com/ by 118.70.13.36 on 22-Aug-2020
Dovepress Quality of life components over 5 years in COPD
35
Frequency (subjects)
30 25 20 15 10
–10 –8
Improvement Deterioration
–6 –4 –2 0 2 4 6 8 10 12 14 16
5
35
Frequency (subjects)
30 25 20 15 10
–10 –12
–14 –8
Improvement Deterioration
–6 –4 –2 0 2 4 6 8 10
5
A
B
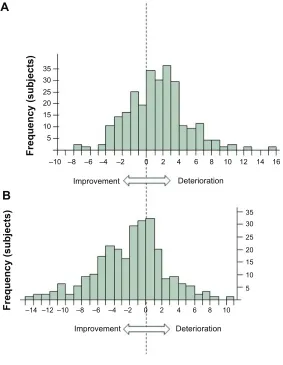
Figure 1 The frequency distributions of the annual change in sgrQ (units/year).
Notes: The calculated annual change in the sgrQ activity score is 1.22±3.53 (mean ± sD) (A), symptom score is -1.96±4.22 (B).
Abbreviation: sgrQ, st george’s respiratory Questionnaire; sD, standard deviation.
as below, interaction effects between year and variables; random effect = id, id×year). Variables at baseline for adjusted model were selected based on the P-value less than 0.05 by unadjusted model. The variables at baseline of the linear mixed-effects analysis fixed-effects portion of the model were age, sex, body mass index (BMI), current smok-ing status at entry, pack-years, cough and sputum, modified Medical Research Council (mMRC) dyspnea scale (0–4), postbronchodilator forced vital capacity, postbronchodila-tor FEV1, reversibility (%), diffusing capacity for carbon monoxide (DLco), white blood cell counts, eosinophils, C reactive protein, and immunoglobulin E. Variables during the follow-up periods were also analyzed by unadjusted and adjusted mixed-effects models with interaction effects within a particular group. Variables during the follow-up periods were annual decline in FEV1, annual decline in DLco, smok-ing behavior, change in BMI, exacerbation (by the admission definition), and the use of respiratory medicine. The subjects
were classified into three groups based on the quartile (25th, 75th percentile) values of the annual changes in DLco and BMI. All the variables during the follow-up periods were used for adjusted model. Use of respiratory medicine for more than half of the entire follow-up period was considered to be positive use. A P0.05 was considered significant. All analyses were conducted with JMP 10.0 (SAS Institute Inc., Cary, NC, USA).
Results
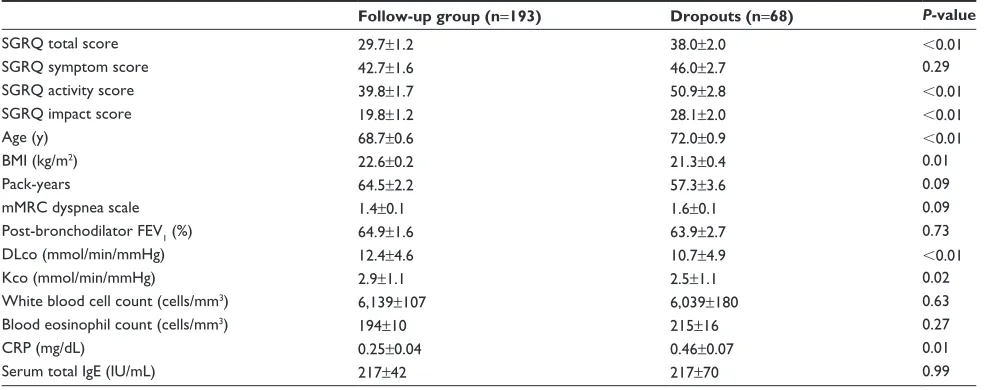
The demographic data of the dropouts (68 subjects) are shown in Table S1.
The calculated annual change in the SGRQ total score (units/year) was 0.06±2.64 (Figure S1). The frequency distributions of the annual changes in SGRQ activity and symptom component scores are shown in Figure 1A and B, which illustrate how these two component scores change differently over time. There were subjects with improvement
International Journal of Chronic Obstructive Pulmonary Disease downloaded from https://www.dovepress.com/ by 118.70.13.36 on 22-Aug-2020
Dovepress
nagai et al
(negative number) and deterioration (positive number) of annual change in SGRQ scores. In other words, it revealed that a large number of subjects showed improvement in their symptom score under appropriate treatment, even though many subjects showed deterioration in their activ-ity score.
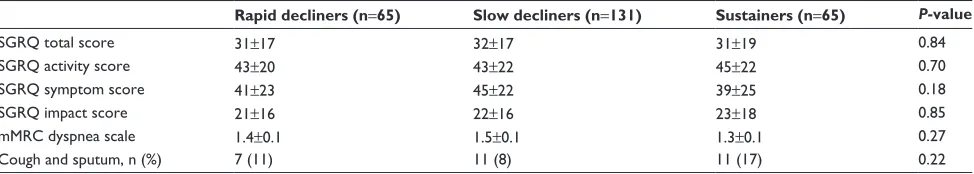
The association between pulmonary function decline and the annual change in SGRQ was also analyzed. At baseline, there were no significant differences in spirometric data, smoking status (Table S2), and the total score or each com-ponent score of the SGRQ (Table S3) among the three groups classified by annualized ΔFEV1, as described previously. During the follow-up period, smoking status, exacerbation frequency, and medication did not differ among the three groups.6 A brief extract of study protocol taken from the
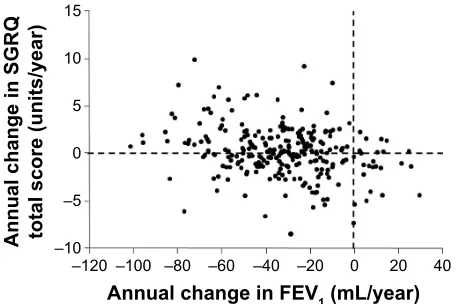
origi-nal manuscript is shown in supplementary material. Annual change in SGRQ total score was weakly but significantly correlated with the annualized ΔFEV1 (mL/year) (r=-0.27,
P0.001, n=261) despite the absence of differences in SGRQ total score at baseline among the three groups classified by annualized ΔFEV1 (Figure 2). It is noteworthy that 110 subjects (42%) improved their SGRQ total score, even if the annualized ΔFEV1 decreased over 5 years (lower left square marked with dotted lines in Figure 2).
The changes from baseline in the SGRQ scores at each year were compared among the three groups classified by annualized ΔFEV1. The change from baseline in the SGRQ total score demonstrated clinically significant deterioration in rapid FEV1 decliners, whereas there was clinically signifi-cant improvement in FEV1 sustainers at 4-year follow-up (rapid FEV1 decliners ΔSGRQ 5±2, slow FEV1 decliners
±
±
± ± ± ± ±
$QQXDOFKDQJHLQ)(9P/\HDU
$QQXDOFKDQJHLQ6*54 WRWDOVFRUHXQLWV\HDU
±
Figure 2 The relationship between the annual change in postbronchodilator FeV1.
Note: The annual change in sgrQ total score is negatively correlated with the annual change in FeV1 (r=-0.27, P0.001, n=261).
Abbreviations: FeV1, forced expiratory volume in 1 second; sgrQ, st george’s
respiratory Questionnaire.
0±1, FEV1 sustainers -4±2) and at 5-year follow-up (rapid FEV1 decliners ΔSGRQ 5±2, slow FEV1 decliners 0±1, FEV1 sustainers -4±2) (Figure 3A). Significant differences were noted between the changes in rapid FEV1 decliners and FEV1 sustainers at both 4-year and 5-year follow-ups (P0.001 for both). The SGRQ activity score deteriorated significantly in rapid FEV1 decliners relative to slow FEV1 decliners and FEV1 sustainers at both 4-year follow-up (P=0.016, P=0.023, respectively) and 5-year follow-up (P=0.005, P0.001, respectively) (Figure 3B). The SGRQ
symptom score improved more in FEV1 sustainers than in
rapid FEV1 decliners at 4 years (P=0.001) and at 5 years (P=0.023) (Figure 3C). At 5-year follow-up, the SGRQ impact score was significantly better in FEV1 sustainers than in rapid FEV1 decliners (P=0.005) and slow FEV1 decliners (P=0.038) (Figure 3D).
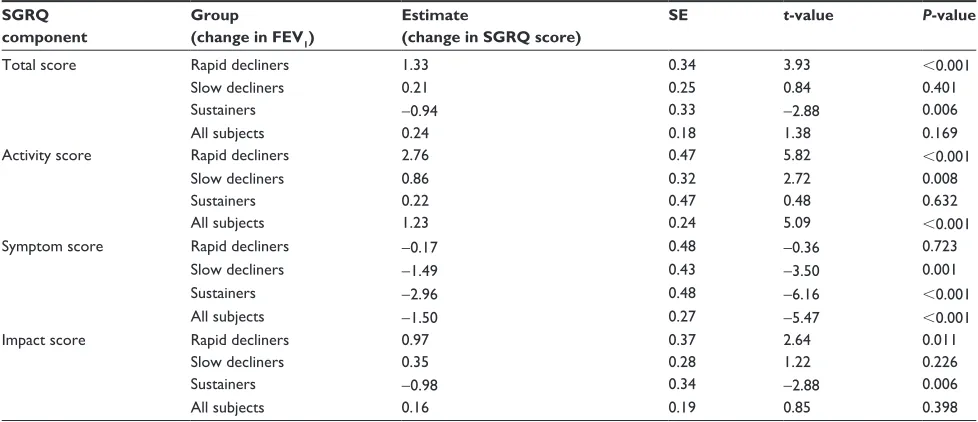
Looking at each group classified by annualized ΔFEV1, annual changes in the total and the three component scores of the SGRQ showed that the total score deteriorated sig-nificantly over 5 years in rapid FEV1 decliners (estimate 1.33 score/year, P0.001), while that in subjects with sustained FEV1 improved during this period (estimate -0.94 score/year, P=0.006) (Table 1). The SGRQ activity score deteriorated significantly in rapid FEV1 decliners and slow FEV1 decliners over 5 years (P0.001, P=0.008, respectively), while the SGRQ symptom score showed sig-nificant improvements in slow decliners and in sustainers of annualized ΔFEV1 (P=0.001, P0.001, respectively). It is noted that the SGRQ activity score in subjects with sustained FEV1 did not show deterioration (P=0.632). In contrast, the SGRQ symptom score in subjects with rapid FEV1 decliners did not show improvement (P=0.723). The SGRQ impact score deteriorated significantly in rapid FEV1 decliners (P=0.011), while that in subjects with sustained FEV1 improved (P=0.006).
The predictors at baseline for longitudinal worsening in the SGRQ were older age and lower BMI for the activity score (Table 2). The predictors at baseline for longitudinal improvement in the SGRQ were larger reversibility (%) and female sex for the symptom score (Table 2). The results of predictors at baseline for total and impact score of SGRQ are shown in Tables S4 and S5.
When follow-up variables were used, decline in FEV1
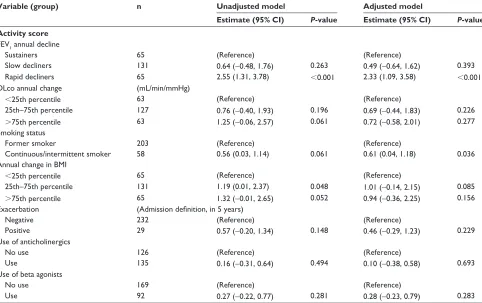
was the predictor for deterioration in the SGRQ total and three component scores at 5 years (Tables 3, 4, S6 and S7). In addition, the predictor during the 5-year follow-up period for worsening of the activity score of the SGRQ was continu-ous smoking (Table 3). In contrast, the predictor during the
International Journal of Chronic Obstructive Pulmonary Disease downloaded from https://www.dovepress.com/ by 118.70.13.36 on 22-Aug-2020
Dovepress Quality of life components over 5 years in COPD
3
3
3
3
3
±
&KDQJHLQ6*54DFWLYLW\ VFRUHIURPEDVHOLQHXQLWV IROORZXS\HDU IROORZXS\HDU IROORZXS\HDU IROORZXS\HDU IROORZXS\HDU
3 3
3
±
±
±
±
&KDQJHLQ6*54LPSDFW VFRUHIURPEDVHOLQHXQLWV \HDU
IROORZXS IROORZXS\HDU IROORZXS\HDU IROORZXS\HDU IROORZXS\HDU
3 3
±
± ±
±
&KDQJHLQ6*54V\PSWRP VFRUHIURPEDVHOLQHXQLWV
\HDU
IROORZXS IROORZXS\HDU IROORZXS\HDU IROORZXS\HDU IROORZXS\HDU 5DSLG)(9GHFOLQHUV 3 3
±
± \HDU IROORZXS
&KDQJHLQ6*54WRWDO
VFRUHIURPEDVHOLQHXQLWV
\HDU
IROORZXS IROORZXS\HDU IROORZXS\HDU IROORZXS\HDU 6ORZ)(9GHFOLQHUV
)(9VXVWDLQHUV
5DSLG)(9GHFOLQHUV 6ORZ)(9GHFOLQHUV )(9VXVWDLQHUV
5DSLG)(9GHFOLQHUV 6ORZ)(9GHFOLQHUV )(9VXVWDLQHUV
5DSLG)(9GHFOLQHUV 6ORZ)(9GHFOLQHUV )(9VXVWDLQHUV
$
%
&
'
Figure 3 The changes in the total and three component scores of the sgrQ during follow-up.
Notes: Annual changes in the total score of SGRQ from baseline classified by annual change in FEV1 (ml/year) during follow-up; The change from baseline in the sgrQ total
score (mean ΔsgrQ ± se) at 4-year follow-up: ΔsgrQ in rapid FeV1 decliners, 5±2; slow FeV1 decliners, 0±1, or FeV1 sustainers, -4±2, and at 5-year follow-up: ΔsgrQ in rapid FeV1 decliners, 5±2; slow FeV1 decliners, 0±1; or FeV1 sustainers, -4±2 (A). annual changes in the activity scores (B), symptom scores (C), and impact scores (D) of the SGRQ classified by annual change in postbronchodilator FEV1 (ml/year) during follow-up are shown. P-values represent one-way analysis of variance with post hoc comparisons using Tukey’s multiple comparison tests at each year.
Abbreviations: FeV1, forced expiratory volume in 1 second; sgrQ, st george’s respiratory Questionnaire; ΔsgrQ, change from baseline in the sgrQ; se, standard
error.
Table 1 Annual changes in the total and three component scores of SGRQ classified by annual rates of decline in FEV1 during follow-up SGRQ
component
Group (change in FEV1)
Estimate
(change in SGRQ score)
SE t-value P-value
Total score rapid decliners 1.33 0.34 3.93 0.001
slow decliners 0.21 0.25 0.84 0.401
sustainers -0.94 0.33 -2.88 0.006
all subjects 0.24 0.18 1.38 0.169
activity score rapid decliners 2.76 0.47 5.82 0.001
slow decliners 0.86 0.32 2.72 0.008
sustainers 0.22 0.47 0.48 0.632
all subjects 1.23 0.24 5.09 0.001
symptom score rapid decliners -0.17 0.48 -0.36 0.723
slow decliners -1.49 0.43 -3.50 0.001
sustainers -2.96 0.48 -6.16 0.001
all subjects -1.50 0.27 -5.47 0.001
Impact score rapid decliners 0.97 0.37 2.64 0.011
slow decliners 0.35 0.28 1.22 0.226
sustainers -0.98 0.34 -2.88 0.006
all subjects 0.16 0.19 0.85 0.398
Notes: The changes in the SGRQ score of each group were analyzed using a linear mixed-effects model (fixed effects = year; random effects = id, id×year); estimate: a positive
value means annual deterioration of sgrQ, a negative value means annual improvement of sgrQ.
Abbreviations: FeV1, forced expiratory volume in 1 second; se, standard error; sgrQ, st george’s respiratory Questionnaire.
International Journal of Chronic Obstructive Pulmonary Disease downloaded from https://www.dovepress.com/ by 118.70.13.36 on 22-Aug-2020
Dovepress
nagai et al
Table 3 results of linear mixed-effects models to identify which variables during follow-up were predictive of the annual change in sgrQ activity scores at 5 years
Variable (group) n Unadjusted model Adjusted model
Estimate (95% CI) P-value Estimate (95% CI) P-value Activity score
FeV1 annual decline
sustainers 65 (reference) (reference)
slow decliners 131 0.64 (-0.48, 1.76) 0.263 0.49 (-0.64, 1.62) 0.393
rapid decliners 65 2.55 (1.31, 3.78) 0.001 2.33 (1.09, 3.58) 0.001
Dlco annual change (ml/min/mmhg)
25th percentile 63 (reference) (reference)
25th–75th percentile 127 0.76 (-0.40, 1.93) 0.196 0.69 (-0.44, 1.83) 0.226
75th percentile 63 1.25 (-0.06, 2.57) 0.061 0.72 (-0.58, 2.01) 0.277
smoking status
Former smoker 203 (reference) (reference)
Continuous/intermittent smoker 58 0.56 (0.03, 1.14) 0.061 0.61 (0.04, 1.18) 0.036
annual change in BMI
25th percentile 65 (reference) (reference)
25th–75th percentile 131 1.19 (0.01, 2.37) 0.048 1.01 (-0.14, 2.15) 0.085
75th percentile 65 1.32 (-0.01, 2.65) 0.052 0.94 (-0.36, 2.25) 0.156
exacerbation (Admission definition, in 5 years)
negative 232 (reference) (reference)
Positive 29 0.57 (-0.20, 1.34) 0.148 0.46 (-0.29, 1.23) 0.229
Use of anticholinergics
no use 126 (reference) (reference)
Use 135 0.16 (-0.31, 0.64) 0.494 0.10 (-0.38, 0.58) 0.693
Use of beta agonists
no use 169 (reference) (reference)
Use 92 0.27 (-0.22, 0.77) 0.281 0.28 (-0.23, 0.79) 0.283
Abbreviations: BMI, body mass index; CI, confidence interval; DLco, diffusing capacity for carbon monoxide; FEV1, forced expiratory volume in 1 second; sgrQ,
st george’s respiratory Questionnaire.
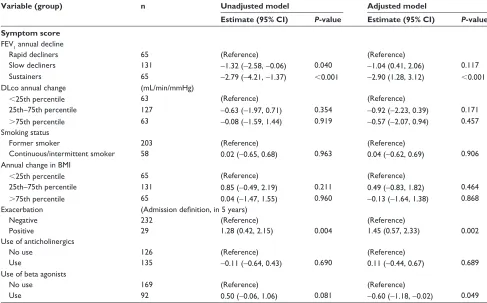
5-year follow-up period for improvement in the symptom score of the SGRQ was use of beta agonists (Table 4). The hospitalizations due to exacerbations of COPD did not affect the annual change in SGRQ activity score; however, it sig-nificantly deteriorated that in SGRQ symptom score.
Discussion
In this study, the annual change in SGRQ total score showed significant deterioration in rapid FEV1 decliners over 5 years, whereas FEV1 sustainers showed apparent improvement. Longitudinal differences from baseline values in the three Table 2 results of unadjusted and adjusted linear mixed-effects models to identify which variables at baseline were predictive of the annual change in sgrQ activity and symptom scores at 5 years
Variable Unadjusted model Adjusted model
Estimate (95% CI) P-value Estimate (95% CI) P-value
Activity score
age* 0.86 (0.02, 0.15) 0.001 0.73 (0.00, 0.14) 0.031
BMI -0.21 (-0.36, -0.06) 0.005 -0.17 (-0.34, -0.02) 0.032
Dlco (ml/min/mmhg) -0.15 (-0.25, -0.05) 0.003 -0.06 (-0.18, 0.06) 0.357
Symptom score
age† 0.82 (0.01, 0.15) 0.001 0.63 (-0.01, 0.14) 0.104
sex (male)# 1.42 (0.26, 2.56) 0.016 1.60 (0.46, 2.74) 0.006
reversibility (%)‡ -0.44 (-0.08, -0.04) 0.030 -0.56 (-0.10, -0.02) 0.005
Dlco (ml/min/mmhg) -0.12 (-0.24, -0.01) 0.030 -0.11 (-0.23, 0.01) 0.074
Notes: *analyzed in units of 10 years; ‡analyzed in units of 10%; #246 males: 15 females; Unadjusted and adjusted linear mixed-effects models were performed to test for
the influence of variables at baseline on the slope of the annual change in SGRQ scores at 5 years (fixed effect = year, variables as follows, and interaction effects between years and variables; random effect = id, id×year). Variables age, sex, BMI, current smoking status at entry, pack-years, cough and sputum, mMrC dyspnea scale (0–4), postbronchodilator FVC, postbronchodilator FeV1, reversibility (%), Dlco, WBC, eosinophils, CrP, and Ige.
Abbreviations: BMI, body mass index; CI, confidence interval; CRP, C reactive protein; DLco, diffusing capacity for carbon monoxide; FEV1, forced expiratory volume in
1 second; FVC, forced vital capacity; IgE, immunoglobulin E; mMRC, modified Medical Research Council; SGRQ, St George’s Respiratory Questionnaire; WBC, white blood
cell counts.
International Journal of Chronic Obstructive Pulmonary Disease downloaded from https://www.dovepress.com/ by 118.70.13.36 on 22-Aug-2020
Dovepress Quality of life components over 5 years in COPD
Table 4 results of linear mixed-effects models to identify which variables during follow-up were predictive of the annual change in sgrQ symptom scores at 5 years
Variable (group) n Unadjusted model Adjusted model
Estimate (95% CI) P-value Estimate (95% CI) P-value Symptom score
FeV1 annual decline
rapid decliners 65 (reference) (reference)
slow decliners 131 -1.32 (-2.58, -0.06) 0.040 -1.04 (0.41, 2.06) 0.117
sustainers 65 -2.79 (-4.21, -1.37) 0.001 -2.90 (1.28, 3.12) 0.001
Dlco annual change (ml/min/mmhg)
25th percentile 63 (reference) (reference)
25th–75th percentile 127 -0.63 (-1.97, 0.71) 0.354 -0.92 (-2.23, 0.39) 0.171
75th percentile 63 -0.08 (-1.59, 1.44) 0.919 -0.57 (-2.07, 0.94) 0.457
smoking status
Former smoker 203 (reference) (reference)
Continuous/intermittent smoker 58 0.02 (-0.65, 0.68) 0.963 0.04 (-0.62, 0.69) 0.906
annual change in BMI
25th percentile 65 (reference) (reference)
25th–75th percentile 131 0.85 (-0.49, 2.19) 0.211 0.49 (-0.83, 1.82) 0.464
75th percentile 65 0.04 (-1.47, 1.55) 0.960 -0.13 (-1.64, 1.38) 0.868
exacerbation (Admission definition, in 5 years)
negative 232 (reference) (reference)
Positive 29 1.28 (0.42, 2.15) 0.004 1.45 (0.57, 2.33) 0.002
Use of anticholinergics
no use 126 (reference) (reference)
Use 135 -0.11 (-0.64, 0.43) 0.690 0.11 (-0.44, 0.67) 0.689
Use of beta agonists
no use 169 (reference) (reference)
Use 92 0.50 (-0.06, 1.06) 0.081 -0.60 (-1.18, -0.02) 0.049
Notes: Unadjusted and adjusted linear mixed-effects models were used to test for the influence of variables during follow-up on the slope of the annual change in the SGRQ
scores at 5 years (fixed effect = year, variables as below, and interaction effects between years and variables; random effect = id, id×year); estimate: the annual difference in sgrQ scores compared with reference group. a positive value means annual deterioration of sgrQ, a negative value means annual improvement of sgrQ.
Abbreviations: BMI, body mass index; CI, confidence interval; DLco, diffusing capacity for carbon monoxide; FEV1, forced expiratory volume in 1 second; sgrQ,
st george’s respiratory Questionnaire.
component scores, as well as the total score, became signifi-cant in the 4th and 5th years. However, quite impressively, the component scores changed in an opposite direction over the follow-up period. When annual change in SGRQ was examined in the three groups classified by annualized ΔFEV1, these groups generally demonstrated improvement, not deterioration, in the symptom score. Particularly in FEV1 sustainers, the improvement was marked and significantly better than in rapid FEV1 decliners. In contrast, all of these groups showed deterioration in the activity score, with rapid FEV1 decliners showing the most deterioration. To the best of our knowledge, this is the first study to show that the longitudinal changes in SGRQ activity and symptom scores occurred in opposite directions over the long-term in patients with COPD who were adequately treated, although there have been some studies that stated that the activity score of the SGRQ was more useful than the other scores.14,15
There have been several longitudinal observation stud-ies of the three components of SGRQ classified by smok-ing status, medication, or pre- and postrehabilitation.8,16–21
Improvement of QOL in patients with COPD is not surpris-ing at all in the short-term and, indeed, has been repeatedly reported as a result of optimal treatment.21–24 For example,
even in a 1-year follow-up study, there was clinically rel-evant improvement in QOL in one-third of primary care patients.25 Such improvement may be due to intervention
by optimal treatment after the subjects are recruited into the study. Optimal treatment includes cessation of smoking and adequate medication based on advice from medical staff. In this study, the mean differences in the SGRQ total score between FEV1 sustainers and rapid FEV1 decliners from baseline at the 4th and 5th years were greater than the mini-mum clinically important difference.26–28 Considering that
there were no differences in baseline characteristics among the three groups, decline in FEV1 seems to be an important factor affecting patients’ QOL.
Adherence to regular visits to a pulmonologist may also be an important factor that may be associated with a better feeling of coping with their own illness and/or a sense of safety as a result of regular visits.20 Whatever reason, it is of
International Journal of Chronic Obstructive Pulmonary Disease downloaded from https://www.dovepress.com/ by 118.70.13.36 on 22-Aug-2020
Dovepress
nagai et al
note that only the symptom score, but not the activity score, improved over 5 years in the present study. Some of the clini-cal trials showed that the symptom component showed a rapid effect, but the activity domain was less improved.19,21 Because
the activity score worsened over the same follow-up period, improvement of the symptom score could not simply be ascribed to time-related biases in patients’ sensations. Rather, it should be considered that symptoms may be better or stable at least over a period of years if COPD is adequately treated. Moreover, a linear mixed-effects model with an interaction effect indicated that predictors for SGRQ improvement in the symptom component over time were larger reversibility with beta agonists and continuous use of beta agonists. This is very good news for some patients with COPD, together with the fact that there are “sustainers” who can maintain pulmonary function over 5 years. Unfortunately, there is a common belief that COPD results in generally progressive deterioration in QOL, as well as pulmonary function.
It has been reported that the longitudinal rate of decline in FEV1 correlated with the rate of decline in the SGRQ total8,9,20,21 and three component scores.21 We should pay
special attention to older patients with advanced airflow limi-tation, especially those with less reversibility and low BMI.29
The analysis of follow-up factors revealed that the annual change in the total SGRQ score deteriorated by 1.12 per year in slow FEV1 decliners and by 2.28 in rapid FEV1 decliners compared to FEV1 sustainers.
The exacerbation frequency observed in this study was much lower than in most studies previously reported from other parts of the world.12 Despite that, the exacerbation rate
by hospital admission definition was one of the determinants for SGRQ worsening in this study. Actually, even the very low frequency of exacerbations (0.06±0.20 events/person/year; by hospital admission definition) provided sufficient power to detect a significant clinical difference.12
It must be noted that there are several limitations in this study. First, the subjects were mostly men, and thus the results of this study may not necessarily be true for women. Another limitation is that the information about exercise and psychological status was not obtained. Besides, mMRC dyspnea scale was evaluated only at the baseline. Effects of pharmacotherapy on the longitudinal change of QOL, particularly that of inhaled corticosteroids, might not have been accurately assessed because only 14% of the subjects used inhaled corticosteroids during the 5 year study period in this study. Finally, only three kinds of comorbidities were analyzed at entry. Thus, the actual effects of comorbidities on longitudinal changes in QOL may have not been well studied. Despite these limitations, we believe that the different and
independent changes in QOL component scores over 5 years found in this study could highlight new aspects of the natural history of COPD when it is adequately treated.
In conclusion, the longitudinal changes of QOL and their determinants are markedly different and independent between its components. The activity component of SGRQ generally deteriorated over years, while the symptom com-ponent, rather, improved in some patients with COPD under appropriate treatment. We should pay more attention to vari-ous aspects of QOL over time in daily clinical settings and/ or future clinical trials.
Acknowledgments
The authors would like to thank Hideka Ashikaga, Ayako Kondo, and Yuko Takagi at the Central Office of the Hokkaido COPD Cohort Study, the staff of Exam Co., Ltd., and the medical doctors, nurses, and technicians in all hospitals involved in the study for their assistance in completing this work.
The Hokkaido COPD Cohort Study is supported by a scientific research grant from the Ministry of Educa-tion, Science, Culture and Sports of Japan (2424904903), Nippon Boehringer Ingelheim, Pfizer Inc., and a grant to the Respiratory Failure Research Group from the Ministry of Health, Labor and Welfare, Japan.
Hokkaido COPD Cohort Study Group investigators (original affiliation and members at the time of conduct-ing this study). KKR Sapporo Medical Center: Yoshikazu Kawakami, Youichi Nishiura, Hiroshi Saito, Tetsuya Kojima; Hokkaido Chuo Rosai Hospital: Takeshi Igarashi, Kiyonobu Kimura, Ikuo Nakano, Moto Katabami, Kouichi Itabashi, Kiyoshi Morikawa, Seiichi Tagami, Yoshihiro Otsuka, Rika Sato, Junichiro Kojima, Shinji Nigawara, Takashi Morioka, Ichiro Sakai; Sapporo City General Hospital: Hiroshi Yamamoto, Shigeaki Ogura, Kenji Akie, Fumihiro Honmura, Shinichi Kusudou, Hiroshi Izumi, Kensuke Baba, Hiroki Goya; Otaru City Hospital: Tsuyoshi Nakano; Otaru Kyokai Hospital: Kimihiro Takeyabu; Hokkaido Social Insurance Hospital: Yasushi Akiyama, Fujiya Kishi, Akihide Ito, Michihiro Fujino, Masashi Ohe, Toshiyuki Harada; Iwamizawa City General Hospital: Akira Kamimura, Nobuyuki Hakuma, Noriaki Sukou; Sap-poro Social Insurance General Hospital: Kazuo Takaoka, Isamu Doi; Kinikyo Chuo Hospital: Atsushi Ishimine, Ryouji Nakano; Tenshi Hospital: Yasushi Hasegawa; First Department of Medicine/Hokkaido University School of Medicine: Yasuyuki Nasuhara, Tomoko Betsuyaku, Kunio Hamada, Yoko Ito, Motoko Kobayashi, Takeshi Hosokawa, Satoshi Fuke, Masaru Hasegawa, Nao Odajima, Chinatsu
International Journal of Chronic Obstructive Pulmonary Disease downloaded from https://www.dovepress.com/ by 118.70.13.36 on 22-Aug-2020
Dovepress Quality of life components over 5 years in COPD
Moriyama, Takayuki Yoshida, Takashi Inomata, Kanako Maki, Eiji Shibuya; Division of Radiology, Department of Diagnosis and Treatment Support Part, Hokkaido Uni-versity Hospital: Tsukasa Sasaki; Division of Pulmonary Function, Department of Laboratory Medicine, Hokkaido University Hospital: Katsuaki Nitta, Masafumi Yamamoto, Shigetaka Mizuno; Division of Rehabilitation Science, Faculty of Health Sciences, Hokkaido University: Kenji Miyamoto; Pulmonology, Doctoral program in clinical Sci-ence, Graduate School of Comprehensive Human Sciences, University of Tsukuba: Nobuyuki Hizawa.
Disclosure
Dr Nishimura reports grants from Nippon Boehringer Ingelheim and Pfizer Japan during the conduct of the study. He has received personal fees from Nippon Boehringer Ingelheim, Novartis Japan, GlaxoSmithKline Japan, Astra-Zeneca Japan, and Kyorin Parmaceutical Co., outside the submitted work. The author states that no funding sources influenced the preparation of the current manuscript in its parts: collection, interpretation, and presentation of data. The other authors report no conflicts of interest in this work.
References
1. Tsiligianni I, Kocks J, Tzanakis N, Siafakas N, van der Molen T. Factors that influence disease-specific quality of life or health status in patients with COPD: a review and meta-analysis of Pearson correlations. Prim Care Respir J. 2011;20(3):257–268.
2. Jones PW. Health status measurement in chronic obstructive pulmonary disease. Thorax. 2001;56(11):880–887.
3. Jones PW, Quirk FH, Baveystock CM. The St George’s Respiratory Questionnaire. Respir Med. 1991;85(Suppl B):25–31; discussion 33–37.
4. Jones PW, Quirk FH, Baveystock CM, Littlejohns P. A self-complete measure of health status for chronic airflow limitation. The St George’s Respiratory Questionnaire. Am Rev Respir Dis. 1992;145(6):1321–1327.
5. Vestbo J, Edwards LD, Scanlon PD, et al; ECLIPSE Investigators. Changes in forced expiratory volume in 1 second over time in COPD.
N Engl J Med. 2011;365(13):1184–1192.
6. Nishimura M, Makita H, Nagai K, et al; Hokkaido COPD Cohort Study Investigators. Annual change in pulmonary function and clinical phenotype in chronic obstructive pulmonary disease. Am J Respir Crit Care Med. 2012;185(1):44–52.
7. Casanova C, de Torres JP, Aguirre-Jaíme A, et al. The progression of chronic obstructive pulmonary disease is heterogeneous: the experience of the BODE cohort. Am J Respir Crit Care Med. 2011;184(9):1015–1021. 8. Oga T, Nishimura K, Tsukino M, Sato S, Hajiro T, Mishima M.
Lon-gitudinal deteriorations in patient reported outcomes in patients with COPD. Respir Med. 2007;101(1):146–153.
9. Kesten S, Celli B, Decramer M, Liu D, Tashkin D. Adverse health consequences in COPD patients with rapid decline in FEV1 – evidence from the UPLIFT trial. Respir Res. 2011;12:129.
10. Fabbri L, Pauwels RA, Hurd SS; GOLD Scientific Committee. Global strategy for the diagnosis, management, and prevention of chronic obstructive pulmonary disease: GOLD executive summary updated 2003. COPD. 2004;1(1):105–141; discussion 103–104.
11. Donaldson GC, Wedzicha JA. COPD exacerbations. 1: Epidemiology.
Thorax. 2006;61(2):164–168.
12. Suzuki M, Makita H, Ito YM, Nagai K, Konno S, Nishimura M; Hokkaido COPD Cohort Study Investigators. Clinical features and determinants of COPD exacerbation in the Hokkaido COPD cohort study. Eur Respir J. 2014;43(5):1289–1297.
13. Little RJ, D’Agostino R, Cohen ML, et al. The prevention and treatment of missing data in clinical trials. N Engl J Med. 2012;367(14):1355–1360. 14. Yorgancioglu A, Havlucu Y, Celik P, Dinc G, Saka A. Relation between
quality of life and morbidity and mortality in COPD patients: Two-year follow-up study. COPD. 2010;7(4):248–253.
15. Oga T, Tsukino M, Hajiro T, Ikeda A, Nishimura K. Analysis of longitudinal changes in dyspnea of patients with chronic obstructive pulmonary disease: an observational study. Respir Res. 2012;13:85. 16. Foglio K, Bianchi L, Bruletti G, et al. Seven-year time course of lung
function, symptoms, health-related quality of life, and exercise toler-ance in COPD patients undergoing pulmonary rehabilitation programs.
Respir Med. 2007;101(9):1961–1970.
17. Tashkin DP, Celli B, Kesten S, Lystig T, Mehra S, Decramer M. Long-term efficacy of tiotropium in relation to smoking status in the UPLIFT trial. Eur Respir J. 2010;35(2):287–294.
18. Ferrari R, Tanni SE, Caram LM, Naves CR, Godoy I. Predictors of health status do not change over three-year periods and exacerbation makes difference in chronic obstructive pulmonary disease. Health Qual Life Outcomes. 2011;9:112.
19. Troosters T, Celli B, Lystig T, et al; Uplift Investigators. Tiotropium as a first maintenance drug in COPD: secondary analysis of the UPLIFT trial. Eur Respir J. 2010;36(1):65–73.
20. Jones PW, Anderson JA, Calverley PM, et al; TORCH investigators. Health status in the TORCH study of COPD: treatment efficacy and other determinants of change. Respir Res. 2011;12:71.
21. Spencer S, Calverley PM, Sherwood Burge P, Jones PW; ISOLDE Study Group. Inhaled Steroids in Obstructive Lung Disease. Health status deterioration in patients with chronic obstructive pulmonary disease. Am J Respir Crit Care Med. 2001;163(1):122–128. 22. Wilke S, Spruit MA, Wouters EF, Schols JM, Franssen FM, Janssen DJ.
Determinants of 1-year changes in disease-specific health status in patients with advanced chronic obstructive pulmonary disease: a 1-year observational study. Int J Nurs Pract. Epub 2014 Mar 26.
23. Westwood M, Bourbeau J, Jones PW, Cerulli A, Capkun-Niggli G, Worthy G. Relationship between FEV1 change and patient-reported outcomes in randomised trials of inhaled bronchodilators for stable COPD: a systematic review. Respir Res. 2011;12:40.
24. Donohue JF, Fogarty C, Lötvall J, et al; INHANCE Study Investigators. Once-daily bronchodilators for chronic obstructive pulmonary disease: indacaterol versus tiotropium. Am J Respir Crit Care Med. 2010;182(2): 155–162.
25. Monteagudo M, Rodríguez-Blanco T, Llagostera M, et al. Factors asso-ciated with changes in quality of life of COPD patients: a prospective study in primary care. Respir Med. 2013;107(10):1589–1597. 26. Jones PW. St George’s Respiratory Questionnaire: MCID. COPD.
2005;2(1):75–79.
27. Jones PW, Beeh KM, Chapman KR, Decramer M, Mahler DA, Wedzicha JA. Minimal clinically important differences in pharmaco-logical trials. Am J Respir Crit Care Med. 2014;189(3):250–255. 28. Jones PW, Mahler DA, Gale R, Owen R, Kramer B. Profiling the effects
of indacaterol on dyspnoea and health status in patients with COPD.
Respir Med. 2011;105(6):892–899.
29. Lareau SC, Breslin EH, Meek PM. Functional status instruments: outcome measure in the evaluation of patients with chronic obstructive pulmonary disease. Heart Lung. 1996;25(3):212–224.
International Journal of Chronic Obstructive Pulmonary Disease downloaded from https://www.dovepress.com/ by 118.70.13.36 on 22-Aug-2020
Dovepress
nagai et al
Supplementary materials
study protocol
All subjects were advised to participate in the follow-up study every 6 months for 5 years (from visit one to eleven). Clinical research coordinators at the central office of the Hokkaido COPD Cohort Study carefully planned and monitored the schedules of each participant’s visit. Most subjects visited outpatient clinics at each hospital monthly or bimonthly for regular clinical checkups. Each physician was allowed to manage and treat subjects in such a way that he/she considered appropriate at all times, and thus changes in smoking status and/or pharmacotherapy often occurred in many subjects during the study period. In particular, the subjects were advised to cease smoking before they enrolled in the study, and those who could not give up smoking by entry were continuously encouraged to do so during the follow-up period. Daily physical activity was recommended, but the subjects did not participate in an intensive rehabilita-tion program.
On the first visit, demographic information, including sex, age, height, weight, smoking history, medical history and any medications, comorbidity, as well as information on pulmonary symptoms such as presence of cough and/or sputum and severity of dyspnea were collected by interview using the case report form. Every 6 months, any changes in smoking status, medical history, and pharmacotherapy were monitored. Subjects were described as continuous, intermittent, or former smokers, depending on the smoking
status during the study period. Actual use of any respiratory medicine was recorded on each visit, and usage was consid-ered positive when any respiratory medicine was used for more than half of the entire follow-up period. Pulmonary function tests were performed both before and after inhala-tion of 0.4 mg doses of salbutamol at visits one through five, seven, nine, and eleven, or oxitropium on visits six, eight, and ten. Reversibility was expressed as % increase from baseline FEV1.
Exacerbation of COPD was assessed as follows: 1) symp-tom definition – worsening or new onset of two major symptoms (increased dyspnea, change in sputum purulence, increased sputum volume) or any one major symptom
± ± ± ±
)UHTXHQF\VXEMHFWV
±
,PSURYHPHQW 'HWHULRUDWLRQ
Figure S1 The frequency distributions of the annual change in sgrQ.
Note: The calculated annual change in the sgrQ total score (units/year) is 0.06 ±
2.64 (mean ± sD).
Abbreviation: sgrQ, st george’s respiratory Questionnaire.
Table S1 Clinical characteristics of phenotypes between the follow-up group and dropouts at baseline
Follow-up group (n=193) Dropouts (n=68) P-value
sgrQ total score 29.7±1.2 38.0±2.0 0.01
sgrQ symptom score 42.7±1.6 46.0±2.7 0.29
sgrQ activity score 39.8±1.7 50.9±2.8 0.01
sgrQ impact score 19.8±1.2 28.1±2.0 0.01
age (y) 68.7±0.6 72.0±0.9 0.01
BMI (kg/m2) 22.6±0.2 21.3±0.4 0.01
Pack-years 64.5±2.2 57.3±3.6 0.09
mMrC dyspnea scale 1.4±0.1 1.6±0.1 0.09
Post-bronchodilator FeV1 (%) 64.9±1.6 63.9±2.7 0.73
Dlco (mmol/min/mmhg) 12.4±4.6 10.7±4.9 0.01
Kco (mmol/min/mmhg) 2.9±1.1 2.5±1.1 0.02
White blood cell count (cells/mm3) 6,139±107 6,039±180 0.63
Blood eosinophil count (cells/mm3) 194±10 215±16 0.27
CrP (mg/dl) 0.25±0.04 0.46±0.07 0.01
serum total Ige (IU/ml) 217±42 217±70 0.99
Note: P-values were calculated using student’s t-test.
Abbreviations: BMI, body mass index; CrP, C reactive protein; Dlco, carbon monoxide diffusing capacity; FeV1, forced expiratory volume in 1 second; Ige, immunoglobulin e;
Kco, carbon monoxide transfer coefficient; mMRC, modified Medical Research Council; SGRQ, St George’s Respiratory Questionnaire.
International Journal of Chronic Obstructive Pulmonary Disease downloaded from https://www.dovepress.com/ by 118.70.13.36 on 22-Aug-2020
Dovepress Quality of life components over 5 years in COPD
Table S2 Characteristics of subjects with COPD classified by annual rates of decline in FEV1 at baseline
Classified by annual change in FEV1 (mL/year) P-value
All patients (n=261)
Rapid decliners (n=65)
Slow decliners (n=131)
Sustainers (n=65)
age, y 70±8 69±6 70±8 68±9 0.11
Female sex, n (%) 15 (5) 1 (2) 10 (8) 4 (6) 0.22
BMI (kg/m2) 22±3 21±3* 22±3 23±4 0.017
Current smoker at entry, n (%) 73 (28) 13 (20) 40 (31) 20 (31) 0.26
Pack-years at entry 63±30 67±27 64±33 55±25 0.05
FeV1 (l) 1.75±0.67 1.76±0.62 1.71±0.66 1.84±0.67 0.42
FeV1 (%predicted) 65±22 64±21 64±22 66±23 0.74
Dlco (mmol/min/mmhg) 12±5 11±5* 12±5* 14±4 0.003
any cardiovascular disease, n (%) 58 (22) 17 (26) 27 (21) 14 (22) 0.67
Ischemic heart disease, n (%) 18 (7) 3 (5) 8 (6) 7 (10) 0.36
Diabetes, n (%) 12 (5) 1 (2) 7 (5) 4 (6) 0.31
Notes: Values are means ± sD; other values are numbers (%); P-values represent one-way analysis of variance with post hoc comparisons using Tukey’s multiple comparison
tests; *P0.05 versus sustainers.
Abbreviations: BMI, body mass index; COPD, chronic obstructive pulmonary disease; Dlco, carbon monoxide diffusing capacity; FeV1, forced expiratory volume in
1 second; sD, standard deviation.
Table S3 Characteristics of subjects with COPD classified by annual rates of decline in FEV1 at baseline
Rapid decliners (n=65) Slow decliners (n=131) Sustainers (n=65) P-value
sgrQ total score 31±17 32±17 31±19 0.84
sgrQ activity score 43±20 43±22 45±22 0.70
sgrQ symptom score 41±23 45±22 39±25 0.18
sgrQ impact score 21±16 22±16 23±18 0.85
mMrC dyspnea scale 1.4±0.1 1.5±0.1 1.3±0.1 0.27
Cough and sputum, n (%) 7 (11) 11 (8) 11 (17) 0.22
Notes: Values are means ± sD; other values are numbers (%); P-values represent one-way analysis of variance.
Abbreviations: COPD, chronic obstructive pulmonary disease; SGRQ, St George’s Respiratory Questionnaire; mMRC, modified Medical Research Council.
plus any minor symptoms (fever, increased cough, wheez-ing compared with baseline); 2) prescription definition – symptom criteria plus requiring prescription change; 3) symptom criteria plus antibiotic treatment (antibiotic definition); and 4) admission definition – symptom criteria plus hospital admission. To collect exacerbation information, prepaid postcards were sent to all participants every month, and replies were received from almost all participants (reply rate 99%). If exacerbation was suspected, information was always reconfirmed by telephone interview and by the medical charts of subjects when they visited a clinic. In addition, the subjects’ medical records were periodically checked because the majority regularly visited the clinic at each hospital monthly or bimonthly, and attending physicians were asked about the condition of the subjects when necessary. Physicians, clinical research coordinators, and paramedical staff ensured that patients were stable at each visit. When an exacerbation of COPD occurred within 1 month of a scheduled visit,
the assessment was postponed for 1 month until the patient recovered.
Results
The demographic data of the dropouts (68 subjects) are shown in Table S1. The baseline characteristics of the patients are shown in Table S2. The total score or each component score of the SGRQ among the three groups
classified by annualized ΔFEV1 (Table S3). The number
of patients who completed the SGRQ assessment at each time point was: baseline n=261, 1st year n=259, 2nd year n=239, 3rd year n=220, 4th year n=213, and 5th year n=193. The calculated annual change in the SGRQ total score (units/year) was 0.06±2.64 (Figure S1). The results of predictors at baseline for total and impact score of SGRQ were shown in Tables S4 and S5. The results of predictors during 5 years for total and impact score of SGRQ were shown in Tables S6 and S7.
International Journal of Chronic Obstructive Pulmonary Disease downloaded from https://www.dovepress.com/ by 118.70.13.36 on 22-Aug-2020
Dovepress
nagai et al
Table S4 results of unadjusted and adjusted linear mixed-effects models to identify which variables at baseline were predictive of the annual change in sgrQ total scores at 5 years
Total score baseline variable
Unadjusted model Adjusted model
Estimate (95% CI) P-value Estimate (95% CI) P-value
age* 0.93 (0.05, 0.14) 0.001 0.75 (0.03, 0.12) 0.002
BMI -0.15 (-0.25, -0.04) 0.007 -0.10 (-0.22, 0.01) 0.081
Cough and sputum -0.57 (-1.13,0.00) 0.047 -0.50 (-1.03, 0.03) 0.066
FeV1 (%predicted)‡ -0.25 (-0.04, -0.01) 0.002 -0.20 (-0.37, -0.00) 0.017
Dlco (ml/min/mmhg) -1.50 (-0.22,-0.08) 0.001 -0.04 (-0.12, 0.05) 0.419
eosinophils (µl)§ -0.33 (-0.00, -0.00) 0.013 -0.24 (-0.00, 0.00) 0.066
Notes: *analyzed in units of 10 years; ‡analyzed in units of 10%; §analyzed in units of 100.
Abbreviations: BMI, body mass index; CI, confidence interval; DLco, carbon monoxide diffusing capacity; FEV1, forced expiratory volume in 1 second; sgrQ, st george’s
respiratory Questionnaire.
Table S5 results of unadjusted and adjusted linear mixed-effects models to identify which variables at baseline were predictive of the annual change in sgrQ impact scores at 5 years
Variable Unadjusted models Adjusted models
Estimate (95% CI) P-value Estimate (95% CI) P-value
age* 0.83 (0.03, 0.13) 0.001 0.61 (0.01, 0.11) 0.021
BMI -0.12 (-0.24, -0.00) 0.042 -0.07 (-0.19, 0.06) 0.312
FVC (%predicted)‡ -0.23 (-0.04, -0.00) 0.026 -0.02 (-0.03, 0.03) 0.857
FeV1 (%predicted)‡ -0.33 (-0.05, -0.02) 0.001 -0.03 (-0.05, 0.00) 0.052
Dlco (ml/min/mmhg) -0.15 (-0.23, -0.07) 0.001 -0.04 (-0.14, 0.05) 0.369
eosinophils (µl)§ -0.35 (-0.00, -0.00) 0.017 -0.31 (-0.01, 0.00) 0.028
Notes: *analyzed in units of 10 years; ‡analyzed in units of 10%; §analyzed in units of 100.
Abbreviations: BMI, body mass index; CI, confidence interval; DLco, carbon monoxide diffusing capacity; FEV1, forced expiratory volume in 1 second; FVC, forced vital
capacity; sgrQ, st george’s respiratory Questionnaire.
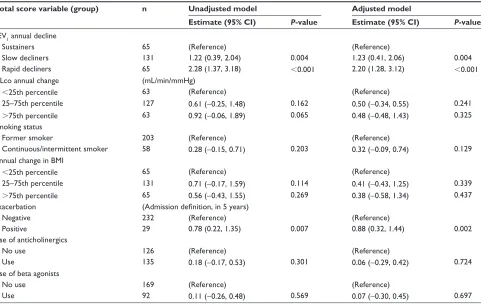
Table S6 results of linear mixed-effects models to identify which variables during follow-up were predictive of the annual change in sgrQ total scores at 5 years
Total score variable (group) n Unadjusted model Adjusted model
Estimate (95% CI) P-value Estimate (95% CI) P-value
FeV1 annual decline
sustainers 65 (reference) (reference)
slow decliners 131 1.22 (0.39, 2.04) 0.004 1.23 (0.41, 2.06) 0.004
rapid decliners 65 2.28 (1.37, 3.18) 0.001 2.20 (1.28, 3.12) 0.001
Dlco annual change (ml/min/mmhg)
25th percentile 63 (reference) (reference)
25–75th percentile 127 0.61 (-0.25, 1.48) 0.162 0.50 (-0.34, 0.55) 0.241
75th percentile 63 0.92 (-0.06, 1.89) 0.065 0.48 (-0.48, 1.43) 0.325
smoking status
Former smoker 203 (reference) (reference)
Continuous/intermittent smoker 58 0.28 (-0.15, 0.71) 0.203 0.32 (-0.09, 0.74) 0.129
annual change in BMI
25th percentile 65 (reference) (reference)
25–75th percentile 131 0.71 (-0.17, 1.59) 0.114 0.41 (-0.43, 1.25) 0.339
75th percentile 65 0.56 (-0.43, 1.55) 0.269 0.38 (-0.58, 1.34) 0.437
exacerbation (Admission definition, in 5 years)
negative 232 (reference) (reference)
Positive 29 0.78 (0.22, 1.35) 0.007 0.88 (0.32, 1.44) 0.002
Use of anticholinergics
no use 126 (reference) (reference)
Use 135 0.18 (-0.17, 0.53) 0.301 0.06 (-0.29, 0.42) 0.724
Use of beta agonists
no use 169 (reference) (reference)
Use 92 0.11 (-0.26, 0.48) 0.569 0.07 (-0.30, 0.45) 0.697
Abbreviations: BMI, body mass index; CI, confidence interval; DLco, carbon monoxide diffusing capacity; FEV1, forced expiratory volume in 1 second; sgrQ, st george’s
respiratory Questionnaire.
International Journal of Chronic Obstructive Pulmonary Disease downloaded from https://www.dovepress.com/ by 118.70.13.36 on 22-Aug-2020
International Journal of COPD
Publish your work in this journal
Submit your manuscript here: http://www.dovepress.com/international-journal-of-chronic-obstructive-pulmonary-disease-journal
The International Journal of COPD is an international, peer-reviewed journal of therapeutics and pharmacology focusing on concise rapid reporting of clinical studies and reviews in COPD. Special focus is given to the pathophysiological processes underlying the disease, intervention programs, patient focused education, and self management protocols.
This journal is indexed on PubMed Central, MedLine and CAS. The manuscript management system is completely online and includes a very quick and fair peer-review system, which is all easy to use. Visit http://www.dovepress.com/testimonials.php to read real quotes from published authors.
Dovepress
Dove
press
Quality of life components over 5 years in COPD
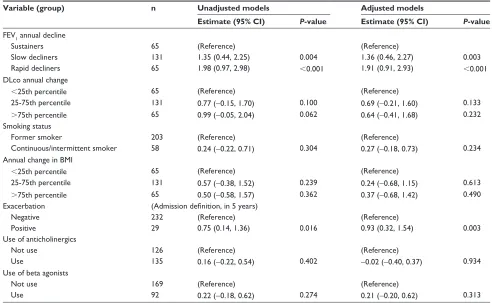
Table S7 results of linear mixed-effects models to identify which variables during follow-up were predictive of the annual change in sgrQ impact scores at 5 years
Variable (group) n Unadjusted models Adjusted models
Estimate (95% CI) P-value Estimate (95% CI) P-value
FeV1 annual decline
sustainers 65 (reference) (reference)
slow decliners 131 1.35 (0.44, 2.25) 0.004 1.36 (0.46, 2.27) 0.003
rapid decliners 65 1.98 (0.97, 2.98) 0.001 1.91 (0.91, 2.93) 0.001
Dlco annual change
25th percentile 65 (reference) (reference)
25-75th percentile 131 0.77 (-0.15, 1.70) 0.100 0.69 (-0.21, 1.60) 0.133
75th percentile 65 0.99 (-0.05, 2.04) 0.062 0.64 (-0.41, 1.68) 0.232
smoking status
Former smoker 203 (reference) (reference)
Continuous/intermittent smoker 58 0.24 (-0.22, 0.71) 0.304 0.27 (-0.18, 0.73) 0.234
annual change in BMI
25th percentile 65 (reference) (reference)
25-75th percentile 131 0.57 (-0.38, 1.52) 0.239 0.24 (-0.68, 1.15) 0.613
75th percentile 65 0.50 (-0.58, 1.57) 0.362 0.37 (-0.68, 1.42) 0.490
exacerbation (Admission definition, in 5 years)
negative 232 (reference) (reference)
Positive 29 0.75 (0.14, 1.36) 0.016 0.93 (0.32, 1.54) 0.003
Use of anticholinergics
not use 126 (reference) (reference)
Use 135 0.16 (-0.22, 0.54) 0.402 -0.02 (-0.40, 0.37) 0.934
Use of beta agonists
not use 169 (reference) (reference)
Use 92 0.22 (-0.18, 0.62) 0.274 0.21 (-0.20, 0.62) 0.313
Abbreviations: BMI, body mass index; CI, confidence interval; DLco, carbon monoxide diffusing capacity; FEV1, forced expiratory volume in 1 second; sgrQ, st george’s
respiratory Questionnaire.
International Journal of Chronic Obstructive Pulmonary Disease downloaded from https://www.dovepress.com/ by 118.70.13.36 on 22-Aug-2020