Int. J. Data Envelopment Analysis (ISSN 2345-458X)
Vol.5, No.2, Year 2017 Article ID IJDEA-00422, 12 pages Research Article
A DEA-bases Approach for Multi-objective
Design of Attribute Acceptance Sampling Plans
S. Jafarian-Namin
1*, A. Pakzad
2, M.S. Fallah Nezhad
1(1)
Faculty of Industrial Engineering, Yazd University, Yazd, Iran
(2)Department of Indutrial Engineering, Kosar University of Bojnord, Bojnord,
Iran
Received February 2, 2017, Accepted April 5, 2107 Abstract
Acceptance sampling (AS), as one of the main fields of statistical quality control (SQC), involves a system of principles and methods to make decisions about accepting or rejecting a lot or sample. For attributes, the design of a single AS plan generally requires determination of sample size, and acceptance number. Numerous approaches have been developed for optimally selection of design parameters in last decades. We develop a multi-objective economic-statistical design (MOESD) of the single AS plan to reach a well-balanced compromise between cost and quality features. Moreover, a simple and efficient DEA-based algorithm for solving the model is proposed. Through a simulation study, the efficiency of proposed model is illustrated. Comparisons of optimal designs obtained using MOESD to economic model with statistical constraints reveals enhanced performance of the multi-objective model.
Keywords: Acceptance sampling, Single sampling plan, MOESD, DEA.
*. Corresponding author, E-mail: [email protected]
1. Introduction
In quality assurance systems, inspection is broadened to include all aspects of manufacturing in recent times. Obviously, there are conditions in which inspection is troublesome, i.e. when 100% inspection is too costly and/or time consuming, testing is destructive, and so on [1]. In such situations, acceptance sampling (AS), as one of the main fields of statistical quality control (SQC), is most likely to be useful. Accordingly, a specified sample, instead of all items, is taken to evaluate whether to accept or reject the whole lot. Base on some considerations, samples can be either single, double, multiple, or sequential (for more information refer to [1]). Broadly, there are two classes of AS plans: variables and attributes. Our focus is on attributes where quality features are assessed on a “go, no-go” basis. Moreover, single-sampling plan is investigated in which the decision is made according to one random sample taken from the lot.
Generally, the design of a single AS plan requires determination of sample size, and acceptance number. Two traditional methods of interest in literature are as follows:
1.Two-point method: After determining two points on the operating characteristic (OC) Curve, acceptable and unacceptable quality levels can be specified as well as the risks regarding the acceptance or rejection decisions ([2], [3]).
2.Optimization of total cost function: In this methods, the total cost function, in which the producer's cost and the consumer's cost are considered, is minimized to determine optimal design parameters ([4], [5], [6]).
Numerous procedures for optimally selection of design parameters have been developed in recent years. In pure economical approaches, only cost of sampling system is minimized regardless of involving producer's risk (α) and consumer's (β) risk. In contrast, statistical
approaches mostly focus on risks and seem to be economically ineffective. In fact, the weakness of these two approaches is in unilateral attitude to sampling concept. To overcome such undesirable weakness, Hsu [7] developed an economic model to determine the optimal design parameters by minimizing total cost while satisfying both the producer’s and the consumer’s requirements. Our proposed model can be classified as a combined model with the difference that both properties are simultaneously optimized. In this multi-objective model, our intention is to reach a well-balanced compromise between the economic and the statistical features because of their identical importance. As a multiple criteria decision-making, some researches have prepared efficient solutions by applying procedures based on data envelopment analysis (DEA) to multi-objective design of control charts recently ([8], [9]). DEA is a powerful optimization method to assess the relative efficiency of decision making units (DMUs) with multiple inputs and outputs [10]. There has been continuous developments and real applications in this field of studies since the first original work [11]. In a mathematical model, known as CCR model, the performance of each DMU is measured with respect to the remaining DMUs. General definition of DMU for various means, and fewer assumptions involved in its modeling are of main motivations that make DEA more appealing.
1233
modeling is developed for the mentioned plan. In section 4, solution procedures for the models are provided. Specially, an algorithm using the DEA is developed with some modifications to solve the proposed multi-objective model. Section 5 includes a simulation study to illustrate the solution procedure and to perform some comparisons. Finally, section 6 covers some final conclusions that can be drawn.
2. Acceptance
Sampling
Basic
Concepts and Terminology
Acceptance sampling plans use statistical techniques to decide on accepting or rejecting an incoming lot. In single-sampling plans for attributes, decision procedure is made by randomly taking one sample of n units from the lot of N
units and then inspecting. If the number of defectives does not exceed a pre-determined acceptance number (c), the whole lot is accepted. Otherwise, the lot is reject. We will use the following notations and definitions in the rest of the paper:
N whole lot size
n sample size
c acceptance number
S set of design parameters
α producer’s risk
β consumer’s risk
ATI average total inspection
AOQ average outgoing quality
D number of nonconforming
items
Dd
detected number of defective items
Dn
not detected number of defective items
Ci cost of inspection per item
Cf cost of internal failure
Co cost of an outgoing defective
TC total cost
It is assumed that the distribution of the
number of defectives (d) in a random sample of size n is binomial (n, p), where
p is the fraction of defective items in the lot. Thus, the probability of acceptance is:
0
( | , ) (1 )
c
p d n d
a
d n
P P d c n p p p
d
(1)In association with decisions on the obtained sample, we confront two types of errors:
Type I error (α): incorrectly rejection of a lot that is in fact acceptable.
Type II error (β): incorrectly acceptation of a lot that is indeed unacceptable.
The probability of making such errors depend respectively on two levels of lot quality which are defined as follow: Acceptable Quality Level (AQL) is the worst level of quality but still acceptable for the consumer. The producer tends to design a plan which has a high chance of acceptance with defective level of less than or equal to AQL.
Lot Tolerance Percent Defective (LTPD) is the worst level of quality that would be unacceptable for the consumer in an individual lot. It is aimed for the consumer to accept with low probability any sampling plan with LTPD level of quality.
Using specified AQL and LTPD, producer’s risk and the consumer’s risk can be respectively calculated as following equations: d n c d d AQL
a p p
d n AQL p n c d P P
( | , )
(1 0)0 0 0 (2) d n c d d LTPD
a p p
d n LTPD p n c d P P
( | , ) (1 1)
0 1 1
(3)
fraction defective p, the Average Outgoing Quality (AOQ) is obtained to evaluate rectifying inspection as below equation: p P N n N
AOQ( ) ap. (4) Another important measure in relation to rectifying inspection is Average Total Inspection (ATI) which is calculated as follows:
) )( 1
( P N n
n
ATI ap (5) In a sampling plan, some defective items are detected and the others are not. If we indicate detected defective items by Dd and not detected ones by Dn, then we have (for detailed information on AS plans, refer to [1]):
p n N P np
Dd (1 ap)( ) (6)
p n N P
Dn ap( ) (7)
3. Design of Single AS Plan
In this section, statistically constrained cost model is firstly introduced. Then, the proposed mathematical model for single sample AS plans is developed to consider economic and statistical properties simultaneously.
A. Cost Model with Statistical
Constraints
With the purpose of finding the optimal design parameters of AS plan, Hsu [7] developed a model in which statistical constraints based on the producer's and the consumer's risk were satisfied in minimum total cost. This proposed model is given by following formulation:
1 . . . . . ) ( 0 AQL a LTPD a n d f i p p t s D C D C ATI C S TC Min (8)
where TC is the total cost, S=(n, c, k) is a possible set of design parameters, Ci denotes the inspection cost per unit, Cf is internal failure cost (including rework,
repair, and replacement of the failed unit), and Co indicates the cost of an outgoing defective [7]. In addition, α and β are the desired bounds to limit the constraints according to the considerations of decision maker (DM).
B. Multi-Objective Model
In addition to the statistical properties, designing AS plans have several costly consequences as introduced above. Simultaneously considering both properties in a multi-objective format can help to find optimal design parameters which give the best compromise between the objectives. The proposed model is presented in the following formulation:
1 . . ) ( ) ( . . . ) ( 0 AQL a LTPD a AQL a LTPD a n d f i p p t s S p Max S p Min D C D C ATI C S TC Min (9)
The design of AS plan requires the specification of two decision variables, i.e. n, and c. In the next section, two algorithms are presented to search the optimal solution(s) based on the models introduced above.
4. Solution Procedure
In this section, solution procedures are presented for both models proposed in previous section. These algorithms are applied to determine optimal decision parameters for single sample AS plans.
A. Proposed Solution for Cost
Model with Statistical Constraints
It is intended to find the design parameters such that both producer's and consumer's risk are satisfied in minimum cost. The solution algorithm for optimization is presented in following steps:
1235
in the model, i.e. a, m, α, β, δ, Ci, Cf and
Co.
(ii) Put limits on n and c according to DM’s discretion.
(iii) Gather the results for each set of solutions, as S=(n, c), that satisfies the constraints.
(iv) Calculate the cost function for the feasible solution combinations obtained from step (iii).
(v) Select design(s) with minimum cost function as optimal.
B. Proposed Solution for
Multi-objective Model
As previously mentioned, the design of AS plan needs the specification of decision variables, i.e. n, and c. By using the multi-objective model, we aim to achieve a well-balanced compromise between the economic and the statistical properties. For various control charts, algorithms based on DEA were proposed to search for the optimal design parameters using multi-objective models (for example see [8] and [9]).
DEA is a well-known optimization method to assess the relative efficiency of a group of DMUs with multiple inputs and outputs. In its first mathematical model, known as CCR, to format can be considered as either input-oriented or output-oriented [10]. We apply the input-oriented CCR model. Assuming n DMUs, each with m inputs and q outputs, the efficiency of a specific DMU is calculated by solving the model outlined in below format: 0 0 1 0 1 ( )
. . 1
q r r r m i i i
Max E S u Y
s t v X
(10) 1 1( ) ( ) 0,
1,...,
0, 1,...,
0, 1,...,
q m
r rj i ij
r i
r i
u Y S v X S
j n
u r q
v i m
Where ur is the weight of output r, vi is the weight of input i, Yrj is the value of output r for jth DMU, and Xij is the value of input i for jth DMU.DMUs are denoted to feasible combinations of design variables. The measured performance of each DMU is relatively inefficient when
E0 *
<1 and relatively efficient, strictly or weakly, when E0
*
=1.
For the proposed model, it should be noted that the objectives including TC and
pa LTPD
are considered as inputs and pa AOQ
is probed as output. After formulating the model for each DMU, the set of weights can be discovered as decision variables. As a result, at least one DMU is expected to be efficient.
Although DEA has the potential of solving various problems, it has not been applied for the design of AS plans so far. We employ the proposed algorithm in [8] by some modifications such as optimizing the model for designing AS plans instead of control charts and changing the objective functions and constraints, accordingly. The solution algorithm for optimization of the proposed model is outlined in following steps:
(i) Set pre-specified values of parameters in the model, i.e. a, m, α, β, δ, Ci, Cf and
Co.
(ii) Put limits on n, and c according to DM’s idea to restrict the solution space beforehand.
(iii) Compute objective functions for each set of design parameters, as DMU.
(iv) After applying the constraints of the model, gather the feasible sets with the same sample size n into a set Qn.
(v) Determine the non-dominated solution points (NDS) in terms of statistical and cost properties for each set of Qn.
(vi) Mix all determined solutions from (v) into a set W.
5. Simulation Results
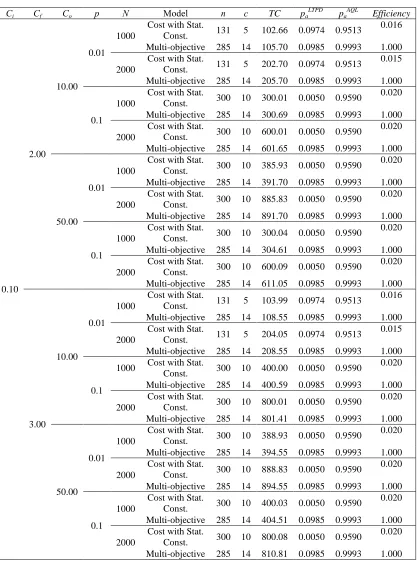
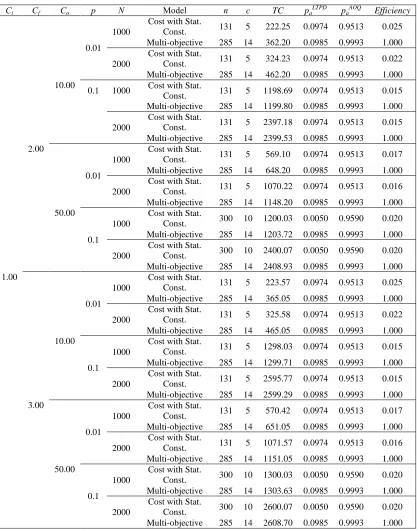
In order to find the optimal design parameters of single AS plans for the proposed models, the pre-defined coefficients are considered according to [7]. These values are listed in Table 1 by considering some other values for cost, lot size and fraction defective parameters. Moreover, we consider 1≤n≤300
increases by 1, and 0≤c≤10 increases by 1
to limit the solution space. The results for the models and the comparisons are provided in the following. Note that all calculations have been facilitated under coded programs in the MATLAB (version R2016b) environment.
For the cost model with statistical constraints, after setting pre-specified values of parameters according to Table 1, DM’s discretions are put on design parameters to limit the solution space. Then, the feasible combinations, as
S=(n,c), are gathered using the constraints of the model. Next, the cost function is calculated for each feasible solution. The design with minimum cost function is chosen as optimal. For the multi-objective model, the solution space is firstly confined under the limits put on design parameters. Furthermore, objective functions are computed for entire possible combinations, i.e. 300×21=6300 combinations. Then, the constraints are applied to determine feasible solutions. Next, the NDS points in terms of statistical and cost properties for each set of Qn are chosen. Finally, the relative efficiency score of each DMU is calculated to specify a design set with maximum score as the most efficient one. From the results presented in Tables 2, some important points can be mentioned as follows:
All combinations have received efficiency score 1 using their own models. Although pre-specified values of parameters are changed, a few combinations are introduced through whole Table 2. In fact, (131, 5) and (300,
10) for the first model and (285, 14) for the second model are repeated as optimal design parameters. Besides, the results of MOESD are more robust to altered parameters.
Comparing the most efficient units obtained using multi-objective model shows significant difference against the first model.
In a special case, the efficient units respectively from the first and second row in Table 2 are compared. It is observed that pa
AOQ
has improved about 5.05%, and
pa LTPD
has a slight decrease about 1.13%. However, TC is increased about 2.96%. In spite of the increase in cost, statistical performances are improved noticeably using multi-objective model.
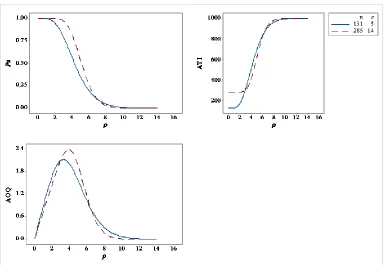
For more investigation, we considered these pre-specified values of parameters in the model: Ci=0.1, Cf=2, Co=10,
p=0.01, and N=1000. Figure 1, depicted in Minitab statistical software 17, shows three curves including operating characteristic (OC), ATI, and AOQ for comparing the results of two different models.
1237
fraction defectives almost lower than 3. After that, there is no significant difference between to models. As indicated in [1], AOQ is the quality of lot that results from the application of rectifying inspection. It is expected to be lower than incoming fraction defective (p) over a long term. Considering AOQ curve in Figure 1 and its results from Table 3, the performance of plan obtained using the multi-objective model is obviously better with lower AOQ values for AQL and LTPD points.
These results can totally endorse the enhanced performance of the multi-objective model and disclose the insufficiency of the cost model with statistical constraints in such space. 6. Conclusion and Future Researches This research aimed at to design a single
AS plan in which sample size, and acceptance number must be determined. Moreover, it was tried to reach a well-balanced compromise between cost (economical) and the producer's and consumer's quality and risk (statistical) features that never had been considered simultaneously. For these reasons, a multi-objective model was developed and a simple and efficient optimization algorithm using DEA was employed to solve it. Through a simulation study, the proposed model performed better than the existing cost model with statistical constraints.
As mentioned earlier, samples can be either single, double, multiple, or sequential. We investigated the most common (single) sampling plan. The other plans can be used as future researches.
Table1. Input values of parameters for performing different simulations Parameters Magnitudes
AQL (p0) 0.02
LTPD (p1) 0.07
Failure rate (p) 0.01, 0.10 Producer’s risk (α) 0.05 Consumer’s risk (β) 0.10
Ci 0.10, 1.00
Cf 2.00, 3.00
Co 10.00, 50.00
Table 2. Efficient designs of different models under various values of parameters
Ci Cf Co p N Model n c TC pa
LTPD
pa AQL
Efficiency
2.00 10.00
0.01 1000
Cost with Stat.
Const. 131 5 102.66 0.0974 0.9513
0.016
Multi-objective 285 14 105.70 0.0985 0.9993 1.000
2000
Cost with Stat.
Const. 131 5 202.70 0.0974 0.9513
0.015
Multi-objective 285 14 205.70 0.0985 0.9993 1.000
0.1 1000
Cost with Stat.
Const. 300 10 300.01 0.0050 0.9590
0.020
Multi-objective 285 14 300.69 0.0985 0.9993 1.000
2000
Cost with Stat.
Const. 300 10 600.01 0.0050 0.9590
0.020
Multi-objective 285 14 601.65 0.0985 0.9993 1.000
50.00 0.01
1000
Cost with Stat.
Const. 300 10 385.93 0.0050 0.9590
0.020
Multi-objective 285 14 391.70 0.0985 0.9993 1.000
2000
Cost with Stat.
Const. 300 10 885.83 0.0050 0.9590
0.020
Multi-objective 285 14 891.70 0.0985 0.9993 1.000
0.1 1000
Cost with Stat.
Const. 300 10 300.04 0.0050 0.9590
0.020
Multi-objective 285 14 304.61 0.0985 0.9993 1.000
0.10
2000
Cost with Stat.
Const. 300 10 600.09 0.0050 0.9590
0.020
Multi-objective 285 14 611.05 0.0985 0.9993 1.000
10.00 0.01
1000
Cost with Stat.
Const. 131 5 103.99 0.0974 0.9513
0.016
Multi-objective 285 14 108.55 0.0985 0.9993 1.000
2000
Cost with Stat.
Const. 131 5 204.05 0.0974 0.9513
0.015
Multi-objective 285 14 208.55 0.0985 0.9993 1.000
0.1
1000 Cost with Stat.
Const. 300 10 400.00 0.0050 0.9590
0.020
Multi-objective 285 14 400.59 0.0985 0.9993 1.000
3.00
2000
Cost with Stat.
Const. 300 10 800.01 0.0050 0.9590
0.020
Multi-objective 285 14 801.41 0.0985 0.9993 1.000
50.00 0.01
1000
Cost with Stat.
Const. 300 10 388.93 0.0050 0.9590
0.020
Multi-objective 285 14 394.55 0.0985 0.9993 1.000
2000
Cost with Stat.
Const. 300 10 888.83 0.0050 0.9590
0.020
Multi-objective 285 14 894.55 0.0985 0.9993 1.000
0.1 1000
Cost with Stat.
Const. 300 10 400.03 0.0050 0.9590
0.020
Multi-objective 285 14 404.51 0.0985 0.9993 1.000
2000
Cost with Stat.
Const. 300 10 800.08 0.0050 0.9590
0.020
1239
Table 2. (Continued)
Ci Cf Co p N Model n c TC paLTPD paAOQ Efficiency
0.01 1000
Cost with Stat.
Const. 131 5 222.25 0.0974 0.9513 0.025
Multi-objective 285 14 362.20 0.0985 0.9993 1.000
2000
Cost with Stat.
Const. 131 5 324.23 0.0974 0.9513 0.022
10.00
Multi-objective 285 14 462.20 0.0985 0.9993 1.000
0.1 1000 Cost with Stat.
Const. 131 5 1198.69 0.0974 0.9513 0.015
Multi-objective 285 14 1199.80 0.0985 0.9993 1.000
2000
Cost with Stat.
Const. 131 5 2397.18 0.0974 0.9513 0.015
2.00
Multi-objective 285 14 2399.53 0.0985 0.9993 1.000
0.01 1000
Cost with Stat.
Const. 131 5 569.10 0.0974 0.9513 0.017
Multi-objective 285 14 648.20 0.0985 0.9993 1.000
2000
Cost with Stat.
Const. 131 5 1070.22 0.0974 0.9513 0.016
50.00
Multi-objective 285 14 1148.20 0.0985 0.9993 1.000
0.1 1000
Cost with Stat.
Const. 300 10 1200.03 0.0050 0.9590 0.020
Multi-objective 285 14 1203.72 0.0985 0.9993 1.000
2000
Cost with Stat.
Const. 300 10 2400.07 0.0050 0.9590 0.020
1.00
Multi-objective 285 14 2408.93 0.0985 0.9993 1.000
0.01 1000
Cost with Stat.
Const. 131 5 223.57 0.0974 0.9513 0.025
Multi-objective 285 14 365.05 0.0985 0.9993 1.000
2000
Cost with Stat.
Const. 131 5 325.58 0.0974 0.9513 0.022
10.00
Multi-objective 285 14 465.05 0.0985 0.9993 1.000
0.1 1000
Cost with Stat.
Const. 131 5 1298.03 0.0974 0.9513 0.015
Multi-objective 285 14 1299.71 0.0985 0.9993 1.000
2000
Cost with Stat.
Const. 131 5 2595.77 0.0974 0.9513 0.015
3.00
Multi-objective 285 14 2599.29 0.0985 0.9993 1.000
0.01 1000
Cost with Stat.
Const. 131 5 570.42 0.0974 0.9513 0.017
Multi-objective 285 14 651.05 0.0985 0.9993 1.000
2000
Cost with Stat.
Const. 131 5 1071.57 0.0974 0.9513 0.016
50.00
Multi-objective 285 14 1151.05 0.0985 0.9993 1.000
0.1 1000
Cost with Stat.
Const. 300 10 1300.03 0.0050 0.9590 0.020
Multi-objective 285 14 1303.63 0.0985 0.9993 1.000
2000
Cost with Stat.
Const. 300 10 2600.07 0.0050 0.9590 0.020
Table 3.Comparison of different models for Ci=0.1, Cf=2, Co=10, p=0.01, and N=1000
Model n c AQL% LTPD% Pa AOQ ATI
Cost with Stat. Const. 131 5 2 - 0951 1.653 173.3
- 7 0.097 0.593 915.3
Multi-objective 285 14 2 - 0.999 1.429 285.5
- 7 0.098 0.493 929.6
1241
References
[1] Montgomery, D.C. (2008). Introduction to Statistical Quality Control. New York: Wiley.
[2] Pearn, W.L., Wu. C.W. (2006). Critical acceptance values and sample sizes of a variables sampling plan for very low fraction of nonconforming. Omega, 34(1), 90-101.
[3]Aslam, M., Niaki, S.T.A.., Rasool, M., Fallahnezhad, M.S. (2012). Decision rule of repetitive acceptance sampling plans assuring percentile life. Scientia Iranica, 19(3), 879-884.
[4] Ferrell, W. G., Chhoker, Jr. A. (2002). Design of economically optimal acceptance sampling plans with inspection error. Computers and Operations Research, 29(1), 1283-1300. [5] Niaki, S.T.A., Fallahnezhad, M.S. (2009). Designing an optimum acceptance plan using bayesian inference and stochastic dynamic programming. Scientia Iranica, 16(1), 19-25.
[6] Fallahnezhad, M.S., Niaki, S.T.A., VahdatZad, M.A. (2012). A new acceptance sampling design using bayesian modeling and backwards induction. International Journal of Engineering, Transactions C: Aspects, 25(1), 45-54.
[7] Hsu, J.-T. (2009). Economic Design of Single Sample Acceptance Sampling Plans. Journal of Hungkuang University, 108-122.
[8] Jafarian-Namin, S., Amiri, A., Najafi, E. (2014). Efficient Selection of Design Parameters in Multi-Objective Economic-Statistical Model of Attribute C Control
Chart. International Journal of Data Envelopment Analysis, 2(2), 357-367. [9] Jafarian-Namin, S., Hasanzadeh, H., Mobin, M. (2016). Multi-objective economic-statistical design of the new t-Chart based on Process Capability Index. Proceedings of the 2016 International Conference on Industrial Engineering and Operations Management, Detroit, Michigan, USA, 937-944.