ANALYTICAL METHOD DEVELOPMENT AND VALIDATION FOR THE ESTIMATION OF
TRIMETHOPRIM IN BULK AND TABLET DOSAGE FORM BY USING UV
Shamshad Hussain, *
School of Pharmaceutical Sciences, Jaipur National University, Jagatpura, Jaipur
ARTICLE INFO ABSTRACT
Introduction
region. This means it uses light in the visible and adjacent ranges.
undertaken to design newer techniques for particle size enlargement such as spheronizati
melt granulation, fluidized agglomeration, spherical crystallization etc. The basic aim of this project is to study and broaden the applications of spherical crystallization process, which not only enlarges the particle size but also changes t
Spherical crystallization, a novel particle design technique has been proved to improve the efficiency of the initial steps of the manufacturing operation. It combines the process
primary particles) and agglomeration (design of secondary particles), and increases the added value of the product by endowing the primary and secondary particles with greater.Literature survey has revealed that, spherical cr
techniques to obtain the spherical agglomerates with improved tabletting properties but mainly for large dose drugs. The technique was also designed to sustain the drug release
(chlorpromazine hydrochloride), enhance process stability and economy (aspirin): In our laboratory, work on spherical crystallization was attempted by solvent change method for trimethoprim. The agglomerates obtained were evaluated fo
validation of two visible spectrophotometric methods applying BCG and DNFB as reagents for TMP determination in investigated formulations were successfully carried out. The near 100 % recoveries and low relative standard deviation values obtained, point to the suitability of the both modified and validated methods for determination of TMP in human and veterinary medicine.
concluded that the 1D spectroscopic method could be used for si trimethoprim immediate
active pharmaceutical ingredients in dissolution studies and for quality control purposes. The method is rapid, simple, and economic
Copyright©2019, Shamshad Hussain et al. This is an open use, distribution, and reproduction in any medium, provided
INTRODUCTION
Ultraviolet–visible spectroscopy (UV–V
absorption spectroscopy or reflectance spectroscopy in the ultraviolet-visible spectral region. This means it uses light in the visible and adjacent ranges. The absorption or reflectance in the visible range directly affects the perceived
chemicals involved. In this region of the
spectrum, atoms and molecules undergo electronic transitions Absorption spectroscopy is complementary to
spectroscopy, in that fluorescence deals with transitions from the excited state to the ground state, while absorption measures transitions from the ground state to the excited state.
*Corresponding author: Dr. Sonu Sharma,
School of Pharmaceutical Sciences, Jaipur National University, Jagatpura, Jaipur, India.
ISSN: 0975-833X
Article History:
Received 24th July, 2019 Received in revised form 09th August, 2019
Accepted 15th September, 2019 Published online 30th October, 2019
Citation: Shamshad Hussain, Dr. Sonu Sharma, Dr. Shrivastav B. and Neha Arora
Trimethoprim in Bulk and Tablet Dosage Form by Using UV
Key Words:
Visible Spectrophotometric, Crystallinity, Simultaneous, Immediate-Releas.
RESEARCH ARTICLE
ANALYTICAL METHOD DEVELOPMENT AND VALIDATION FOR THE ESTIMATION OF
TRIMETHOPRIM IN BULK AND TABLET DOSAGE FORM BY USING UV
*Dr. Sonu Sharma, Dr. Shrivastav B. and Neha Arora
School of Pharmaceutical Sciences, Jaipur National University, Jagatpura, Jaipur
ABSTRACT
Introduction: Absorption spectroscopy or reflectance spectroscopy in the region. This means it uses light in the visible and adjacent ranges.
undertaken to design newer techniques for particle size enlargement such as spheronizati
melt granulation, fluidized agglomeration, spherical crystallization etc. The basic aim of this project is to study and broaden the applications of spherical crystallization process, which not only enlarges the particle size but also changes the primary particle characteristics such as crystallinity, crystal form etc. Spherical crystallization, a novel particle design technique has been proved to improve the efficiency of the initial steps of the manufacturing operation. It combines the process
primary particles) and agglomeration (design of secondary particles), and increases the added value of the product by endowing the primary and secondary particles with greater.Literature survey has revealed that, spherical crystallization has been attempted as an alternative to conventional granulation techniques to obtain the spherical agglomerates with improved tabletting properties but mainly for large dose drugs. The technique was also designed to sustain the drug release
(chlorpromazine hydrochloride), enhance process stability and economy (aspirin): In our laboratory, work on spherical crystallization was attempted by solvent change method for trimethoprim. The agglomerates obtained were evaluated for their tabulating properties.
validation of two visible spectrophotometric methods applying BCG and DNFB as reagents for TMP determination in investigated formulations were successfully carried out. The near 100 % recoveries w relative standard deviation values obtained, point to the suitability of the both modified and validated methods for determination of TMP in human and veterinary medicine.
concluded that the 1D spectroscopic method could be used for si
trimethoprim immediate-release oral dosage forms. This method could be used for the analysis of active pharmaceutical ingredients in dissolution studies and for quality control purposes. The method is rapid, simple, and economic without the need of high cost investment
open access article distributed under the Creative Commons Attribution provided the original work is properly cited.
V): Is refers to or reflectance spectroscopy in the spectral region. This means it uses light in the visible and adjacent ranges. The absorption or reflectance in the visible range directly affects the perceived color of the region of the electromagnetic electronic transitions. Absorption spectroscopy is complementary to fluorescence deals with transitions from e absorption measures transitions from the ground state to the excited state.
School of Pharmaceutical Sciences, Jaipur National University,
Principle of ultraviolet–visible absorption containing bonding and
non-can absorb energy in the form of ultraviolet or visible light to excite these electrons to higher anti
The more easily excited the electrons (i.e. lower ener between the HOMO and the LUMO), the longer the wavelength of light it can absorb. There are four possible types of transitions (π–π*, n–π*, σ–σ*, and n
ordered as follows: σ–σ* > n–σ* > π
An example of uv/vis readout
routinely used in analytical chemistry for the quantitative determination of different analytes, such as transition metal ions, highly conjugated organic compounds, and biological macromolecules. Spectroscopic analysis is commonly out in solutions but solids and gases may also be studied. International Journal of Current Research
Vol. 11, Issue, 10, pp.7480-7484, October, 2019
DOI: https://doi.org/10.24941/ijcr.36873.10.2019
Dr. Shrivastav B. and Neha Arora, 2019. “Analytical Method Development and Validation for the Estimation of Using UV - Spectroscopy”, International Journal of Current Research, 11, (10
ANALYTICAL METHOD DEVELOPMENT AND VALIDATION FOR THE ESTIMATION OF
TRIMETHOPRIM IN BULK AND TABLET DOSAGE FORM BY USING UV - SPECTROSCOPY
and Neha Arora
School of Pharmaceutical Sciences, Jaipur National University, Jagatpura, Jaipur
or reflectance spectroscopy in the ultraviolet-visible spectral region. This means it uses light in the visible and adjacent ranges. Objective: Recently, studies are undertaken to design newer techniques for particle size enlargement such as spheronization, tumbling melt granulation, fluidized agglomeration, spherical crystallization etc. The basic aim of this project is to study and broaden the applications of spherical crystallization process, which not only enlarges the he primary particle characteristics such as crystallinity, crystal form etc. Spherical crystallization, a novel particle design technique has been proved to improve the efficiency of the initial steps of the manufacturing operation. It combines the process of crystallization (design of primary particles) and agglomeration (design of secondary particles), and increases the added value of the product by endowing the primary and secondary particles with greater.Literature survey has ystallization has been attempted as an alternative to conventional granulation techniques to obtain the spherical agglomerates with improved tabletting properties but mainly for large dose drugs. The technique was also designed to sustain the drug release from the agglomerates (chlorpromazine hydrochloride), enhance process stability and economy (aspirin): In our laboratory, work on spherical crystallization was attempted by solvent change method for trimethoprim. The r their tabulating properties. Result: Improvement and validation of two visible spectrophotometric methods applying BCG and DNFB as reagents for TMP determination in investigated formulations were successfully carried out. The near 100 % recoveries w relative standard deviation values obtained, point to the suitability of the both modified and validated methods for determination of TMP in human and veterinary medicine. Discussion: It was concluded that the 1D spectroscopic method could be used for simultaneous determination of release oral dosage forms. This method could be used for the analysis of active pharmaceutical ingredients in dissolution studies and for quality control purposes. The method
without the need of high cost investment.
Attribution License, which permits unrestricted
visible absorption: Molecules -bonding electrons (n-electrons) can absorb energy in the form of ultraviolet or visible light to excite these electrons to higher anti-bonding molecular orbitals. The more easily excited the electrons (i.e. lower energy gap between the HOMO and the LUMO), the longer the wavelength of light it can absorb. There are four possible types –σ*, and n–σ*), and they can be
σ* > π–π* > n–π*.
An example of uv/vis readout: UV/Vis spectroscopy is routinely used in analytical chemistry for the quantitative determination of different analytes, such as transition metal ions, highly conjugated organic compounds, and biological macromolecules. Spectroscopic analysis is commonly carried out in solutions but solids and gases may also be studied.
OF CURRENT RESEARCH
Solutions of transition metal ions can be colored (i.e., absorb visible light) because d electrons within the metal atoms can be excited from one electronic state to another. The color of metal ion solutions is strongly affected by the presence of other species, such as certain anions or ligands. For instance, the color of a dilute solution of copper sulfate is a very light blue; adding ammonia intensifies the colour and changes the wavelength of maximum absorption (λmax). Organic
compounds, especially those with a high degree of conjugation, also absorb light in the UV or visible regions of the electromagnetic spectrum. The solvents for these determinations are often water for water-soluble compounds, or ethanol for organic-soluble compounds. (Organic solvents may have significant UV absorption; not all solvents are suitable for use in UV spectroscopy. Ethanol absorbs very weakly at most wavelengths.) Solvent polarity and pH can affect the absorption spectrum of an organic compound. Tyrosine, for example, increases in absorption maxima and molar extinction coefficient when pH increases from 6 to 13 or when solvent polarity decreases.
Need for the study: To study effect of different variables on properties of the agglomerates. Dift'erence in the physicochemical properties of the drugs is an important barrier in designing the process to obtain the agglomerates containing more than one drug. Due to which selection of a suitable solvent system becomes difficult and necessitates the modification of the process technique. Inclusion of a suitable excipient may be required to adapt the process for low dose drugs. This may also impart better compressional properties and desired drug release. In view of these problems following approaches may be attempted I. Simultaneous crystallization and agglomeration of both drugs, II. Crystallization of one drug and agglomeration with the other drug(s), or III. Crystallization of drug(s) and agglomeration with an excipient. This process of crystallization of drug(s) and agglomeration with another drug or excipient may be termed as “Crystallo-Co- Agglomeration” (CCA).Selection of an excipient for crystallo-co-agglomeration using aqueous phase as one of the component becomes a difficult due to generally high relative wettability of the excipient by aqueous phase as compared to the bridging liquid. Therefore under such conditions excipient should have low aqueous phase wettability at the same time minimum effect on the drug release characteristics Inclusion of solubility suppressants, maintenance of low temperature during processing may aid to improve the yield of the agglomerates. For the selection of the drug combination for the present study factors taken into consideration include complexity in primary properties of the drug, difficulties in the particle size enlargement and tabletting steps as well as commercial significance.
Drug Profile
Official Status: IP, BP, USP, EP
Chemical Name: 5-(3, 4, 5-Trimethoxybenzyl) pyrimidine-2, 4-diamine
Molecular Formula: C14H18N4O3 Molecular Weight: 290.3
Melting Point: 2380-2400c.
Description: A white or yellowish white powder, almost odorless.
PKa : pKa 1- 1.7, pKa 2- 5.6
Solubility: Very slightly soluble in water, slightly soluble in ethanol,
Soluble in methanol
Storage: Store in air tight containers protected from light. Category: Anti-bacterial
Mode of Action (13): It is dihydrofolate reductase inhibitor inhibit conversion of bacterial Dihydrofolic acid to Tetrahydrofolic acid which required for synthesis of certain amino acids, purines, thymine and ultimately DNA. Co-trimoxazole14-15 is used to treat certain bacterial infections, such as pneumonia (a lung infection), bronchitis (infection of the tubes leading to the lungs), and infections of the urinary tract, ears, and intestines. It also is used to treat 'travelers' Diarrhea.
Experimental Work
Method development
Selection of initial conditions: This step determines the optimum conditions to adequately retain all analytes; that is ensures analyte has a better capacity factor (excessive retention leads to long analysis time and broad peaks with poor delectability).
Selection of wavelength: Each molecule will be scan by UV region to identify the maximum wavelength absorbance. It will help in select the single wavelength for more molecules.
Selectivity optimization: The aim of this step is to achieve adequate selectivity (peak spacing). The mobile phase and stationary phase compositions need to be taken into account. To minimize the number of trial chromatograms involved, only the parameters that are likely to have a significant effect on selectivity in the optimization must be examined. To select these, the nature of the analytes must be considered
System parameter optimization: This is used to find the desired balance between resolution and analysis time after satisfactory selectivity has been achieved. The parameters involved include column dimensions, column packing particle size and flow rate. These parameters may be changed without affecting capacity factors or selectivity.
Method Optimization: Proper validation of analytical methods is important for pharmaceutical analysis when ensurance of the continuing efficacy and safety of each batch manufactured relies solely on the determination of quality. The ability to control this quality is dependent upon the ability of the analytical methods, as applied under well-defined conditions and at an established level of sensitivity, to give a reliable demonstration of all deviation from target criteria.
Specificity: Ability to measure desired analyte in a complex mixture. Specificity is the ability to assess unequivocally the analyte in the presence of components which may be expected to be present.
Linearity: proportionality of measured value to concentration The linearity of an analytical procedure is its ability (within a given range) to obtain test results which are directly proportional to the concentration (amount) of analyte in the sample.
Accuracy: Agreement between measured and real value the accuracy of an analytical procedure expresses the closeness of agreement between the value which is accepted either as a conventional true value or an accepted reference value and the value found.
Precision: agreement between a series of measurements The precision of an analytical procedure expresses the closeness of agreement (degree of scatter) between a series of measurements obtained from multiple sampling of the same homogeneous sample under the prescribed conditions. Precision may be considered at three levels: repeatability, intermediate precision and reproducibility.
Repeatability: Repeatability expresses the precision under the same operating conditions over a short interval of time. Repeatability is also termed intra-assay precision. Intermediate precision Intermediate precision expresses within-laboratories variations: different days, different analysts, different equipment, etc.
[image:3.595.314.551.160.464.2]RESULT AND DISCUSSION
Table No.1 Linearity Data of Trimethoprim
Concentration (µg/mL) Absorbance SD* %RSD
1 0.080 0.001 1.42
3 0.236 0.001 0.49
5 0.408 0.0015 0.43
7 0.560 0.001 0.20
9 0.724 0.0005 0.07
12 0.964 0.001 0.11
Linearity Graph
Intermediate Precision (Ruggedness): The result for Ruggedness evaluation give RSD below 1% suggest the method is rugged to changes.
Validation
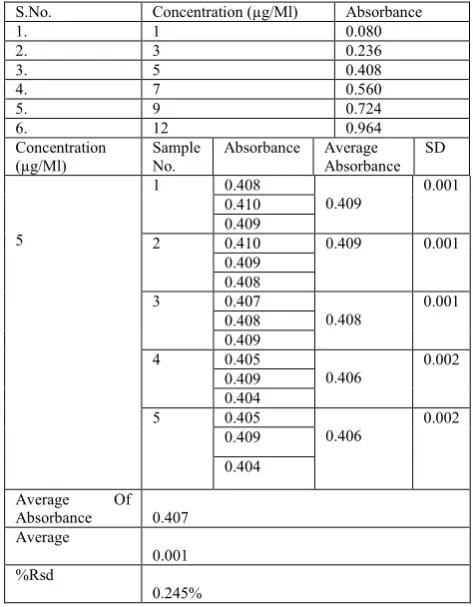
[image:3.595.38.291.467.810.2]Compound- Trimethoprim: Wavelength 319nm
Table 2. Stock Solution Prepared In Dimethyl Sulphoxide
S.No. Concentration (µg/Ml) Absorbance
1. 1 0.080
2. 3 0.236
3. 5 0.408
4. 7 0.560
5. 9 0.724
6. 12 0.964
Concentration (µg/Ml)
Sample No.
Absorbance Average Absorbance
SD
5
1 0.408
0.409
0.001 0.410
0.409
2 0.410 0.409 0.001
0.409 0.408
3 0.407
0.408
0.001 0.408
0.409
4 0.405
0.406
0.002 0.409
0.404
5 0.405
0.406
0.002 0.409
0.404
Average Of Absorbance 0.407 Average
0.001 %Rsd
0.245%
Average of three replicates
Intra-day
[image:3.595.38.285.473.600.2]The %RSD was found to be >1% for intra-day.
Table 3. Intra-day precision data for Trimethoprim
Drug Concentration
(µg/mL)
Absorbance
SD %RSD
Trimethoprim
3 0.236 0.001 0.423
5 0.408 0.002 0.490
7 0.560 0.001 0.178
*Average of three Replicates
Interday
[image:3.595.38.291.629.797.2]The %RSD was found to be >1% for interday.
Table 4. Interday Precision data for Trimethoprim
Drug Concentration
(µg/mL)
Absorbance
SD %RSD
Trimethoprim 3 0.230
0.001 0.434
5 0.415 0.002 0.481
7 0.555 0.001 0.180
*Average of three Replicates
Conclusion
Improvement and validation of two visible spectrophotometric methods applying BCG and DNFB as reagents for TMP determination in investigated formulations were successfully carried out. The near 100 % recoveries and low relative standard deviation values obtained, point to the suitability of the both modified and validated methods for determination of TMP in human and veterinary medicine.
It was concluded that the 1D spectroscopic method could be used for simultaneous determination of trimethoprim immediate-release oral dosage forms.
[image:4.595.182.421.68.182.2]This method could be used for the analysis of active pharmaceutical ingredients in dissolution studies and for quality control purposes. The method is rapid, simple, and economic without the need of high cost investment.
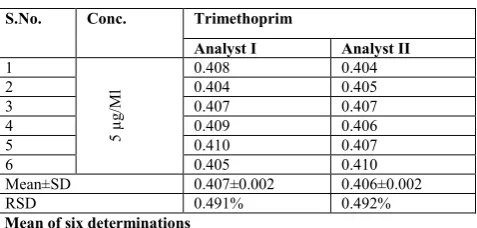
Table no. 5. Results for Ruggedness
S.No. Conc. Trimethoprim
Analyst I Analyst II
1
5
µg/Ml
0.408 0.404
2 0.404 0.405
3 0.407 0.407
4 0.409 0.406
5 0.410 0.407
6 0.405 0.410
Mean±SD 0.407±0.002 0.406±0.002
RSD 0.491% 0.492%
A: Mean of six determinations
Ruggedness studies were carried out using different analysts
Accuracy
Accuracy was performed and % Recovery was found to be 98.47% to 100.39% for Trimethoprim.
Table no. 6. %Recovery data for Trimethoprim
Recovery Level
Initial Sample
Conc. (µg/mL)
Conc. Of Standard Drug
Added (µg/mL)
Total Conc. (µg/mL)
Absorbance Amount of Drug
Recovered (µg/mL)
%Recovery
75% 5 3 8 0.660 8.088 101.1%
0.664 8.13 101.6%
0.662 8.11 101.3%
100% 5 4 9
0.724 8.87 98.5%
0.722 8.84 98.2%
0.726 8.89 98.7%
125% 5 5 10
0.802 9.82 98.2%
0.801 9.81 98.1%
0.779 9.54 95.4%
[image:4.595.92.509.428.541.2]*Average of three Replicates
Table no. 7. Result of Assay
Drug Label Claim Concentration Found (µg/Ml)
TRIM
ETHO
PRI
M
5
6.19 6.19 5.98 6.16
6.22
AVERAGE CONCENTRATION±SD 6.148±0.096
%RSD 1.56%
[image:4.595.84.516.567.683.2]%ASSAY FOUND 122.96%
Table no. 8. Summary of Validation Parameter for Trimethoprim
S.No. Validation Parameter Trimethoprim
1
Linearity
Regression Equation Y=0.067+0.007
Regression Coefficient(r2) 0.997
2 Range 1-12
3 Accuracy(%Recovery) 95.4% to 101.6%
4 Precision(%RSD)
Intraday 0.178-0.423
Interday 0.180-0.481
5 Ruggedness >1%
Acknowledgement
No scientific work is even accomplished without the continuing guidance and encouragement of the investigators supervisors, or the active support and assistance of his colleagues, technical and nontechnical staff. . Let me express my profound sense of gratitude and heartful thanks to Dr. B. Shrivastav Director and Mrs. Neha Arora. I wish to express my deep sense of gratitude to Dr. Sonu Sharma Associate Professor at School of Pharmaceutical sciences, Jaipur national university, for his active guidance, innovative ideas, constant inspiration, and untiring effects which enabled me to complete my thesis work. I wish to thank and gratitude to my parents for his affectionate encouragement, and moral support. On personal note, I would like to express my deep gratitude family members who have encouraged me during the whole tenure of my project work
REFERENCES
Marija Soklevska Et Al, 2015. Optimization, Validation And Application Of Uv-Vis Spectrophotometric-Colorimetric Methods For Determination Of Trimethoprim In Different Medicinal Products Macedonian Veterinary Review 39(1) With
Raju Rajapandi Et Al, 2016. Development And Validation Of Rp-Hplc Method For The Simultaneous Estimation Of Sulfadoxine And Trimethoprim In Bulk And Pharmaceutical Dosage Forms.Der Pharmacia Lettre 2006 8 (19):316-313 Issn 0975-5071,Usa Coden: Dpleb4.
Ramakrishna Veni Pokala Et Al, 2018. Uv Spectrophotometry Method Development And Validation Of Sulfadiazine And Trimethoprim In Combined Dosage Form, International Journal Of Pharmacy And Pharmaceutical Sciences, 10(1):103.
Ya Jun Yang Et Al, 2016. Simultaneous Determination Of Diaveridine, Trimethoprim And Ormetoprim In Feed Using High Performance Liquid Chromatography Tandem Mass Spectrometry Food Chemistry Volume 212, 1 December 2016, Pages 358-366.