warwick.ac.uk/lib-publications
A Thesis Submitted for the Degree of PhD at the University of Warwick
Permanent WRAP URL:
http://wrap.warwick.ac.uk/82169
Copyright and reuse:
This thesis is made available online and is protected by original copyright.
Please scroll down to view the document itself.
Please refer to the repository record for this item for information to help you to cite it.
Our policy information is available from the repository home page.
Advanced Techniques
for Extracting Structural Information
from Neutron Diffraction of Glasses
by
Faizani Mohd Noor
Thesis
Submitted to the University of Warwick
for the degree of
Doctor of Philosophy
Department of Physics
Ko Ma, Raihan Idris
Ko Ayoh, Mohd Noor,
Ko Kluago.
iii
Contents
Title page i
Contents iii
List of tables vii
List of figures ix
Acknowledgements xix
Declaration xx
Abstract xxi
Abbreviations xxii
Chapter 1 – Introduction
1.1 Thesis introduction 1
1.1.1 Introduction 1
1.1.2 Objectives 1
1.1.3 Thesis structure 2
1.2 Glass definition: Structure and kinetics 4
1.3 Oxide glass structures 6
1.3.1 Tellurite glasses 6
1.3.2 Borogermanate glasses 7
1.4 References 7
Chapter 2 – Diffraction
2.1 Introduction 9
2.2 Diffraction theory: Neutron and X-ray 9
2.3 Diffraction techniques 12
2.3.1 Introduction 12
2.3.2 Null neutron diffraction technique 12
2.3.2.1 Neutron scattering length, b 12
2.3.2.2 Null neutron diffraction 13
2.3.2.3 Neutron absorption and resonances 14
2.3.3 Isostoichiometric technique 17
2.3.4 Neutron and X-ray complementary technique 17
2.4 Structural information from diffraction 19
2.4.1 Peak position and shape 19
2.4.2 Peak integrated intensity 20
2.5 References 20
Chapter 3 – Experimental and analytical techniques
3.1 Introduction 21
3.2 Glass-crystal structure comparison 21
3.3 Density measurement 21
3.4 Thermal analysis 22
3.5 Raman spectroscopy 23
3.6 X-ray powder diffraction 26
3.7 Energy dispersive x-ray spectroscopy 26
3.8 Secondary ion mass spectroscopy 27
3.9 Synchrotron X-ray diffraction 27
3.10 Nuclear magnetic resonance (NMR) 28
iv
Chapter 4 – Tellurites
4.1 Introduction 32
4.2 TeO2 crystal structure 32
4.2.1 α, β, γ, and δ polymorphs of TeO2 32
4.2.2 Tellurium (IV) environment 33
4.3 Lithium tellurite crystals 34
4.3.1 General structure 34
4.3.2 Tellurium (IV) environment 36
4.3.3 Non-bridging oxygen environments 37
4.3.4 Lithium environment 38
4.4 Lead tellurite crystals 42
4.4.1 General structure 42
4.4.2 Tellurium (IV) environment 43
4.4.3 Non-bridging oxygen environments 47
4.4.4 Lead (II) environment 48
4.5 Glass structures and models 51
4.5.1 Pure TeO2 glass 51
4.5.2 Tellurite glasses 52
4.5.3 Te-O bond breaking processes 53
4.6 TeO2 structural models 54
4.6.1 Pure TeO2 glass 54
4.6.2 Alkali tellurite glasses 55
4.6.3 Non-alkali tellurite glasses 58
4.7 References 59
Chapter 5 – Lithium tellurite (IV) glasses
5.1 Introduction 61
5.2 Sample preparation and characterisation 61
5.2.1 Sample preparation 61
5.2.2 Density measurement 63
5.2.3 Thermal analysis 65
5.2.4 Secondary ion mass spectroscopy 68
5.3 Raman spectroscopy 69
5.4 Neutron diffraction 73
5.4.1 Null and natural samples 73
5.4.2 Comparison with a-TeO2 and relevant crystal phases 75
5.4.3 Parameterising complex Te-O distances 78
5.4.4 Extension of the TeO2 Model 81
5.4.4.1 Plateau region: x<15 mol% 82
5.4.4.2 Post-plateau region: x>15 mol% 84
5.4.5 Lithium environment 86
5.5 Conclusions 91
5.6 References 93
Chapter 6 – Lead (II) tellurite (IV) glasses
6.1 Introduction 95
6.2 Sample preparation and experimental details 95
6.3 Results – General characterisations 97
6.3.1 Sample quality 97
6.3.2 Density 98
v
6.4 Raman spectroscopy 102
6.5 Total diffraction 104
6.5.1 Neutron and X-ray diffraction 104
6.5.2 Comparison with a-TeO2 and related tellurite crystals 106
6.5.3 Parameterising complex Te-O distances 109
6.5.3.1 TeO peak fitting 109
6.5.4 Extension of the TeO2 model 110
6.5.4.1 Plateau region 110
6.5.4.2 Post plateau region 111
6.5.5 Lead (II) environment 114
6.5.5.1 PbO distances and coordination number 114
6.5.5.2 Parameterising Pb-O distances 119
6.5.6 PbTe5O11 and TeO2 glass similarity 120
6.6 Conclusion 121
6.7 References 122
Chapter 7 – Alkali borogermanate glasses
7.1 Introduction 124
7.2 Introduction to borate germanate and borogermanate glasses 125
7.2.1 Borogermanate glasses 125
7.2.2 Binary alkali borate glasses 125
7.2.2.1 Boron environment 125
7.2.3 Binary alkali germanate glasses 128
7.2.3.1 Germanium environment 128
7.2.4 Binary borogermanate glasses 130
7.2.4.1 Borate and germanate species 130
7.2.5 Alkali borogermanate glasses 131
7.3 Sample preparation and general methodology 131
7.4 Density 134
7.4.1 Results 134
7.4.2 Binary borogermanate glasses 135
7.4.3 Ternary alkali borogermanate glasses 136
7.5 Raman scattering 140
7.5.1 Introduction 140
7.5.2 Binary borogermanate glasses 141
7.5.3 Lithium borogermanate glasses 142
7.5.4 Potassium borogermanate glasses 144
7.6 11B MAS NMR 146
7.6.1 Introduction 146
7.6.2 11B NMR results 150
7.6.2.1 Binary borogermanate glasses 150
7.6.2.2 Lithium and potassium borogermanate glasses 150
7.6.3 Discussion 152
7.6.3.1 Lithium borogermanate glasses and
lithium borosilicate model 152
7.6.3.2 Potassium borogermanate glasses
and sodium borosilicate model 153
7.6.3.3 Boron in lithium and potassium
borogermanate glasses 155
7.7 Neutron diffraction 156
vi
7.7.2 nBO (11B NMR and ND) and nGeO 158
7.7.3 Lithium environment 165
7.8 Conclusion 168
7.9 References 168
Chapter 8 – Conclusions and future work
8.1 Introduction 171
8.2 Tellurite glasses 171
8.3 Borogermanate glasses 174
8.4 References 176
Appendix A
vii
List of tables
Table Title
Page
4.1: The short range order parameters as observed in α-TeO2, β-TeO2, γ-TeO2, and
δ-TeO2 phases. All oxygen atoms shown are bridging oxygen (On/2) atoms. Long (>
2 Å) axial bonds are represented by the striped cylinder and shorter equatorial bonds are represented by the solid cylinder. The TeO2 connectivity in γ-TeO2 is
similar to α-TeO2 but with a different torsion angle. rmax is defined by the upper
limit of the first coordination sphere from the T(r) as in Fig. 4.2
33
4.2: Local order structural parameters in the lithium tellurite crystals. 35
4.3: Te–NBO environments in alkali tellurite crystals. (O - red; Te – gold; Li – blue) 37
4.4: Bond parameters of Te–O and Li–O pairs in lithium tellurite crystals. 38
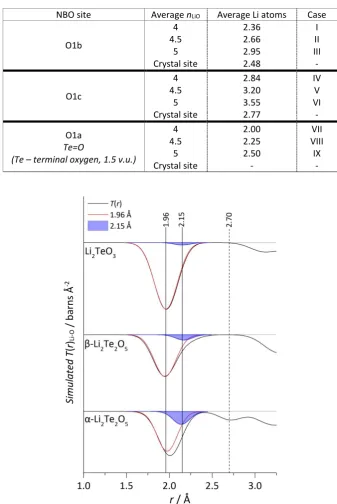
4.5: Average number of Li atoms bonded to O1a, O1b, and O1c for the cases of nLiO
= 4, 4.5, and 5, and the calculated values from the crystal phases.
39
4.6: Running bond valence sum for Li-O bonds in the lithium tellurite crystals. 40
4.7: Local order structural parameters in lead tellurite crystals. 42
4.8: Bond valence calculation of the Te‒O bonds in lead tellurite crystals. 46
4.9: Bond parameters of Te–O and Pb–O pairs in lead tellurite crystals. 47
4.10: Bond parameters of Te–O1b, Te–O1c, and Te–O2 in lead tellurite crystals. 48
4.11: Bond parameter for Pb-O pair in lead tellurite crystals 50
5.1: Glasses appearance by visual observation. The x = 35 mol% glass sample was made to confirm no amorphous material is obtained at this composition using this method. aMade using a Pt/Rh crucible, bMade using a Pt/Au crucible. *Made
in a small batch of approximately 1 g for the purpose of Raman analysis.
62
5.2: Molecular weight MW, density , and molar volume MV values for natural and null xLi2O-(100-x)TeO2 glasses
65
5.3: Temperatures, Tg, Tx, and Tc extracted from the differential thermal analysis
curve as well as calculated glass stability (towards devitrification) parameter for each glass
67
5.4: Melting environments of the same glass system taken from the SciGlass database
viii 5.5: Isotopic ratios of 6Li and 7Li isotopes in the natural, enriched, and null lithium
glasses and natural lithium aluminosilicate mineral crystal. The glass samples (2, 3, 4, and 5) of x = 20 mol% were selected for the SIMS analysis. Sample 4 represents clear glass whereas sample 5 represents the cloudy glass with small crystalline regions of the same composition.
68
5.6: Peak assignment for Raman vibration of Te-O species in TeO2 glasses 70
5.7: Peak parameters obtained from fitting of the Raman spectra 72
5.8: Approximated bond parameters of Te-O1 in the lithium tellurite glasses as in related phases of liquid TeO2 and lithium tellurite crystals.
81
5.9: Peak parameters for Li-O pair correlation functions 88
6.1: Neutron beam exposure time for PbO–TeO2 glass samples 97
6.2: Glass compositions and density values for PbO-TeO2 glasses. 98
6.3: Physical appearance and diffraction information. *Crystal diffraction spots were revealed in the synchrotron X-ray diffraction experiment.
102
6.4: Peak parameters for Te-O and Pb-O peaks obtained from NXFit 110
6.5: Peak parameters for Pb-O and O-O peaks obtained from NXFit 119
7.1: Raman shift values for borate units [24-26, 28-29], b=broad, s=sharp. 127
7.2: Raman shift values for germanate units [19, 37-40] 129
7.3: Alkali borogermanate glasses in this study (with EDX K/Ge value, density, and neutron exposure). Typical K/Ge error is shown in parentheses
132
7.4: nBO for for the lithium and potassium borogermanate glasses 151
ix
List of figures
Figure Title
Page
1.1: 3-dimensional ~5 Å thick slices of crystalline (LEFT) and amorphous (RIGHT) SiO2
[4-5]
4
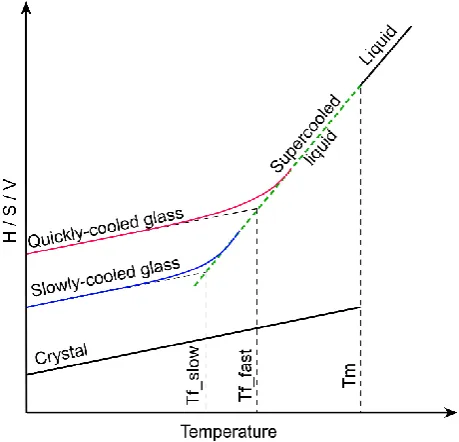
1.2: Physical properties of glass-forming melts as a function of temperature 5
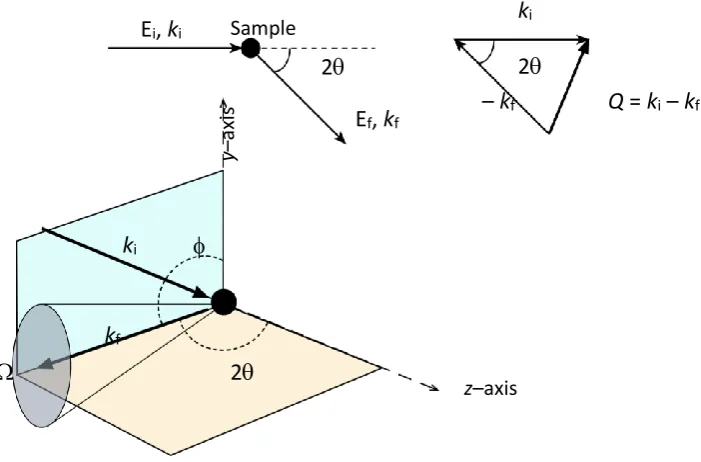
2.1: Schematic of elastic neutron / X-ray diffraction with neutron / X-ray of initial parameters (Ei, ki) scattered off of the sample with 2angle from the initial path
with final parameters of Ef and kf. Momentum transfer vector Q is obtained from
the wave vectors k as shown in the figure on the right. Scattered neutron wave / X-ray into a solid angle of (from y-axis) and 2(from z-axis)
10
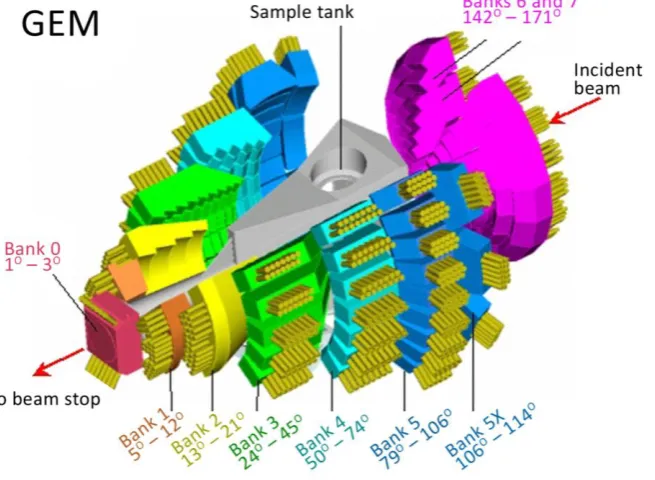
2.2: GEneral Materials GEM diffractometer at ISIS, RAL, Oxford UK. 11
2.3: b values for some isotopes of the elements of the periodic table. 13
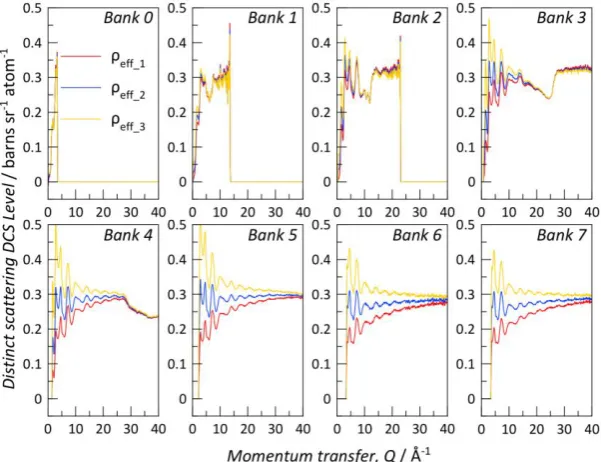
2.4: The effect of correcting the effective density on the absorption correction in I(Q) for each bank.
15
2.5: The effect of correcting the effective density on the total correlation function T(r). 15
2.6: The effect of bank angles on resonance range 16
2.7: Q-dependence of f(Q) in neutron and X-ray diffractions. 18
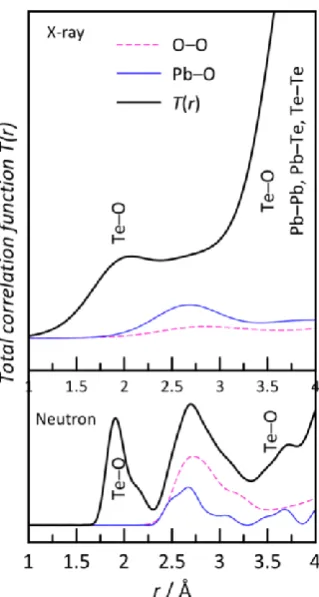
2.8: TN(r) and TX(r) for PbTe
5O11. 18
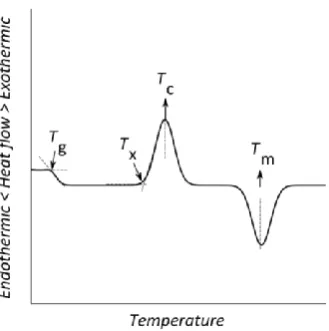
3.1: Differential thermal analysis curve typical of a glass showing glass transition temperatures Tg, crystallisation temperatures TX and TC, and melting temperature
Tm.
23
3.2: Stokes, Rayleigh, and anti-Stokes transitions in Raman spectroscopy. 24
3.3: Reduction of the Raman spectra to remove the Boson peak at low wavenumber. 25
3.4: X-ray diffraction process according to Bragg’s law. 26
3.5: Zeeman splitting and quadrupolar interaction of 11B isotope in B. 28
3.6: Magic-angle spinning (54.73o) MAS NMR setup. 29
x 4.1: The basic [TeO4] unit as in α-TeO2 crystal. Te (gold) is bonded to O (red) atoms
with two short equatorial bonds (<2.00 Å) (grey cylinder) and two long axial bonds (<2.00 Å) (striped cylinder). E is the stereo-chemically active lone-pair of electrons of the Te atom
32
4.2: Simulated total correlation function T(r) of α-TeO2, b-TeO2, and γ-TeO2 crystals.
T(r) for Te-O and O-O pairs are shown in solid red and dotted blue lines respectively. The sum of all pairs is the thicker black line. The T(r) for Te-Te starts at >3 Å. Lorch modification function is used for simulating the T(r).
34
4.3: Simulated T(r) for the lithium tellurite crystals showing the total (Null Li) correlation function (thick black), Te-O pair correlation (red), Li-O pair correlation (dashed blue), and O-O pair correlation (dotted green). T(r) for (Nat Li) Li-O shows a negative distribution due to the value of average scattering length <b> for the Li at the natural abundance (-1.90).
35
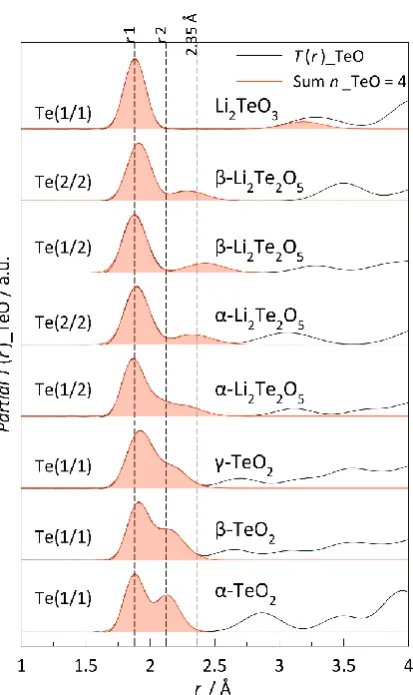
4.4: Partial Te-O pair distributions in TeO2, Li2Te2O5, and Li2TeO3 crystals for each Te
site. The distances can be parameterised with 2 peaks (3 for α-Li2Te2O5) according
to the definition of short(r1), long(r2), and longer(2.35) bonds as shown by the vertical lines.
36
4.5: T(r) for Li-O pair in the lithium tellurite crystals. Average nLiO of 4 is represented
by the peak at ~2 Å. The peak at ~2.7 Å is the next nearest Li-O distance found in α-Li2Te2O5.
39
4.6: Simulated T(r) for Li–O pairs in lithium tellurite crystal for individual Li sites 41
4.7: Simulated T(r) for the lead tellurite crystals, selected for comparison with the glass structure. Te-O pair (red area), Pb-O pair (blue area), and O-O pair (green dotted).
43
4.8: Te environments in tellurite, lithium tellurite, and lead tellurite crystals. rTeO is
compared to the short and long bonds of 1.879 and 2.121 Å found in α-TeO2
(vertical lines). The evolution of the longer long bond of Te-O is a function of composition, regardless of the modifier cation type.
44
4.9: Simulated T(r) for Te‒O pairs in the selected lead tellurite crystals. Orange area marks the sum of Te‒O peaks due to Te‒O pairs within the first coordination shell.
45
4.10: Partial T(r) for each Te site in PbTe5O11. 45
4.11: Simulated T(r)PbO for the lead tellurite crystals. Orange area is the sum of the
average nPbO of about 8.
49
4.12: Partial T(r)PbO simulated using thermal parameters from the crystal structure and
a value similar to the experimental results.
51
xi 4.14: Upper and lower limits of second oxide MaOb in binary MaOb-TeO2 glasses [27] 52
4.15: [TeO4/2] ↔ [TeO3/2O–] equilibrium for 2Li+ + O2– + 2[TeO4] ↔ 2([TeO4]– Li+).
McLaughlin et al. [26]
53
4.16: [TeO3/2O–] ↔ [TeO1/2O2–] equilibrium. Units taken from McLaughlin et al. [26] 53
4.17: Transformation of [TeO4] unit to [TeO3] unit via intermediate [TeO3+1] unit. [TeO4]
unit is represented by the TeO2 polyhedron in α-TeO2 crystal. This intermediate
unit is drawn with the longest bond in scale as found in α-Li2Te2O5 (longest r > 2.2
Å). The resonance structure is not shown in the [TeO3] unit. This unit is
represented by a TeO3 polyhedron found in Li2TeO3.
54
4.18: The fractions of [TeO3], [TeO4], NBO(O2), and BO(O1) units as a function of nTeO
as derived in Eqn 4.4 The dotted shows the fractions of the units found in the roller-quenched pure TeO2 glass corresponding to the nTeO value of 3.68 [24].
55
4.19: The average nTeO model for TeO2 glass based on K2O-TeO2 glasses. For x < 14.3
mol%, nTeO is constant at 3.68. This is based on the nTeO value of 3.68 which was
experimentally obtained for pure TeO2 glass. 14.3 mol% is the deviation point
determined by the fractions of [TeO3] and [TeO4] units from nTeO. For x > 14.3
mol%, nTeO is best fitted with the b value of 1 [28], revealing 25% of the bond
valence contribution from O2 (bridging oxygen) sites.
57
4.20: Figure 4.20: nTeO values for the alkali (Li2O and K2O), divalent (PbO and ZnO) and
trivalent (B2O3 and Al2O3) tellurites.
58
5.1: Phase diagram for the Li2O-TeO2 system [2]. There is a eutectic composition at
about 22.5 and a peritectic at 30 mol% Li2O. Two lithium tellurite phases (Li2Te2O5
and Li2TeO3) are shown in the figure. The 5 glass compositions in this study are
marked by the dotted lines.
62
5.2: (a) The measured densities for the Li2O-TeO2 glasses: natural glasses (blue,
left-pointed triangle) and null glasses (red, right-left-pointed triangle) compared to SciGlass data (grey circle) and pure amorphous TeO2 from Barney et al. [3]. (b)
Molar volumes of the glasses (symbols as in (a) compared with the SciGlass data. Error bars for the natural and null glasses are within the points shown.
63
5.3. Calculated number density for constituent atoms as a function of Li2O
composition for both natural and null glasses (red triangles). The number density plots for O and Te atoms in the glasses show the deviational behaviour compared with the crystals (linear fit, dashed black line).
64
5.4: Figs. (a) to (f) show the thermal analysis curves for xLi2O.(1-x)TeO2 glasses for x =
10, 15, 20, 25, 30 and 35* mol% showing the heating curve (black, top) and cooling curve (red, bottom) lines for each glass composition. *x = 35 mol% is a glass partially-crystallised with Li2Te2O5. The glasses were heated at a rate of 10 oC/min and Newtonian cooled. (g) Stack plot of heating curves showing two
compositional regions of similar crystallisation behaviour; lower Li2O
xii Li2O compositions, x = 25, and 30 mol% with three exothermic peaks. x = 35 mol%
is made up of mostly Li2Te2O5 crystal phase (33.33 mol% of Li2O). Close
resemblance between x = 30 and 35 mol% reflects the proximity of the x = 30 mol% glass to the α/β-Li2Te2O5 phase field.
5.5: The values of Tg for the glasses at different nominal compositions. Tg can be
linearly fitted with two lines to highlight the intersection at x ~ 15 mol%, similar to the behaviour observed in the density values. Inset shows the glass stability, Tx-Tg. The data are fitted with a spline interpolation showing the behaviour of the
glass stability as a function of Li2O content with a maximum stability towards
devitrification at x ~ 20 mol%. This is supported by the cooling curve for this glass in Fig 5.4 where negligible crystallisation was observed upon cooling. Black circles are the Tg values for the Li2O-TeO2 glasses prepared using silica crucible for
splat-quenching method and a roller-quenched series. The red circles are the Tg values
from the glasses prepared using a similar environment as for the studied glass; using a platinum crucible and splat quenching method.
67
5.6: Graphical representation of 6Li and 7Li isotopic percentages in the samples of
1(mineral spodumene), 2(natural glass), 3(null glass), 4(enriched glass), and 5(enriched glass with glass and crystal inclusions). Similar isotope distribution in glassy and glassy/crystalline state is confirmed from SIMS analysis on samples 4 and 5. NB – the spread in values for spodumene indicates the progress of the set-up process.
69
5.7: Raman spectra for the Li2O-TeO2 glasses. The y-axes are (a) normalised measured
intensity, (b) normalised reduced intensity. (a) was normalised to the maximum intensity, (b) was reduced by elimination of the Boson peak [15] and (c) is the area-normalised reduced intensity in the region of interest encompassing the Te-O vibrations.
69
5.8: (a) Comparison of the Raman peak manifold shape from the 10 mol% and 30 mol% glasses with the Raman spectra of the related crystals. (b) Peak de-convolution of the Te-O vibrations according to the peak assignment as in Table 5.6
71
5.9: (a) showing the peak areas from the fits for each composition and (b) showing the nTeO calculated.
72
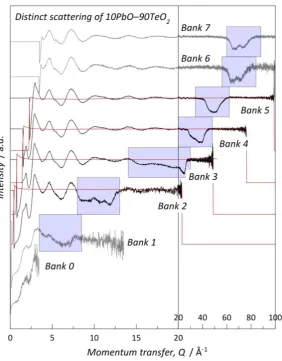
5.10: Distinct scattering (i(Q)) and total correlation function (T(r)) for the null lithium tellurite glasses. An offset is used between each plot for clarity. i(Q) with a Q maximum value of 35 Å-1 (a) was Fourier-transformed to T(r) (b) for each glass
composition.
74
5.11: Distinct scattering, i(Q), and total correlation function, T(r), for the natural lithium tellurite glasses. An offset is used between each plot for clarity. i(Q) with a Q maximum value of 35 Å-1 (a) was Fourier-transformed to T(r) (b) for each glass
composition.
74
5.12: T(r)/wTeO and T(r)/wOO for the null glasses, stacked and compared with
amorphous TeO2 for each x giving a qualitative comparison of the evolution of the
xiii tellurium-oxygen environment in glasses on addition of Li2O to a-TeO2. T(r) for the
glasses are weighted to the coefficient of (2-δij)cibibj . *a–TeO2 data taken from
Barney et al.[3]
5.13: (a) Te-O and O-O distances, and the magnitude of lone-pair vectors found in α-TeO2, β-TeO2, γ-TeO2, α-Li2Te2O5, β-Li2Te2O5, and Li2TeO3 crystal phases; (b)
Comparison of T(r) for a-TeO2 (green solid line) to the simulated T(r)’s for the TeO2
polymorphs [Barney et al., to be published].
77
5.14: Approximation of NullT(r) to γ-TeO
2 and β-Li2Te2O5. T(r)Te-O partials for the glasses,
γ-TeO2 crystal, and β-Li2Te2O5 crystals are shown in open circle, blue, and dashed
green respectively. Simulated T(r)Te-O for the glasses (red), simulated from the
mixture of the crystals.
78
5.15: Peak fitting of the correlation function for x = 10 mol% (null Li2O-TeO2 glass) with
three (arbitrary) Gaussians convoluted with the Lorch modification function [22]. For simplicity, O-O distribution is represented by a Gaussian of which also contains longer Te-O distances
79
5.16: Average tellurium to oxygen coordination number (nTeO) as a function of Li2O
content, obtained by integration, compared to the values obtained in K2O-TeO2
glasses [3]. The error for the average nTeO(Li) is shaded in grey.
80
5.17: The selection of the average nTeO for x < 15 mol% (plateau region) and its effect
on the average nTeO fit quality for x > 15 mol% (post-plateau region).
82
5.18: The TeO2 Model for Li2O-TeO2 system for plateau (x < 15 mol%) and post-plateau
(x > 15 mol%) regions.
84
5.19: The number of required Li-O bonds in both plateau and post-plateau regions and the contribution from O1 (O1a, O1b, O1c) and O2 type of oxygen atoms as a function of R unit of Li2O in 1 unit of TeO2.
85
5.20: nLiO in various glass formers. Legend: a [34], b[35], c[36], d[40], e[37], and f[38].
Ref: a, b, c, and f were obtained by isotope substitution neutron diffraction, d was obtained by molecular dynamics and e was obtained by the combination of natural neutron diffraction combined with molecular dynamics.
87
5.21: T(r) of null (black) and natural (red) glasses and the difference (blue) representing the lithium partial correlation functions.
88
5.22: Difference plots stacked with fits. Dotted lines are the T(r) for Li-O partials, red and green peaks are the fitted peaks, and black lines are the residuals of the fit. The red peak contributes to the nLiO value of 4.
89
5.23: nLiO obtained by means of peak fitting with two Gaussians at 2.00 and 2.25 Å.
Higher nLiO observed in x = 10, 15, and 20 mol% Li2O is due to the contribution
from the peak at 2.25 Å (rLiO as seen in β-Li2Te2O5 phase) Error bars are large due
to poor signal to noise ratio because of the 6Li absorption.
xiv 5.24: Comparison of rLiO found in various lithium tellurite crystals as well as in Li2O.
Slight shift is observed.
90
6.1: Phase diagram for the PbO-TeO2 system reproduced from Stavrakieva et al.[1]. 96
6.2: (a) shows the measured densities for the PbO-TeO2 glasses based on nominal
composition (red upward pointed triangle) and based on EDX analysis (blue downward pointed triangle) compared to the SciGlass data (open circle). (b) shows the calculated molar volumes of the glasses (symbols as in (a) compared with the SciGlass data. Error bars for the glasses are within the points shown. (c), (d), and (e) show the calculated number densities for constituent atoms, symbol as in (a). Black filled circles are values from the crystal phases (γ-TeO2, PbTe5O11,
Pb2Te3O8, PbTeO3) with the dashed line being the line of best fit. (1), (2), and (3)
in (c) reveal groups of O number density which may result from different preparation environments and/or structural differences.
98
6.3: High energy X-ray diffraction patterns for xPbO-(100–x)TeO2 glasses for x = 10,
12.5, 15, 17.5, 20(a) and 25 mol%. Significant crystallisation is seen in 20(a) and 25 mol% PbO samples. Negligible crystallisation is seen in 10 mol% PbO sample (spots ringed in red).
100
6.4: 1D plots of high energy X-ray diffraction spectra for xPbO-(100–x)TeO2 glasses for
(a) x = 10 and 25 mol% compared to published data for PbTe3O7 from
PanAnalytical software database and (b) stack plot of x = 10, 12.5, 15, 17.5, 20(a) and 25 mol%
101
6.5: (a) experimentally obtained Raman spectra (normalised); (b) reduced and area-normalised Raman spectra showing the region of interest encompassing the Te-O vibrations; (c) Raman peak deconvolution of contributions from [TeTe-O4] and
[TeO3] units; (d) area of the peaks in (c) as a function of x; and (e) average nTeO
obtained compared to the values from Sekiya et. al. [17] x = 20 represents 20(a) mol% of PbO
103
6.6: (a) shows the distinct scattering function i(Q) for PbO-TeO2 glasses with 10, 12.5,
15, 17.5, and 20(b) mol% PbO and (b) shows the total correlation function TN(r)
obtained by taking the Fourier transforms of the functions in (a) with a Qmax value
of 35 Å-1
105
6.7: (a) shows the distinct scattering function i(Q) for PbO-TeO2 glasses with 10, 12.5,
15, 17.5, and 20(a) mol% PbO and (b)shows the total correlation function TX(r)
obtained by taking the Fourier transforms of the functions in (a) with a Qmax value
of 20 Å-1
105
6.8: The sums of fit and the residuals from the simultaneous fitting of the X-ray and neutron diffraction data.
106
6.9: Comparison of the total T(r) (weighted to the Te–O pair weighting factors) to highlight the Te–O pair environment in the glasses with respect to the pure TeO2
glass.
xv 6.10: Comparison of the weighted T(r) of 15PbO-85TeO2 to pure TeO2 glass and of
17.5PbO-82.5TeO2 to Null20Li2O-80TeO2 glasses to show the plateau and
post-plateau similarities respectively. Individual Te-O peaks represent the 17.5PbO sample.
107
6.11: The residual of T(r) 20PbO-80TeO2 – T(r) Null20Li20-80TeO2 glasses, showing the
“PbO” peak. The data for the 20PbO(b) sample are used.
108
6.12: Fitted Te-O peaks for 17.5PbO-82.5TeO2 glass from NXFit 109
6.13: The determination of b value for PbO-TeO2 glasses 112
6.14: The average nTeO for PbO-TeO2 glasses, compared with Li2O-TeO2 and K2O-TeO2
glasses
113
6.15: The number of bonds in the plateau and post-plateau regions for b = 2.1, and b = 1.15.
114
6.16: The average PbO coordination number, nPbO, reported in various binary lead
glasses. Ref: d [22], b [19], e [26], f [24], a [20], c [21], h [2] and g [25].
115
6.17: PbO distance, rPbO, reported for various binary lead glasses as in Fig. 6.15 and
references therein. The distances are as expected from Brese and O’Keefe [27]
115
6.18: Figure 6.18: PbO and OO peaks from NXFit in 17.5PbO-82.5TeO2 and PbTe5O11. 116
6.19: Fitted peaks for 17.5PbO-82.5TeO2 glass from NXFit 117
6.20: The distances of PbO and OO in PbTe5O11 from 2.4 to 3.1 Å 117
6.21: Contribution of short rOO (O8) in an edge-sharing connection in PbTe5O11. 118
6.22: Contribution of short rOO (O9) in an edge-sharing connection in PbTe5O11. 118
6.23: Typical corner-wise TeO2 network connectivity in the glasses where the rOO is
about 2.6 Å.
118
6.24: Similarity of T(r)TeO in pure TeO2 glass, PbTe5O11, and PbO-TeO2 glasses 120
6.25: Individual TeO environment for 5 Te sites in PbTe5O11 121
7.1: Superstructural borate units [27] 126
7.2: Figure 7.2: nBO in alkali borates and the borate model, nBO = 3 + x/(100-x), nBO
values for Li, Na, K, Rb, and Cs were taken from [8]. The thick dashed line represents initial [BO4]– formation (Eqn. 7.1)
xvi 7.3: Raman spectra for lithium and potassium borate glasses, taken from Dwivedi and
Khanna [25]
127
7.4: nBO in alkali germanates, a[31], b[35], c[32, 34],d[33] and the germanate model
[21]
129
7.5: Raman spectra for lithium and potassium germanate [17]. 130
7.6: Optimised bridging oxygen environments in binary borogermanate glasses [41]. 131
7.7 Ternary plot for nominal glass compositions in this study 133
7.8: K/Ge ratio from EDX and nominal composition 134
7.9: The density value and its derivatives for the binary borogermanate glasses 135
7.10: Density plot for lithium and potassium borogermanate glasses 137
7.11: Molar volume plot for lithium and potassium borogermanate glasses 138
7.12: Number density plot for B and Ge in lithium and potassium borogermanate glasses
139
7.13: Number density plot for O in lithium and potassium borogermanate glasses 139
7.14: Number density plot for Li and K in lithium and potassium borogermanate glasses 140
7.15: a) Raman spectra of pure GeO2 glass (solid black line) and binary borogermanate
glasses (solid colour lines) with their simulated spectra from pure GeO2 and pure
B2O3 glasses (dashed lines); (b), (c), and (d) are the same spectra divided into 3
regions: 100-360, 300-600, and 600-900 cm-1 to highlight the region of interest
for Ge-O and B-O vibrations.
141
7.16: Assignment of borate and germanate vibrations in lithium borogermanate glasses
142
7.17: The Raman spectra of the lithium borogermanate glasses. 143
7.18: LBG Raman spectra compared to LG, taken from Henderson [17]. 144
7.19: Raman spectra for potassium borogermanate glasses, compared to potassium germanate glasses
145
7.20: Vibrations of B-O associated with NBO in KBG glasses 146
xvii
7.22: The reedmergnerite group, taken from [27] 148
7.23: The mechanism of alkali distribution in borosilicate network 149
7.24: 11B MAS NMR spectra for vitreous B
2O3 and binary borogermanate glasses 150
7.25: 11B NMR spectra for the lithium and potassium borogermanate glasses 151
7.26: Comparison of the nBO for the LBG glasses to the lithium borosilicate model [1] 152
7.27: Comparison of the nBO for the KBG glasses to the sodium borosilicate model 154
7.28: 11B NMR spectra for M
2O–BO1.5–GeO2 (M=Li (dashed blue, 14.15 T) and K (solid
pink, 14.1 T))
155
7.29: Total correlation function T(r) and distinct scattering i(Q) for lithium borogermanate glasses
157
7.30: Total correlation function T(r) and distinct scattering i(Q) for potassium borogermanate glasses
158
7.31: Parameterisation of the B-O peak corresponding to [BO3] and [BO4] units 159
7.32: nBO and nGeO for LBG glasses from various methods 161
7.33: nBO and nGeO for KBG glasses from various methods 161
7.34: T(r) of LBG and KBG glasses fitted with a peak corresponding to a [GeO4] to
highlight the necessity of more peak(s) corresponding to a higher coordinated [GeO4+] unit.
162
7.35: Comparison of the T(r)GeO for LBG and KBG glasses highlighting the area, hence
nGeO difference.
163
7.36: nGeO and nBO agreement in LBG glasses 164
7.37: nGeO and nBO agreement in KBG glasses 165
7.38: T(r)-Nat, T(r)-Null, and T(r)-Difference for the selected samples of 20 mol% Li2O
for each B series
165
7.39: T(r)-Difference for the selected samples of 20 mol% Li2O for each B series with
Li-O peaks
166
7.40: Li site (1/1) found in approximated LiBGeO4 crystal phase [60]. 167
xviii 8.1: Molar volume and number density for constituent atoms in Li2O-TeO2 and
PbO-TeO2 glasses. Red dashed line is a guide-to-the-eye fit, connecting the glasses
and the pure-TeO2 glass (a-TeO2).
172
8.2: nTeO for Li2O-TeO2, K2O-TeO2, and PbO-TeO2 glasses 173
xix
Acknowledgement
First and foremost, I would like to express my gratitude to my supervisor, Dr. Diane Holland. Without her, this would not be possible. Truly, from the bottom of my heart, there are no words I could use to describe my biggest gratitude to her.
Secondly, I would like to thank my co-supervisors; Dr. Alex Hannon, Dr. Emma Barney, and Dr. Oliver Alderman for all the help with neutron and X-ray diffraction analysis, and Dr. Mark Newton with the Raman (and EPR) instrumentation. I would also like to thank Prof. Ray Dupree and Dr. Tom Kemp for the help with nuclear magnetic resonance, Dr. Chris Benmore (and Dr. Oliver Alderman) for the synchrotron X-ray diffraction data from APS, Argonne National Lab, USA, Dr. David Walker for the X-ray diffraction facility, Dr. Richard Morris for the secondary ion mass spectroscopy (SIMS) analysis, Dr. Ian Farnan for the mineral for SIMS analysis, Mr Dave Hammond for the thermogravimetry analysis, Mr. Steve York for the energy dispersive X-ray facility.
The Department of Physics, University of Warwick, STFC’s Rutherford Appleton Laboratory, Advantage West Midlands, European’s Society of Glass Technology, Universiti Teknologi Malaysia, and Ministry of Higher Education of Malaysia are thanked for their contribution to this research (facilities, opportunities, and financial)
xx
Declaration
I declare that the work presented in this thesis is my own except where stated otherwise, and was carried out entirely at the University of Warwick, during the period of May 2012 to May 2016, under the supervision of Dr. Diane Holland. The research reported here has not been submitted, either wholly or in part, in this or any other academic institution for admission to a higher degree. It is anticipated that further part of this work will be submitted for publication in due course.
xxi
Abstract
The structures of lithium and lead tellurite glasses (Li2O-TeO2 and PbO-TeO2) are studied using
the combinations of neutron diffraction, isotope substitution neutron diffraction, and synchrotron X-ray diffraction. Additional complementary methods such as density measurement, thermal analysis and Raman spectroscopy show that the tellurite networks in lithium and lead tellurite glasses exhibit similar behaviour as a function of composition. From the diffraction data, real-space interatomic information on the glasses was extracted. The local environments of Te remain largely unchanged in both glasses if the second content is less than 15 mol%, as reported earlier for K2O-TeO2. For Li2O or PbO contents greater than 15
mol%, however, the average Te-O coordination number changes with composition and differently for the two oxides. A TeO2 Model, which has been successfully applied to K2O-TeO2
glasses, is extended to Li+ and Pb2+. By comparing the total correlation functions of the glasses
to relevant crystal phases, the short-range parameters of the crystals can be used to optimise the model for Li+ and Pb2+ and explain the value of the average coordination number of Te.
The environments of Li+ and Pb2+ were extracted using isotope substitution neutron diffraction
(Li) and complementary neutron–X-ray diffraction (Pb). In the glasses studied (10, 15, 20, 25 and 30 mol% Li2O and 10, 12.5, 15, 17.5 and 20 mol% PbO), both Li+ and Pb2+ behave as
modifiers with the average nLiO = 4 – 5 and nPbO = 8 with the distances rLiO and rPbO comparable
to crystal phases of similar composition.
The structures of lithium and potassium borogermanate glasses are studied using the combinations of neutron diffraction, isotope substitution neutron diffraction, and 11B MAS
NMR. From the complementary methods such as density measurement, and Raman spectroscopy, changes are seen to occur in both borate and germanate networks. From 11B
NMR, the average B-O coordination number, nBO, in lithium borogermanate glasses is different
from nBO in potassium borogermanate glasses of the same stoichiometry and resembles the
behaviour of Li+ and K+ in in borosilicate glasses, as described by the Zhong’s lithium
borosilicate model and Dell and Bray’s sodium borosilicate model. From neutron diffraction data (null isotope neutron diffraction for lithium borogermanate), the average Ge-O coordination number nGeO is extracted and, like nBO, nGeO in lithium borogermanate is different
from potassium borogermanate. In the former, nGeO increases as a function of Li2O, whilst in
the latter, nGeO shows a maximum at about 20% K2O. For Li+, the average Li-O coordination
number nLiO can be obtained using the difference technique (using diffraction data from
samples made with natural and null-scattering lithium isotopes). For the limited samples examined, nLiO was found to have a value of 4 to 5 with two distinct Li-O distances which can
xxii
Abbreviations
BV Bond valence
EDX Energy dispersive X-ray
BO Bridging oxygen
EXAFS Extended x-ray absorption fine structure FWHM Full Width at Half Maximum
GEM General Materials (diffractometer) ISND Isotope substitution neutron diffraction
LP Lone-pair
MAS Magic Angle Spinning
NBO Non-bridging oxygen
ND Neutron diffraction
NMR Nuclear Magnetic Resonance
RMS Root mean square
RS Raman spectroscopy
SIMS Secondary ion mass spectroscopy
TO Terminal oxygen
1
Chapter 1 – Introduction
1.1
Thesis introduction
1.1.1
Introduction
This thesis is entitled “Advanced Techniques for Extracting Structural Information from Neutron Diffraction of Glasses”. Its aim is to study the structure of complex oxide glasses by means of diffraction (neutron and/or X-ray) techniques and to apply various contrast techniques (null and natural isotope neutron diffraction (ND) difference technique, neutron and X-ray diffraction complementary technique, and isostructural neutron diffraction technique). These contrast techniques simplify the data obtained and thereby extract information about specific atom environments. Other techniques, such as nuclear magnetic resonance (NMR) and Raman scattering (RS), are also used as complementary probes of the glass structure.
1.1.2 Objectives
In this study, two series of binary tellurite glasses (Li2O–TeO2 and PbO–TeO2), and two series
of ternary alkali borogermanate glasses (Li2O–B2O3–GeO2 and K2O–B2O3–GeO2) are studied.
In the binary tellurite glasses, the focus of the study is to probe the environments of Te(IV) atom in terms of:
a) The change in the Te environment as a function of the composition of the second oxide of Li2O (univalent, alkali metal oxide, typical modifier), or PbO
(divalent, heavy metal oxide, typical intermediate) and deduce a TeO2 model for
each case.
b) The stereochemical activity of the lone-pair (LP) cation on Te (one 5s2 lone-pair)
in the presence of the second oxide of Li2O (with no lone-pair) or PbO (with one
6s2 lone-pair).
This involves the:
I. Study of the environment of Te and Li in Li2O–TeO2 glasses using isotope
substitution neutron diffraction (ISND) technique, which is to:
a. Measure the average Te–O and Li–O coordination numbers, nTeO and
nLiO.
b. Measure the average Te–O and Li–O bond distances, rTeO and rLiO.
2
d. Compare with the TeO2 Model for alkali metal oxides.II. Study of the environment of Te and Pb in PbO–TeO2 glasses using a combination
of neutron and X-ray diffraction techniques, which is to:
a. Measure the average Te–O and Pb–O coordination numbers, nTeO and
nPbO.
b. Measure the average Te–O and Pb–O bond distances, rTeO and rPbO.
c. Probe the [TeOn] and [PbOn] species/units present in the glasses.
d. Compare with the TeO2 Model for alkali metal oxides.
In the ternary borogermanate (M2O–B2O3–GeO2, M = Li, and K) glasses, the focus of
the study is to probe the environments of B and Ge in a mixed glass former system in terms of:
a) The effect of different alkali metal (Li and K) on the B environment in the ternary borogermanate glasses.
b) The effect of different B environment on the Ge environment in both M = Li and K systems.
This involves the study of alkali borogermanate (M2O–B2O3–GeO2, M = Li and K) glasses using
the combination of standard neutron diffraction, isotope substitution neutron diffraction and 11B nuclear magnetic resonance techniques, which is to:
a. Measure the average B–O coordination number, nBO for M = K and Li
b. Measure the average Ge–O coordination number, nGeO for M = K and Li
c. Measure the average B–O bond distance, rBO for M = K and Li
d. Measure the average Ge–O distance, rGeO for M = K and Li
e. Probe the [BOn] and [GeOn] species present in the glasses for M = K and
Li
f. Deduce a B2O3 (in ternary borogermanate) model for M = K and Li
g. Deduce a GeO2 (in ternary borogermanate) model for M = K and Li
h. Compare with the alkali borosilicate models
1.1.3
Thesis structure
Chapter 1 discusses the introduction of the thesis, including the objectives of the study, and the thesis structure. A brief introduction of the glass theory and the glass systems of interest in this study (tellurite and borogermanate) is also included.
3
the specific approaches used in this study, for instance, the null neutron diffraction technique, the isostoichiometric technique, and the neutron and X-ray complementary diffraction technique. The methods for extracting structural information from the diffraction data are discussed, which includes interpretation in terms of short range analysis of the glass structure.Chapter 3 discusses the methods used in acquiring and processing the data in this study. The methods include density measurement, thermal analysis, Raman scattering, neutron and X-ray diffraction, as well as nuclear magnetic resonance.
Chapter 4 describes the local environments in pure TeO2, Li2O-TeO2 and PbO-TeO2
crystals, in terms of average distances and coordination numbers as a function of composition and type of modifier. Important approximation parameters are obtained from these crystal structures which are later used in the glass short-range structure analysis. The literature on tellurite glass structure is then reviewed. This includes the structure of pure TeO2 glass and alkali tellurite glasses. The mechanism of TeO2 network changes as a function
of a modifier is also discussed, which later serves as a basis for understanding the Li2O-TeO2
and PbO-TeO2 glasses. The chapter later describes the lone-pair activity of Te in pure TeO2,
lithium TeO2, and lead TeO2 crystals.
Chapter 5 describes the preparation of the null and natural lithium tellurite glass samples and their general characterisations, including determination of the isotopic ratio of
6Li/7Li. Raman scattering is used to identify species in the glasses and derive a
semi-quantitative estimate of the average Te-O coordination number nTeO. In the neutron
diffraction section, the total correlation functions T(r) for the null glasses are used to obtain the rTeO distribution and average nTeO as a function of the modifier Li2O content, x, which are
compared with pure TeO2 and the related lithium tellurite crystals to highlight the
differences and similarities in both Te and O environments. As will be described in the chapter, the average nTeO(x) values obtained are discussed based on two regions, plateau
(x<15 mol%) and post-plateau (x>15mol%). The lithium environment is obtained from the natural – null difference T(r).
Chapter 6 describes the preparation method of the PbO-TeO2 glass samples and
their general characterisation. Raman scattering is used to identify species in the glasses and the information used to derive a semi-quantitative estimate of nTeO. The neutron total
correlation functions TN(r) for the glasses are compared with TN(r) for pure TeO
2 (glass and
crystal phases) and PbTe5O11 crystal to highlight the differences and similarities in Te, Pb,
4
TX(r), the Te-O distance distributions and average n
TeO are extracted as a function of the
modifier PbO content, x. The average nTeO(x) values are again discussed based on two
regions, plateau (x<15 mol%) and post-plateau (x>15mol%). The lead environment is later considered in conjunction with the tellurium environment to obtain a consistent description of the glass structure.
Chapter 7 presents preliminary results and discussion for alkali borogermanate glasses (lithium and potassium). Density analysis is initially used to observe the anomalous change (if any) in the borate-germanate glass network and the trend is compared with the alkali borate and germanate glasses. Raman scattering is used to compare the vibrations of various species present in the ternary alkali borogermanate glasses with respect to the binary borate and germanate glasses. The difference in the vibrations (species) formed in the lithium and potassium borogermanate glasses are also discussed to infer that the changes occur in both borate and germanate network. From 11BMAS NMR analysis on these
two samples, B environments in lithium and potassium borogermanate glasses are revealed follow the lithium and sodium borosilicate models by Zhong et al. [1] and Dell and Bray [2], respectively.
Chapter 8 concludes the study on these glass systems based on the knowledge obtained and recommends some contexts for further study.
1.2
Glass definition: Structure and kinetics
The strict definition of a glass is, a material (solid) that has no long-range order (non-crystalline/amorphous) and exhibits a glass transition temperature [3].
Figure 1.1: 3-dimensional ~5 Å thick slices of crystalline (LEFT) and amorphous (RIGHT) SiO2 [4-5].
From the definition, structurally, a glass is regarded as a solid, which lacks long-range order but possesses short-long-range order, as shown in Fig. 1.1. In both crystalline and amorphous SiO2, a silicon atom (blue) is coordinated to 4 oxygen atoms (red) in a tetrahedral
shape. In crystalline SiO2, both short and long-range orders are present whereas in
5
amorphous SiO2, only the short-range order of the tetrahedral [SiO4] unit is preserved whiledisorder is introduced in terms of connectivity and bond angle distribution.
Goldschmidt stated that glasses with formula RnOm form more easily when the ratio
of the ionic radius of R to O is from 0.2 to 0.4. This mostly corresponds to R coordinated to O in tetrahedral units, as in SiO2 and GeO2. This idea was later expanded by Zachariasen [6]
who stated that: (1) oxygen cannot be connected to more than 2 cations, (2) the coordination of the cation is small, 3-4, (3) oxygen polyhedra must share corners, not edges or faces, and (4) for a continuous random network, at least 3 corners must be shared. These characteristics, in general, imply that glass formation is more likely to happen for open structures with a low packing density of polyhedra. These rules can be used to identify the role of oxides in glass network formation: glass network former (conventional or conditional), glass modifier, or intermediate between these two. Apart from his structural theory of glass formation, Zachariasen also stated that to form glasses, the melt must be cooled under proper conditions.
[image:28.595.199.429.465.686.2]This leads to the kinetic theory of glass formation. In theory, any material can be made into a glass if the melt can be held in a supercooled state (maintaining its liquid form below the melting point). This can be done by preventing nucleation and crystal growth during the cooling process. One of the ways of doing this is by rapidly quenching a melt. The kinetics of glass formation diagram is shown in Fig. 1.2.
Figure 1.2: Physical properties of glass-forming melts as a function of temperature.
In the figure, if the melt is held at Tm long enough so the molecules can rearrange
6
crystalline phase of that melt would form. To form the glass, the melt should be quickly cooled. The glass molecules are “frozen” at the fictive temperature Tf. Higher Tf(consequently higher Tg) would mean higher entropy, enthalpy, or volume (structure
resembles more the liquid phase rather than the crystal). The concept of Tf was introduced
by Tool [7] and is often used synonymously with the Tg term, even though they are defined
differently. Tg is the experimentally measured glass transition temperature, a temperature
where its instantaneous viscosity is about 1012 Pa s whilst T
f is the actual temperature of the
metastable supercooled liquid above the glass transition range (instantaneous temperature of the melt).
An important parameter, when describing or probing glass structure, is the range. For the short range, the parameters are the polyhedral units [ROn] present, the average
coordination number nRO, bond length rRO, and associated bond angles. These parameters
can be obtained by experiment and simulation. The parameters for the intermediate range (including neighbouring polyhedra) such as connectivity, bond angle, and bond torsion angle are more difficult to determine experimentally but can be obtained by simulation. In a glass, there is no long-range order.
1.3
Oxide glass structures
1.3.1 Tellurite glasses
7
a trigonal bipyramidal arrangement) [12] ; (b) the empty 5d orbital in Te [13-15] ; and (c) the presence of the lone-pair of electrons in Te [16]. Part of this thesis examines the changes to the local environment of tellurium with a change in the modifier content. The results will then be used to try to explain the effect of tellurium environment on its high nonlinearity.1.3.2 Borogermanate glasses
Like tellurite glasses, borogermanate glasses also possess desired critical properties (such as density and refractive index) suitable for uses in waveguide systems [17]. These properties depend on the structure of the glass, mainly from the constituent borate and germanate networks.
In pure borate glass, the structure is made up of [BO3] units [18]. The addition of
alkali oxide will transform [BO3] to [BO4]– until a saturation point at ~30 mol%
[19-20].Beyond this point, further addition of alkali oxide creates [BO3]– with non-bridging
oxygen NBO. From the point of view of the average boron-oxygen coordination number nBO,
this will, therefore, increase the nBO to a maximum value at ~30 mol% and later decrease nBO
[3, 21]. In accordance with the behaviour of nBO, anomalies in the physical properties of the
glasses are observed [22-23]. In alkali borate glasses, many borate superstructural units are formed and destroyed, which are used to successfully describe the borate anomaly [3].
In alkali germanate glasses, as a function of alkali content, a germanate anomaly in the physical properties is also observed [23-24]. This anomaly is caused by the conversion of [GeO4] units to charged higher coordinated [GeO5]– or [GeO6]2– units [25]. Similarly with the
borate anomaly, further addition of alkali content converts the higher coordinated units and forms [GeO4]– with an NBO and the glass structure will experience an overall decrease in the
average Ge-O coordination number [26-27].
The structure of ternary borogermanate glasses is complicated because boron and germanium can have more than one stable coordination. Therefore, this could cause unexpected changes in the structural/superstructural species formed in the glass. This thesis examines the borate and/or germanate anomaly in ternary lithium and potassium borogermanate glasses and compares the results with related models.
1.4
References
1. Zhong, J., Wu, X., Liu, M. L., Bray, P. J. Journal of Non-Crystalline Solids 1988, 107, 81-87.
8
4. Le Roux, S., Petkov, V. Interactive Structure Analysis of Amorphous and CrystallineSystems (ISAACS) Program. http://isaacs.sourceforge.net/index.html. 5. Le Roux, S., Petkov, V. Journal of Applied Crystallography 2010, 43, 181-185. 6. Zachariasen, W. H. Journal of the American Chemical Society 1932, 54, 3841-3851. 7. Tool, A. Q. Journal of the American Ceramic Society 1946, 29, 240-253.
8. Kitamura, R., Pilon, L., Jonasz, M. Applied Optics 2007, 46, 8118-8133.
9. Modest, M. F., Radiative Heat Transfer (Third Edition); Academic Press: Boston, 2013, p 904.
10. Nat Photon 2012, 6, 407-407.
11. Jha, A., Richards, B., Jose, G., Teddy-Fernandez, T., Joshi, P., Jiang, X., Lousteau, J. Progress in Materials Science 2012, 57, 1426-1491.
12. Suehara, S., Thomas, P., Mirgorodsky, A., Merle-Méjean, T., Champarnaud-Mesjard, J., Aizawa, T., Hishita, S., Todoroki, S., Konishi, T., Inoue, S. Physical Review B 2004, 70, 205121.
13. Lines, M. Physical Review B 1991, 43, 11978. 14. Lines, M. Physical Review B 1990, 41, 3383.
15. Blanchandin, S., Thomas, P., Marchet, P., Champarnaud-Mesjard, J., Frit, B. Journal of Alloys and Compounds 2002, 347, 206-212.
16. Porter, Y., Ok, K. M., Bhuvanesh, N., Halasyamani, P. S. Chemistry of Materials 2001, 13, 1910-1915.
17. Sigaev, V. N., Lotarev, S. V., Orlova, E. V., Stefanovich, S. Y., Pernice, P., Aronne, A., Fanelli, E., Gregora, I. Journal of Non-Crystalline Solids 2007, 353, 1956-1960. 18. Soper, A. K. Journal of Physics: Condensed Matter 2011, 23, 365402.
19. Prabakar, S., Rao, K., Rao, C. In 11B NMR Spectra and Structure of Boric Oxide and
Alkali Borate Glasses, Proceedings of the Royal Society of London A: Mathematical, Physical and Engineering Sciences, The Royal Society: 1990; pp 1-15.
20. Zhong, J., Bray, P. J. Journal of Non-Crystalline Solids 1989, 111, 67-76.
21. Kroeker, S., Aguiar, P. M., Cerquiera, A., Okoro, J., Clarida, W., Doerr, J., Olesiuk, M., Ongie, G., Affatigato, M., Feller, S. A. Physics and Chemistry of Glasses-European Journal of Glass Science and Technology Part B 2006, 47, 393-396.
22. Kapoor, S., Bola George, H., Betzen, A., Affatigato, M., Feller, S. Journal of Non-Crystalline Solids 2000, 270, 215-222.
23. Feller, S., Lower, N., Affatigato, M. Physics and Chemistry of Glasses 2001, 42, 240-246.
24. Yiannopoulos, Y. D., Varsamis, C. P. E., Kamitsos, E. I. Journal of Non-Crystalline Solids 2001, 293-295, 244-249.
25. Hannon, A. C., Di Martino, D., Santos, L. F., Almeida, R. M. Journal of Non-Crystalline Solids 2007, 353, 1688-1694.
26. Ueno, M., Misawa, M., Suzuki, K. Physica B+ C 1983, 120, 347-351.
9
Chapter 2 – Diffraction
2.1
Introduction
This chapter discusses the theory of diffraction which is the main method used in this structural study of glasses. Both neutron and X-ray diffraction are discussed, including the theory and practice of null neutron diffraction and isostoichiometric neutron diffraction. In addition, the theory and practice of the complementary method of neutron and X-ray diffraction are discussed. Some of the practical problems regarding neutron resonance and absorption are described. The chapter is then concluded by discussing the quantification of the structural information obtained from the diffraction experiments.
2.2
Diffraction theory: Neutron and X-ray
Diffraction is a powerful method for probing atomic or molecular structure in materials. Neutron diffraction has the advantage of the neutral charge of the neutron which allows it to penetrate deeper into an atom and interact with the nucleus, compared to X-rays which interact with the electron cloud of the atom. In elastic scattering, neutrons / X-rays are scattered by the sample at an angle of 2θ and the momentum transfer vector Q is obtained from the initial and final wave vectors, k, of the neutron / X-ray as shown in Fig. 2.1. In the figure (3D diagram for the collision), and 2 are the angles between the scattered beam to the y-axis (y-plane, blue) and z-axis (z-plane, orange), respectively. The solid angle in Fig. 2.1 is given by
Ω sin2θ 2θ φ
d d d (2.1)
Total cross section σ over the solid angle Ω is the differential cross section I(Q) and is defined as
-( ) ( ) ( ) ( )
Ω Ω
s
dσ dσ
I Q Q dω I Q i Q
d d dω (2.2)
Where ω is the angular momentum of the energy transferred (E = ħω), IS(Q) is the
self-scattering, and i(Q) is the distinct scattering and IS(Q) and i(Q) are represented as
2
( )
( )(1
( ,θ, ,..))
n s
i i l
i
I Q
c f Q
P Q
T
(2.3)
( )
( ) ( )( ( ) 1)
n n
i j i j ij i j
10
Figure 2.1: Schematic of elastic neutron / X-ray diffraction with neutron / X-ray of initial parameters (Ei, ki) scattered off of the sample with 2 angle from the initial path with final parameters of Ef and kf.
Momentum transfer vector Q is obtained from the wave vectors k as shown in the figure on the right.
Scattered neutron wave / X-ray into a solid angle of (from y-axis) and 2 (from z-axis)
Where Pl is the Placzek [1] corrections as a function of Q, , T, and etc, and fi(Q) is either the
atomic form factor (for X-ray) or the coherent neutron scattering length (for neutron) for the element i as in
4
2 1
; ( ) exp( )
; ( )
i j j
j
i i
X ray f Q a b Q c
Neutron f Q b
(2.5)
Where a, b, and c are in the X-ray case the parameters from the International Tables for Crystallography (1992), Vol. C [2] whilst b in the neutron case is the coherent neutron scattering length [3]. Eqn 2.3 is calculated and Eqn. 2.4 is obtained experimentally from the GEM diffractometer [4]. The structure factor term Sij(Q) as Sij(Q)-1 as in (Eqn. 2.4) is defined
as
2 0
sin( )
( ) 1 4 ( ( ) 1)
ij O ij
rQ
S Q πρ r g r dr
rQ
(2.6)which contains the real-space function gij(r) and can be obtained by taking the Fourier
transform of (Eqn. 2.6). The term gij(r) – 1 in Eqn. 2.6 is given in (Eqn. 2.7) and used to
determine the coordination number of atom i by j as in (Eqn. 2.8)
2 2
0
1 sin( )
( ) 1 ( ( ) 1)
2
ij ij
O
rQ
g r Q S Q dQ
π ρ rQ
(2.7)Sample
E
i,
k
i2
E
f,
k
f2
–
k
fk
iQ
=
k
i–
k
f11
2
1
2
1 2 1 2
( , ) 4 ( ) ( , )
r
j
ij j O ij ji
i r
c
n r r πc ρ r g r dr n r r
c
(2.8)This equation later reduces to Eqn 2.9 for neutron diffraction.
'
(2 )
N ij ij ij
ij i i j r A n
δ c b b
(2.9)
where AN
ij is the area in TN(r) arising from the i-j pair. The more common expression, the
total correlation function T(r) (Eqn. 2.10), is used in this chapter. It is a parameter containing all atom pair distribution functions, and is obtained by taking a Fourier transform of Eqn. 2.6
0
0 2
( ) ( ) ( ) ( ) sin( )
T r T r Q i Q M Q rQ dQ
π
(2.10)Where T0(r) is the average density contribution to the calculated correlation function
0
0
( ) 4
i ii
T r
πrρ
c b
(2.11)Where o is the density (units per cubic Å).
The neutron diffraction data were obtained using the GEneral Materials Diffractometer, GEM [5] at ISIS Oxford. GEM has the capability of taking high momentum transfer values, which lead to high real-space resolution (60 Å-1) and, therefore, accurate
coordination numbers. It has 8 detector banks covering a wide range of 2θ from 1.2o to
[image:34.595.175.503.474.714.2]171.4o as shown in Fig. 2.2.