Investigation of the effect of rake angle on draft requirement for
ripping in sandy clay
John Ndisya
1*, Ayub Njoroge Gitau
2, Duncan Onyango Mbuge
3,
Angela Wambui Hiuhu
4(1, 2, 3, 4.Department of Environmental & Biosystems Engineering, University of Nairobi, Kenya)
Abstract: In this study, the effect of rake angle of a ripper plough on the draft requirement in a sandy-clay soil was investigated. The study was based on field experiments, laboratory tests and numerical simulation. Field experiments were conducted at the University of Nairobi field station in Upper Kabete, Kenya located at 1o15’S and 36o44’E at an altitude of about 1940 m above sea level. The soil at the location is a humic Nitisol belonging to the class of sandy-clay.
The numerical model was developed using the principles of the discrete element method embedded in a commercial code. EDEM Academic™ software was applied to model the draft requirement to ripping using ripper tines of rake angles; 30o, 45o,
60o and 75o. The model was calibrated using the results of soil physical tests that included of moisture content, bulk density, sieve analysis, shear strength, cone index and angle of repose. The integrity of the model was validated statistically using empirical data from field tests. The statistical methods utilized included of measures of central tendency, the One Sample Kolmogorov-Smirnov test, analysis of variance, the student t-test and multi-linear regression. The validated model was applied to predict the effect of the rake angle on the draft requirement; the forces arising due to particle and boundary contact during simulation were calculated using an inbuilt contact constitutive relation and displayed using the model’s inbuilt query feature.
Statistical analysis indicated that the rake angle significantly influenced the value of the draft requirement in the sandy-clay soil at the 95% level of confidence. The draft requirement to ripping was found to decrease from the rake angle of 30o to a minimum at 45o. The draft requirement then increased through the rake angle of 60o to a maximum at 75o. The rake angle of
45o was found to give the minimum amount of the draft requirement while the rake angle of 75o was found to give the maximum amount of the draft requirement.
Keywords: ripper, rake angle, draft requirement, discrete element method, model, Kenya
Citation: Ndisya, J., A. N. Gitau, D. O. Mbuge, and A. W. Hiuhu. 2016. Investigation of the effect of rake angle on draft requirement for ripping in sandy clay. Agricultural Engineering International: CIGR Journal, 18(4):52-69.
1 Introduction
11.1 Preamble
Compaction of agricultural soils is a great problem
facing many farmers whose farms lie in cohesive soils
worldwide. Research has shown that crop productivity in
any agricultural system is adversely affected by soil
compaction (Nawaz et al. 2012; Wiebe 2003). Soil
compaction is caused by various factors including
Received date: 2016-06-20 Accepted date: 2016-10-09
*Corresponding author: John Ndisya, Department of Environmental & Biosystems Engineering, University of Nairobi, Kenya Email: [email protected], Cell Phone: +254 724 049 966
machinery wheel traffic, prolonged use of the
mouldboard plough, eluviation of fine soil particles from
the soil surface to a fine textured soil layer in the subsoil
and the trampling by livestock during grazing prior to
cultivation.
The commonly used technique to break-up a
compacted soil is deep tilling using a subsoiler or chisel
plough. However, the application of these techniques in a
dry cohesive soil leads to the formation of clods creating
an uneven seedbed unfavorable to planting and seed
germination (Gitau and Gumbe 2004). On the other hand,
such interventions in a wet soil may be counterproductive
optimal tillage depth with soil cutting equipment can
result into soil compaction; this causes the un-intentional
uplift of the clayey textured subsoil which typically
happens when chisel shanks are set too deep. On the other
hand, setting the ripper tines too shallow does not achieve
the desired goal of breaking up the compacted soil layer.
The traditional approach to preparing a good seedbed tilth
by harrowing is not only expensive but still leads to soil
compaction by tractor wheels. Furthermore, harrowing is
not an option in conservation agriculture systems which
lay a lot of importance on minimum soil disturbance.
According to Linde (2007), climate change,
escalation of agricultural input prices and the reducing
size of landholdings in the recent years has forced
researchers to develop conservation agriculture to
mitigate the negative environmental effects of
conventional agriculture particularly soil erosion and the
emission of carbon dioxide held in the soil to the
environment. In spite of the major strides being taken
towards conservation agriculture, soil compaction is still
a dominant problem and thus breaking-up the compacted
soil is still a major contributor to the input costs (Linde
2007). Moreover, conventional agriculture is still
practiced in many parts of the world; ripping is still one
of the operations performed to alleviate soil compaction
and loosen the soil before planting.
There is a genuine need to make soil tillage more
energy efficient in order to sustain significant profit
margins. Soil tillage now presents a challenge to farmers
and equipment manufacturers more than ever; farmers are
being forced to work within constrained budgets while
machine manufacturers are working towards optimizing
the energy efficiency and the capital cost of their
equipment to remain competitive in the market.
An energy efficient tillage tool is that which
accomplishes a particular tillage operation with reduced
draft requirement to overcome soil resistance; draft
requirement is thus a reflection of the amount of soil
resistance to a tillage tool. The prediction of draft
requirement is an important undertaking in the design of
tillage tools, particularly the selection of the optimal rake
angle; it is however a “complex process due to the spatial
variability of soil properties, the nonlinear and dynamic
behaviour of soil, and the interaction between particles
contact phenomenon such as slippage, particles
re-arrangement due to stress and the flow that occurs at
the interface zone between the soil and the tillage tool”
(Asaf et al. 2007; Shmulevich 2010).
1.2 Soil compaction in agriculture
Soil compaction is a form of physical degradation
depicted by an increase in the soil’s density and a
corresponding decrease in the pore space as a result of
applied loads. For engineering purposes such as the
construction of a road, soil compaction increases the
roadbed resistance to deformation and is thus desirable;
however, soil compaction is undesirable in a farm setting
as it reduces the infiltration capacity leading to increased
surface runoff and the erosion of agricultural soils (Lull
1959; Payne 2008).
According to Payne (2008), soil compaction affects
the physical, chemical and biological properties of the
soil as well as hampering root growth. The initial effect
on root growth is reduced nutrient uptake which in due
course affects the entire plant (Lichtfouse 2011). Indeed,
research by Penn College of Agricultural Sciences (2015)
in tilled soils indicated yield losses in the first year due to
severe compaction of about 15% due to residual effects
of surface compaction. In the absence of recompaction,
yield losses decreased to approximately 3% ten years
after the compaction event.
Soil compaction is a problem in both conventional
and conservation agriculture systems (Gitau and Gumbe
2004). McGarry (as cited in Benites et al. 2005) considers
soil compaction to be the worst form of land degradation
resulting from conventional agriculture practices caused
by agricultural tires and implements working in moist to
wet conditions at which the soil is susceptible to
deformation. Conservation agriculture has been reported
to generally improve the soil physical condition by
al. (2005) and Gitau and Gumbe (2004); however, Blanco
(2008) argues that soil compaction may actually increase
with the conversion of conventional systems to
conservation systems due to a lack of transient soil
loosening by tillage operations particularly in no-till
systems with poorly drained clay soils.
1.3 Ripping and ripper tines
A ripper is a chisel-shaped agricultural implement
that can be animal or tractor powered. The ripper breaks
up and opens the soil up to about 15 to 50 cm deep in
both conventional and conservation agriculture systems to
alleviate soil compaction. Figure 1 shows a gang of 3
rippers attached to a tool carriage.
Figure 1 A gang of rippers held by tool carriage
(Schmeiser Farm Equipment 2014)
Recent research has seen the development of
advanced ripping mechanisms such as the vibratory
ripper which utilizes a chain-gear mechanism. Linde
(2007), reports that the use of a vibrating tillage tool is an
effective method of reducing the draft force. He utilized
the vibratory mechanism to test and model the effect of
the vibration on the draft force of a subsoiler. A different
mechanism includes the use of an impact ripper that
utilizes an hydraulic hammer to break even harder and
rocky formations (Smith et al. 2001). These advanced
ripping mechanisms, do however increase the overall
energy consumption (Linde 2007).
In practical farm operations, it is the norm to connect
several ripper tines on a common carriage in various gang
arrangements or with other tools such as scrapers, seeders,
discs among others. Kasisira (2004) discovered that deep
tilling once every number of years at the same depth
actually increased the problem of compaction as a result
of operating below the critical depth as demonstrated in
Figure 2. He proposed an arrangement in which the tools
are arranged in a tandem configuration as shown in
Figure 3.
Figure 2 Critical depth: Source (Armstrong, n.d.)
Figure 3 Tools in tandem configuration: Source (Kasisira
2004)
The problem presented by the tandem arrangement
is that, bigger and more powerful tractors might be
required to draw the tools through the soil resulting into
more energy consumption and a greater deal of soil
compaction as a result of the heavier tractor. On the
contrary, lighter tractors are being introduced by
CIMMYT in partnership with ACIAR, KENDAT and the
University of Nairobi to serve small-scale farmers in
various Counties of Kenya, these tractors, most of them
two-wheeled, are technically unable to draw rippers in a
1.4 Influence of soil, tool and operational parameters
on soil resistance
Tillage in an agricultural soil involves loading the
soil until cracking patterns develop. According to O’Callaghan et al. (as cited in Kasisira 2004), the soil
deforms both elastically and plastically when a force is
applied to the tillage tool; the stress in the soil increases
in the zone ahead of the surface of the soil-engaging
element reaching a critical stress value where the soil
fails. This has been confirmed by the Mohr-Coulomb
failure criterion which contends that a soil mass fails at
the point where the shear stress reaches the shear strength
of the soil (Raj 2008).
The Mohr-Coulomb criterion postulates that the soil
shear strength is a function of the soil cohesion and the
soil-to-soil friction. The soil cohesion is dependent on the
strength of the bonds between adjacent soil particles only
and represents the maximum value of the shear stress
when the normal stress is set to zero. However,
soil-to-soil friction results from the interlocking of rough
soil particles and is thus a function of the applied normal
stress (Marenya 2009).
The geometry of a tillage tool and the soil shear
strength parameters control the shape of the failure plane
that results. Kasisira (2004) reports that the average soil
resistance to a tillage tool is approximated by the force
needed to develop the initial failure plane. The failure of
an agricultural soil is influenced by various factors
including soil parameters, tool and operating parameters
that have a direct bearing on the soil resistance
experienced during passive tillage.
1.4.1 Effect of soil parameters on soil resistance
The soil physical properties contributing to soil
resistance include the moisture content, bulk density,
texture, temperature, color and porosity (Marenya 2009).
According to Gill (1968), soil physical properties
particularly the moisture content, bulk density and texture
affect the mechanical behavior and shear strength of a
soil.
According to Rose (2004), soil strength is generally
reduced as it absorbs water due to a concurrent decrease
in the cohesion and the friction angle. The moisture
content affects the ability of a particular soil in a
particular condition to resist or endure an applied force
and hence directly influences the amount of soil
resistance to tillage (Gill 1968; Gitau et al. 2006).
Various techniques exist for establishing the moisture
content in a soil, the simplest method being the
gravimetric method where the water content is expressed
as the ratio of the weight of water contained in a weight
of dry soil.
The soil bulk density has been shown to be almost
linearly related to the soil resistance measured by the
penetrometric technique (Dedousis and Bartzanas 2010).
Soil bulk density is known to be a function of moisture
content and the compactive effort, Chancellor (as cited in
Marenya 2009) observed that the changes in the amount
of moisture within different soil depths influenced the soil
bulk densities within such depths. Marenya (2009)
therefore recommends that studies geared towards the
quantification of soil resistance to tillage be conducted at
a constant bulk density throughout the test layer.
1.4.2 Effect of tool and operating parameters on soil
resistance
Godwin and O’Dogherty (2007) defined a narrow
tine as the one having a depth to width ratio of between
one and six; very narrow tines have a depth to width ratio
beyond six. Soil failure under the action of narrow tines is
three dimensional in nature depicting two modes of
failure at a certain critical tine depth (dc) as postulated by
Godwin and O’Dogherty (2007);
Crescent failure near the soil surface and above
the critical depth with soil moving forwards, sideways
and upwards
Lateral failure below the critical depth with the
soil moving forwards and sideways only
The slenderness of a tillage tine has been reported to
influence the location of the critical tine depth (dc) which
tine. According to Kasisira (2004), operating the tine
below the critical depth reduces soil pulverization, causes
soil compaction while increasing the soil resistance to the
tine. This was confirmed by McKyes et al. (as cited in
Zadeh 2006) who observed that the soil resistance and the
degree of soil pulverization increased with the relative
narrowness of the tillage tines.
Ghaly and Al-Suhaibani (2010) studied the effect of
the cutting depth and operating speed on the performance
of a medium sized ripper in a sandy soil. Their findings
revealed that increasing the cutting depth and/or the
operating speed increased the soil resistance to ripping.
Owen (as cited in Ghaly and Al-Suhaibani 2010)
investigated the force to depth relationship of a ripper tine
with three different wing types in a compacted clay loam
soil and found the vertical force on the tine to increase
linearly with the cutting depth; the horizontal force,
moment and total force increased quadratically with the
cutting depth.
In their research to establish the effect of the rake
angle of a ripper on the power requirements while
working in a clay loam soil, Tong and Moayad (2006)
found out that the soil resistance on a tool decreased with
increase of the rake angle from 15o to 45o where it
attained a minimum value and then increased to a
maximum value at a rake angle of 75o. To achieve less
soil resistance, high cutting efficiency and excellent soil
pulverization during ripping, Zadeh (2006), recommends
that the tool should have a rake angle of about 30o and
should be fairly narrow with a depth to width ratio of at
least two.
1.5 Modeling soil resistance to ripping
The global demand for energy has of-late risen to
considerably high levels due to accelerated
industrialization and population growth. The high
demand for energy is believed to be one of the causes of
the widespread conflicts and wars currently being waged
in various parts of the world. With industrial development,
more sophisticated machinery requiring higher amounts
of energy have been developed for various agricultural
functions.
Much of the energy required for agricultural
activities is consumed by tillage to provide sufficient
draft to overcome the soil resistance and power soil
pulverization processes. Newton’s third law of motion states that “to each action there is always an equal and opposite reaction”; the interpretation of this is that the
soil resistance to a tillage tool will be of an equivalent
magnitude to the measured or predicted draft on the tool
after subtracting any rolling resistance of the prime
mover.
Zadeh (2006) observed that the energy consumed in
a tillage operation is a function of the soil type and
condition, tool parameters and operating parameters.
Over the years, a number of researchers have developed
analytical, empirical and numerical models to predict the
draft required by various tillage tools; these models
combine the factors above into a mathematical equation
or a computer model to predict the draft.
1.5.1 Analytical models
A lot of research has been done on the prediction of
the forces acting on a simple tool and the soil failure
developed in the process (Kasisira 2004; Zadeh 2006;
Marenya 2009). Limit equilibrium analysis has been
analytically employed to describe soil failure under
tillage and force prediction models based on Terzaghi’s
(as cited in Kasisira 2004) passive earth pressure theory.
Two dimensional models have been developed for wide
tillage tines (depth to width ratio less than 0.5) while
three dimensional models have been developed for
narrow (depth to width ratio between 1 and 6) to very
narrow tines (depth to width ratio greater than 6).
Payne (1956) was the pioneer of three-dimensional
force prediction for inclined tillage tools. He made an
assumption of the failure zone for tines with a
width/depth ratio less than one by observing the upward
displacement of the soil ahead of the tillage tine (Zadeh
2006). This model was improved by Osman (1964) by
surface roughness to the force expression by employing
dimensional analysis.
A force prediction model was developed by
O’Callaghan and Farrelly (1964) as an extension to
Payne's (1956) work. It is reported by Marenya (2009)
that the influence of the side crescents for soil failure
above the critical depth and the forces resulting from
adhesion and soil interface friction were not taken into
account in developing the model, further, Zadeh (2006)
notes that the model underestimated the draft force when
a very hard soil was encountered; he attributed this
weakness to the nature of the assumptions made while
developing the model.
Hettiaratchi and Reece (1967) developed a three
dimensional model for soil failure based on the passive
earth pressure theory. They assumed that the failure
configuration involved forward and transverse failure
regimes (Grisso and Perumpral 1985). The total force
on the tools was reported to be the sum of the forces for
the forward and transverse failure. Even though this
model captures the soil properties, soil-metal frictional
properties and the tool geometry (Marenya 2009), Grisso
and Perumpral (1985) indicate that it tends to predict the
draft force above the expected range.
Godwin and Spoor (1977) studied the soil failure
mechanism under the action of narrow tines with various
degrees of slenderness. A circular shape was proposed for
the soil failure crescents on the soil surface and the sides
of the tines to establish the volume of soil displaced by
the tine (Zadeh 2006). The soil failure in front of the tool
was hypothesized to be a wedge and the equation
developed by Hettiaratchi and Reece (1967) for wide
tines was utilized to obtain the draft from the centroid of
the wedge.
Studies by McKyes and Ali (1977) on the cutting of
soil by narrow blades produced a three-dimensional force
model similar to that of Godwin and Spoor (1977). They
however developed an equation to establish the rapture
distance in terms of a failure angle and the soil and tool
parameters; this eliminated the need of having prior
knowledge on the rapture distance for establishing the
forces on the tine. The draft prediction equation
developed was the sum of the forces from the center
wedge and the side crescents. However, Grisso and
Perumpral (1985) report that the McKyes-Ali model
doesn’t predict the lift force on the tool accurately.
Perumpral et al. (1983) developed a soil-tool
equation based on limit equilibrium analysis. This model
was based on the Godwin and Spoor (1977) and McKyes
and Ali (1977) models but the side crescents adjoining
the center wedge were substituted with two sets of forces
acting on the faces of the center wedge (Grisso and
Perumpral 1985). The prediction equation was given as a
sum of the forces acting on the horizontal and vertical
directions of the center wedge. Swick and Perumpral
(1988) improved the work done by Perumpral et al.
(1983); they formulated a three dimensional soil cutting
model that took into account the tool dynamic effects.
Even though this model utilized some assumptions that
overestimated side crescent dimensions (Zadeh 2006), it
gave a sufficient prediction of the forces acting on a
narrow tine (Kasisira 2004).
A dynamic soil cutting model was developed by
Zeng and Yao (1992) taking into account the acceleration
and strain rate effects to predict the forces on both wide
and narrow tines. Apart from a prior knowledge of shear
strain at soil failure to establish the shear failure boundary,
this model was otherwise similar to that developed by
McKyes and Ali (1977).
1.5.2 Numerical models
Various numerical models have been developed to
predict the forces acting on tillage tools. These models
have been introduced into the field of tillage science due
to the recent advances in computing power (Zadeh 2006).
Most of the numerical models developed in tillage
research have been formulated using the Finite Element
Method (FEM), Smoothed Particle Hydrodynamics
(SPH), Computational Fluid Dynamics (CFD) and the
FEM can be used without a prior assumption of the
soil failure pattern presenting the possibility of modeling
tillage activities that use tools of various shapes (Kasisira
2004). Furthermore, FEM presents an advantage over the
analytical methods discussed above if a constitutive
relation for the soil is provided. However, Marenya (2009)
reports that the constitutive relation for agricultural soils
is not yet fully understood and thus FEM has limited
applicability in precision modeling and optimization of
tillage tools.
SPH is one of the continuum simulation approaches
which use a mesh free based algorithm unlike FEM.
Urbán et al. (2002) used the SPH method to assess its
applicability in soil-tool interaction simulation. They
reported that SPH requires less computational resources
and time to configure and run a simulation. SPH however
always overestimated tillage forces and thus more
research is required to provide accurate material models
for calibration.
Karmakar (2005) reported that the study of soil
mechanical behavior from a Viscoplastic fluid flow
perspective using CFD is useful to tillage dynamics. He
successfully modeled soil failure using a Bingham model
in CFD to depict soil plastic failure with respect to the
yield stress. However, Karmakar et al. (2009)
experimentally validated a CFD model for a narrow
tillage tool and discovered that it over predicted the draft
force. CFD predictions for higher operating speeds and
depths were found to be significantly different from the
experimental values.
According to Shmulevich et al. (2007), the
complexity of modeling the actual soil-tillage interaction
behavior becomes more profound when dynamic effects
are taken into account; a better understanding of soil
translocation during tillage is thus required to forecast the
redistribution among soil particles (Shmulevich, Asaf and
Rubinstein 2007). DEM provides an adept alternative for
modeling soils and their interaction with both rigid and
flexible bodies thus depicting the non-linearity in soil
behavior; with good computing resources, DEM provides
an easy way to set-up, calibrate and run simulations;
DEM is thus a promising way to model the actual soil
behavior particularly in tillage without the limitation of
the other numerical methods and may serve as a tool for
optimization of the design process (Asaf et al. 2007).
Over the past few years, several researchers have
reported the ability of DEM in simulating the
micro-mechanics of the dynamic behavior of particles
that form the material in various engineering and science
applications. Sitharam (2000) presented the theory of
DEM and some of its applications in engineering; he
reported that DEM simulated deformation mechanisms in
particulate media more reasonably than the continuum
methods, it was detailed enough to develop and validate
constitutive relations of particular materials using their
appropriate particle properties, sizes, shapes and
gradation.
Shmulevich et al. (2007) investigated the interaction
between soil and a wide cutting blade using DEM and
obtained a good correlation between the model results
and experimental results. Linde (2007) developed a
DEM model to optimize a vibratory subsoiler and
quantify the draft reduction caused by the vibrating
mechanism; he concluded that DEM was able to model
the vibratory subsoiler mechanism for its design and
optimization. Obermayr et al. (2011) developed a discrete
element model that successfully reproduced the variations
of the draft force for various cutting widths and depths for
the calculation of soil-cutting forces in cohesionless
granular material. (Okayasu et al. 2012) established that
the soil cutting behavior by a plow was controlled by soil
conditions, tillage depth and tillage speed. It is thus
evident that DEM is capable of reliably modeling the
soil-tool interaction during tillage; this underscores its
applicability in modeling the draft requirement during
ripping.
2 Materials and methods
The study was carried out in the University of
Nairobi Field Station at Upper Kabete campus which lies
at 1o15’S and 36o44’E at an altitude of about 1940 m
above sea level. The soils and the climate of the area are
reported by Karuku et al. (2012) to be representative of
the Central Kenya Highlands. Gachene et al. (2000) also
mentions that the soil at the site is a humic Nitisol with no
surface crusting. The study plot was bare (i.e. without any
crop or weed residue) after a cassava crop had been
harvested. The plot is oriented along contour lines within
a gentle main-slope and a negligible cross-slope.
2.2 Data collection approach
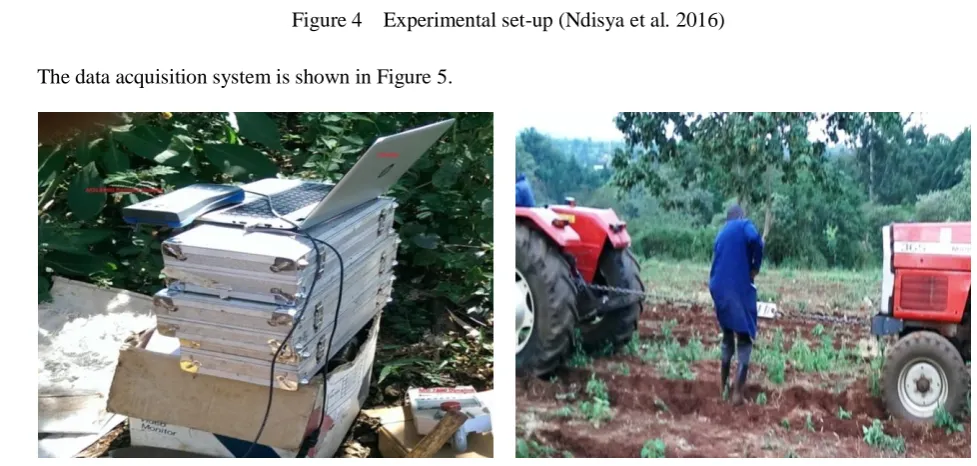
2.2.1 Experimental set-up
Field experiments were conducted to collect draft
force datasets for validating the numerical model. The
datasets were recorded using a data acquisition system
consisting of an MSI7300 digital dynamometer connected
wirelessly to a MSI8000 remote display to stream the
draft force data instantaneously into a laptop computer
through the serial port.
The design of the dynamometer could not allow
direct connection to the three point hitch of the towed tool
carriage; it was attached as shown in Figure 4. The tillage
tines under investigation were attached to the towed tool
carriage which was attached to the three point hitch of the
towed tractor (i.e. with gear lever in neutral position); the
dynamometer was attached between the rear towed
tractor and the front towing tractor via carbon steel
shackles. The tractors used in the experiments were
Massey Ferguson tractors of 60 hp and 75 hp respectively.
The data acquisition system is shown in Figure 5.
Figure 6 shows close-up pictures of the digital
dynamometer and the remote display;
Figure 4 Experimental set-up (Ndisya et al. 2016)
At the start of the experiments, a dry-run of the
system was executed with the ripper tines disengaged to
establish the rolling resistance values of the rear towed
tractor and the towed tool carriage as shown in Figure 7.
The value of the rolling resistance was subtracted from
the draft force data during data analysis to establish the
draft requirement as a result of the individual tillage tines.
Subsequent experimental runs were conducted with the
ripper tines engaged to collect data; the dynamometer
then streamed draft force data wirelessly to the stationary
data acquisition system.
Depth control was achieved by making settings to
the tractor draft control hydraulic system and adjusting
the anchor points of the ripper tines to the tool carriage
iteratively until the target average ripping depth realized.
Care was taken to maintain the inflation pressure of the
tires of the rear tractor and the tool carriage at the same
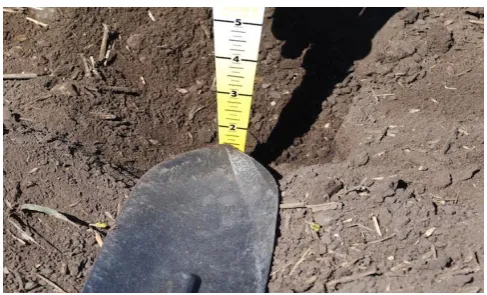
level. The ripping depth was confirmed by making
measuring the furrow depth with a tape measure and a flat
blade before a trial run at the staging area as
demonstrated in Figure 8. The vertical distance between
the top of the undisturbed soil surface to the point of
deepest tool penetration was measured to be the ripping
depth; this technique has been demonstrated by Rashidi
et al. (2013). This study targeted two speed levels (i.e.
low and high); the low speed level used was 3 km/h while
the high speed level used was 5 km/h. The staging area
was used to bring the ripping depth and the operational
speed to the required values before a treatment run.
Figure 8 Furrow depth measurement (Canola Council of
Canada 2016)
MSI 7300 dynalink 2 MSI 8000 Remote display
Figure 6 Digital dynamometer components
2.2.2 Experimental design
The study adopted the Factorial Completely
Randomized Block design to investigate the effects of the
rake angle on the draft requirement of 5 cm wide ripper
tines of rake angles of 30o, 45o, 60o and 75o available at
the University of Nairobi. The tines are shown in Figure 9.
The study was conducted at average ripping depths
utilized of 15, 25 and 40 cm; this was in-accordance to
the results of a soil profile study that revealed that distinct
soil layers at 0 – 15 cm (i.e. soil mixed with humus), 15–
30 cm (i.e. top soil) and 30 – 50 cm (i.e. sub-soil). The
operating speed for the study was set at 3 and 5 km/h;
these speed levels represented the low speed and high
speed for ripping within a Kenyan farm. The settings for
ripping depth, rake angle and operating speed were
combined and replicated four times to yield a total of 96
treatments for the study.
Field experiments were conducted on an
experimental plot measuring 60 m by 20 m; this plot was
sub-divided into four blocks of equal size each measuring
25 m by 10 m; an allowance area of 5 m in length was left
at the start and end of each sub-plot for staging, practice
and turning. The treatments were randomly assigned to
each block.
The digital dynamometer recorded between 15 to 20
datasets during a single experimental run. The number of
data points depended on the stability of the tool carriage
(i.e. freedom from vibrations) during the run; as such,
some of the data points recorded were way below or
above the mean of the recorded data stream. To eliminate
the outliers in the measured draft datasets, the median of
the data-streams was determined. Specific draft data was
obtained by dividing the measured draft dataset by 5 cm
(i.e. the width of the ripper tines).
2.2.3 Data-sets collected for soil characterization
Soil samples were taken from the field to determine
the physical properties of the soil. Soil samples were
collected systematically to ensure accurate representation
of the conditions across the study plot. Sample pits were
dug at 12 spots across the plot; sampling was then done at
three levels across the pit profiles (i.e. 0–15 cm, 15–30
cm, 30–50 cm). This made total of 36 sampling spots.
The sampled soils were analyzed for: moisture
content, bulk density, particle size distribution, particle
shape distribution, shear strength parameters (i.e.
cohesion and angle of internal friction), cone index and
angle of repose; the results are provided in Table 1. These
soil properties were essential to calibrating the numerical
model. Field experiments were completed within three
days to avoid considerable variations in the soil physical
properties.
75o tine 60o tine 45o tine 30o tine
Table 1 Soil physical properties
Parameter Average Value
Wet Bulk Density, kg/m3 1818
Dry Density, kg/m3 1527.7
Angle of Repose, Experimental, o 34 Angle of Repose, Simulation, o 33.6
Average Moisture Content, % 19
Cone Index, kPa 220.56
Insitu Cohesion, kPa 3
Insitu Angle of Internal friction, o 10
Soil Classification Sandy Clay
(54% Sand, 35% Clay, 11% Silt)
2.2.4 Computer modelling
The EDEM Academic™ software version 2.7.0 was
applied to model and solve for the draft forces to ripping
using various tool geometries. Modelling was conducted
using a Toshiba Qosmio® Laptop with an i7 processor
(2.64 Ghz Quad core), RAM of 8GB, storage space of
1TB and a 64-bit Windows 7 Operating System. The
modelling process proceeded as follows;
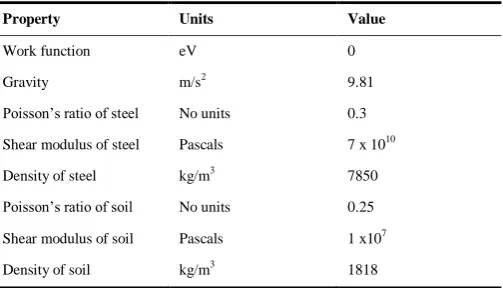
a) Global settings
The units of measurement were set to SI to be used
throughout the process; the global settings made in the
main window of EDEM Academic™ are given in Table
2.
Table 2 Global settings in EDEM Academic™
Property Units Value
Work function eV 0
Gravity m/s2 9.81
Poisson’s ratio of steel No units 0.3
Shear modulus of steel Pascals 7 x 10¹⁰
Density of steel kg/m3 7850
Poisson’s ratio of soil No units 0.25
Shear modulus of soil Pascals 1 x10⁷
Density of soil kg/m3 1818
b) Particle formulation
The soil samples retained in each sieve of the sieve
analysis procedure in the laboratory were used to
characterize the particle shapes. Shape characterization
was conducted under a lit microscope with a high
resolution digital camera; the soil particles were then
re-modelled in EDEM Academic™ as a clump of spheres
as described in Figure 10; the process involved
combining three spheres of a similar diameter to form the
target soil particle shape of a given diameter.
The particles were set to exhibit the log-normal size
distribution with a mean of 0.7769 and a standard
deviation of 1.82261. This was in-accordance with the
results of laboratory sieve analysis test. EDEM
Academic™ automatically calculated the properties of
the base particles; these are provided in Table 3.
Table 3 Re-calculated base particle properties
Property Value
Base particle diameter 8 mm
Contact diameter 8 mm
Calculated particle mass 0.000515066 kg Calculated particle volume 2.83314e-07 m3
Particle material Soil
Soil particle shape Remodelled particle shape in EDEM Academic™
c) Creation of geometry sections
Three types of geometries namely a virtual box,
ripper tine models and a particle factory as shown in
Figure 11 and Figure 12 were created. The virtual box of
dimensions 400 mm length, 200 mm width by 500 mm
height and a Particle Factory of 400 mm by 200 mm were
created using EDEM Academic™ geometry modelling
capabilities. Additionally, the ripper tines were modelled
in AutoCAD Mechanical 2015 and then imported into
EDEM Academic™ through the CAD import tool,
repositioned and aligned along the longitudinal axis of the
virtual box.
d) Particle factory and simulator settings
Particle factories are used to define where, when and
how particles appear in a simulation. A dynamic factory
type was specified in EDEM to enable the creation of
particles as the simulation continued. The factory was
also set to generate approximately 4,000 particles per
second until the virtual box was filled. The particles were
set to enter the virtual box at a velocity of 20 m/s and to
be positioned and oriented randomly. The time-step for
the model was set at 20% of the Raleigh time step and to
run for 15 s with a target save interval of 0.1 s; this
yielded a total of 150 data points for each treatment.
e) Model calibration and full scale simulation runs
Calibrating the model involved setting the
macro-mechanical parameters to values similar to the
physical properties of the soil and the ripper tines; these
parameters were then adjusted iteratively until the model
Empty virtual box Particles dropping from the Particle Factory
Figure 11 Virtual box and particle factory (Ndisya et al. 2016)
30o Ripper Tine 45o Ripper Tine 60o Ripper Tine 75o Ripper Tine
produced results that matched the results of the angle of
repose test.
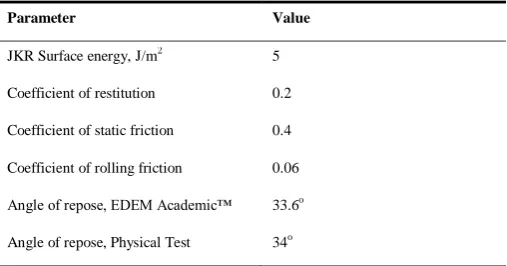
Other model parameters adjusted included; surface
energy value for the Hertz-Mindlin with JKR contact
model (5, 10, 15, and 20 J/m2), coefficient of static
friction (0.2, 0.4, and 0.6), and coefficient of rolling
friction (0.06 and 0.12) and the coefficient of restitution
(0.1, 0.2, 0.3, and 0.4). A total of 94 calibration
simulations in batch mode representing 94 different and
exclusive combinations of the above parameters were
executed; the angles of repose were measured in EDEM
Analyst® using the protractor tool as demonstrated in
Figure 13; the parameter combination that gave an angle
of repose similar to the physical test is given in Table 4.
Figure 13 Slumped soil mass showing the angle of
repose
Table 4 Soil en-masse calibration parameter settings
Parameter Value
JKR Surface energy, J/m2 5
Coefficient of restitution 0.2
Coefficient of static friction 0.4
Coefficient of rolling friction 0.06
Angle of repose, EDEM Academic™ 33.6o Angle of repose, Physical Test 34o
The calibration parameters obtained were then used
to conduct the full scale simulation runs. The results of
the simulation runs were extracted from the EDEM
Analyst® by creating queries that displayed the draft
forces on the ripper tine perpendicular to the direction of
travel. The extracted datasets were exported from the
EDEM Analyst® in a comma-separated (.csv) format for
cleaning and analysis.
The cleaned predicted and measured draft force
datasets were subjected to statistical analysis so as to
draw inferences from the data. The following statistical
operations were conducted in Statistical Package for
Social Scientists (SPSS); the outliers in the draft data
were eliminated using measures of central tendency (i.e.
mean and median), the One Sample
Kolmogorov-Smirnov Test was executed to confirm that
the probability distribution of the draft datasets is normal
(i.e. subsequent statistical tests such as ANOVA, t-test
and regression require the input data to be normally
distributed), Analysis of Variance (ANOVA) was applied
to compare the means of the different treatments to the
means of the predicted draft to check their effect on the
draft force. This was also confirmed with the student
t-test and Multi-linear regression was conducted to
evaluate the correlation between the measured draft and
the predicted draft.
3 Results and discussions
3.1 Statistical analysis of the draft data
3.1.1 Probability distribution test
The measured and predicted draft datasets were
tested for normality by employing the One Sample
Kolmogorov-Smirnov Test in SPSS; the null hypothesis
that the datasets were normally distributed was tested.
As shown in Table 5, the p-values (i.e. test statistics) for
the datasets were found to be greater than 0.05 at the 95%
level of confidence; the null hypothesis that the data sets
3.1.2 Comparison of means
a) Analysis of variance (ANOVA)
ANOVA for both datasets was conducted in SPSS
with the draft force as the dependent variable and the rake
angle as the factor to compare the means of the different
datasets obtained using different ripper rake angles; the
null hypothesis that the means of the were similar was
tested. The p-values for the treatments for both the
predicted and measured datasets were found to be less
than 0.05 (i.e. 0.019 and 0.027 respectively) at the 95%
level of confidence, the null hypothesis was thus rejected
in favour of the alternative, the changes in the rake angle
thus significantly influenced the draft force.
b) Student t-test
The paired samples t-test was executed in SPSS to
compare the means of the predicted and measured draft
datasets. The null hypothesis that the means of the two
datasets were similar was tested. As shown in Table 6, the
p-value is greater than 0.05 (i.e. 0.541 > 0.05), the null
hypothesis that the means are similar is thus accepted.
The student t-test thus presents strong evidence to the
effect that the measured draft dataset was similar to the
predicted draft dataset; this indicates that the computer
model developed was an accurate representation of the
ripping process.
c) Multi-linear regression
Regression was also performed in SPSS to
investigate the degree of fit of the measured draft datasets
to the predicted draft dataset. As shown in Figure 14,
results indicated an extremely good fit with a coefficient
of determination (R2) of 0.986. The figure also shows the
95% confidence level line bounds; most of the data points
lie within the bounds further confirming the excellent fit
between the two datasets; this further confirms that the
computer model developed was of high fidelity. Figure 14 Line of fit between predicted and measured
draft (Ndisya et al. 2016)
Table 5 Probability distribution test
Source of data
Measured
Predicted
Block 1 Block 2 Block 3 Block 4
N 24 24 24 24 24
Normal parameters Mean 1.1192 1.1392 1.1904 1.1667 1.1667
Std. Deviation 0.81692 0.82774 0.83387 0.83622 0.83622
Most extreme diff.
Absolute 0.249 0.238 0.238 0.255 0.255
Positive 0.249 0.238 0.238 0.255 0.255
Negative -0.125 -0.118 -0.130 -0.124 -0.124
Kolmogorov-Smirnov Z 1.218 1.167 1.167 1.291 1.249
Asymp. Sig. (2-tailed) 0.103 0.131 0.131 0.071 0.098
Table 6 Student t - test for the draft data
Paired Differences
t df Sig. (2-tailed) Mean Std. Deviation Std. Error Mean
95% Confidence Interval of the Difference
Lower Upper
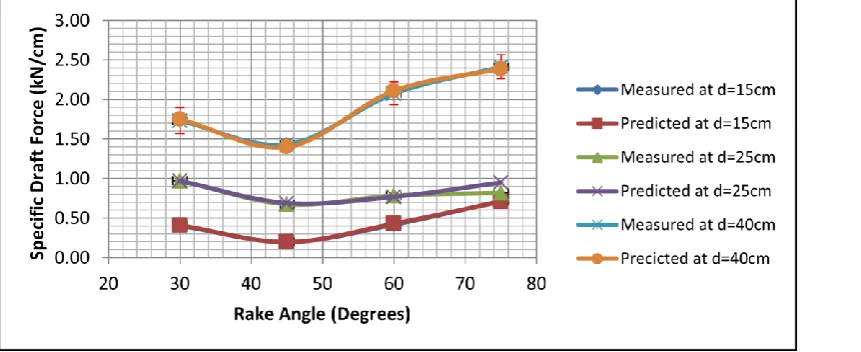
3.2 Effect of the rake angle on the draft requirement
to ripping
The draft force reduced from a rake angle of 30o to
attain a minimum at an angle of 45o then increased
exponentially through the rake angle of 60o to attain a
maximum at the rake angle of 75o as shown in Figure 15
and Figure 16.
Table 7 gives the equations of the best fit to the
predicted draft data.
Figure 15 Specific draft against rake angle at operating speed of 3 kph
Figure 16 Specific draft against rake angle at operating speed of 5 kph
Table 7 Equations of fit for the predicted draft data
Speed, km/h Operating depth, cm Equation of best fit R2
3 15 y = -2E-05x3 + 0.0037x2 - 0.2038x + 3.77 0.929
3 25 y = -1E-05x3 + 0.0025x2 - 0.1538x + 3.65 0.946
3 40 y = -7E-05x3 + 0.0123x2 - 0.6304x + 11.59 0.908
5 15 y = -0.0001x3 + 0.0188x2 - 0.9578x + 17.23 0.933
5 25 y = -2E-05x3 + 0.003x2 - 0.1679x + 3.77 0.951
The equations are cubic in nature exhibiting a local
minimum at the rake angle of 45o and a local maximum at
the rake angle of 75o; the results indicate that for
minimization of the draft requirement during ripping,
machinery operators should strive to operate at the
optimum rake angle to of 45o. This finding agrees with
the observations of Tong and Moayad (2006) and
Maswaure (1995) who recommended that for minimizing
the draft forces, the tool rake angles must be set to
between 30o and 60o.
4 Conclusions and recommendations
This study aimed at investigating the effect of the
rake angle of a ripper tine on the draft requirement of a
ripping operation in a sandy-clay soil using the numerical
modelling technique. The information gained in this study
has potential applications in tillage research, tool design
in the industry and tillage management by farm managers.
This study established that ripping operations should be
conducted at or near the rake angle of 45o to reduce the
draft requirement and consequently the energy
consumption leading to significant cost savings. The
applicability of computing techniques in modern
agriculture and machinery design has also been
demonstrated.
The soil-tool interaction during soil cutting with a
ripper was investigated; this was done is a humic Nitisol
(sandy clay soil). Further studies should be directed at
modelling the forces that arise during soil loosening with
other tools such as the mouldboard plough which is a
commonly used tillage tool in Kenyan farms. Further
studies are required to test the validity of the findings of
this study in other soil types, particularly the black cotton
soil; which presents a loosening challenge to a number of
Kenyan farmers.
Two speed levels (3 km/h and 5 km/h) were used in
this study; the draft was found to be marginally sensitive
to the changes in speed level, further studies are
recommended at finer speed level within the above range
to make good observations on their effect on the draft
force; however, most ripping operations are conducted
within the range of 3 km/h (0.8 m/s) and 5 km/h (1.4 m/s)
and as such, this study’s observations at such a range are
usable. Additional studies should be conducted with rake
angles outside the range of 30o to 75o since the rake angle
of 45o established to be the angle for the minimum draft
force and 75o established to be the angle for the
maximum draft force were only the respective minimum
and maximum within that particular range; there could be
other rake angles outside the range that give different
values of the minimum and maximum draft force.
Acknowledgements
The authors wish to thank the University of Nairobi
through the Department of Environmental and
Biosystems Engineering for sponsoring this research and
providing the necessary facilities for studies. DEM
Solutions Limited is acknowledged for facilitating access
to the EDEM Academic™ software and technical
support.
References
Asaf, Z., D. Rubinstein, and I. Shmulevich. 2007. Determination of Discrete Element Model Parameters Required for Soil Tillage.
Soil and Tillage Research, 92(1-2):227-242. doi:10.1016/j.still.2006.03.006.
Benites, J., M. Pisante, and F. Stagnari. 2005. Integrated Soil and Water Management for Orchard Development. In
International Seminar on the Role and Importance of Integrated Soil and Water Management for Orchard Development,154. Rome: FAO.
Blanco, Humberto, and R. Lal. 2008. Principles of Soil Conservation and Management. 1sted. London, New York: Springer.
Canola Council of Canada. 2016. Seed Depth Assessment. www.canolawatch.org/2016/06/15/seed-depth-assessment/. Dedousis, Athanasious, and T. Bartzanas. 2010. Soil Engineering.
Edited by Athanasios P. Dedousis and Thomas Bartzanas. 1st ed. Vol. 20. Soil Biology. Berlin, Heidelberg: Springer Berlin Heidelberg.
Gachene, C, N. Jarvis, H. Linner, and J. Mbuvi. 2000. “Soil Erosion Effects on Productivity of a Humic Nitisol.” In
Proccedings of the 15th Annual General Meeting Sportman’s Arms Hotel, Nanyuki, Kenya, 233. Department of soil science, University of Nairobi.
Tillage and Forward Speed on the Performance of a Medium Size Chisel Plow Operating in a Sandy Soil.” American Journal of Agricultural and Biological Sciences,
5(3):247-255.
Gill, William, B. Vanden, and E. Glen. 1967. Soil Dynamics in Tillage and Traction. Washington D.C: Agricultural Research Service, U.S. Dept. of Agriculture.
Gitau, A., and L. Gumbe. 2004. Alleviating Soil Hardpan Formation for Conservation Farming – Case of Semi-Arid Kenya. Euro-Asia Journal of Applied Sciences, 2(3). Gitau, A., L. Gumbe, and E. Biamah. 2006. Influence of Soil Water
on Stress-Strain Behaviour of a Compacting Soil in Semi-Arid Kenya. Soil & Tillage Research, 89(2):144-154
Godwin, R. J., and M. J. O’Dogherty. 2007. Integrated Soil Tillage Force Prediction Models. Journal of Terramechanics,
44(1):3–14.
Godwin, R. J., and G. Spoor. 1977. Soil Failure with Narrow Tines.
Journal of Agricultural Engineering, 22(4):213–228.
Hettiaratchi, D. R. P., and A. R. Reece. 1967. Symmetrical Three-Dimensional Soil Failure. Journal of Terramechanics,
4(3):45–67.
Karmakar, S. 2005. Numerical Modeling of Soil Flow and Pressure Distribution on a Simple Tillage Tool Using Computational Fluid Dynamics. (Doctoral Thesis, University of Sasketchewan), Pp.11 - 75.
Karmakar, S., S. R. Ashrafizadeh, and R. L. Kushwaha. 2009. Experimental Validation of Computational Fluid Dynamics Modeling for Narrow Tillage Tool Draft. Journal of Terramechanics, 46 (6):277–283.
Karuku, G., C. Gachene, N. Karanja, W. Cornelis, H. Verplancke, and G. Kironchi. 2012. Soil Hydraulic Properties of a Nitisol in Kabete Kenya. Tropical and Subtropical Agroecosystems,
15(3):595–609.
Kasisira, L. L. 2004. Force Modelling and Energy Optimization for Subsoilers in Tandem. (Doctoral Thesis, University of Pretoria), Pp.5 - 53.
Lichtfouse, E. 2011. Biodiversity, Biofuels, Agroforestry and Conservation Agriculture. Edited by Eric Lichtfouse. Vol. 5. Sustainable Agriculture Reviews. Dordrecht: Springer Netherlands.
Linde, J. 2007. Discrete Element Modeling of a Vibratory Subsoiler. Masters Thesis, University of Stellenbosch, Pp.5-29.
Losada, M., R. Rodriguez, and J. MacAdam. 2005.
Silvopastoralism and Sustainable Land Management. Lugo: CABI Publishing.
Lull, H. W. 1959. Soil Compaction on Forest and Range Lands. Washington D.C: Forest Service, U.S. Department of Agriculture.
Marenya, M. O. 2009. Performance Characteristics of a Deep
Tilling Rotavator Performance Characteristics of a Deep Tilling Rotavator. Doctoral Thesis, University of Pretoria, Pp.7-85.
Maswaure, J. 1995. Tillage Forces and Soil Loosening as Influenced by Tool Geometry. Masters Thesis, McGill University, Pp. 64.
McKyes, E., and O. S. Ali. 1977. The Cutting of Soil by Narrow Blades. Journal of Terramechanics, 14(2):43–58.
Nawaz, M. F., G. Bourrié, and F. Trolard. 2013. Soil Compaction Impact and Modelling. A Review. Agronomy for Sustainable Development, 33(2):291–309.
Ndisya, J., A. Gitau, D. Mbuge, and A. Hiuhu. 2016. The Effect of the Operational Parameters on the Draft Requirement of Ripping in a Sandy Clay Soil. Open Journal of Optimization,
5(1):1-13.
O’Callaghan, J., and K. Farrelly. 1964. Cleavage of Soil by Tined Implements. Journal of Agricultural Engineering Research,
9(3):259-270.
Obermayr, M., K. Dressler, C. Vrettos, and P. Eberhard. 2011. Prediction of Draft Forces in Cohesionless Soil with the Discrete Element Method. Journal of Terramechanics,
48(5):347-358.
Okayasu, T., K. Morishita, H. Terao, M. Mitsuoka, E. Inoue, and K. Fukami. 2012. Modeling and Prediction of Soil Cutting Behavior by a Plow Frictional Slider. In Power and Machinery. International Conference of Agricultural Engineering - CIGR-AgEng 2012: Agriculture and Engineering for a Healthier Life, 1-6. Valencia: CIGR-EurAgEng.
Osman, J. S. 1964. The Mechanics of Soil Cutting Blades. Journal of Agricultural Engineering Research, 9(4):313-328.
Payne, J. M. 2008. Identification of Subsoil Compaction Using Electrical Conductivity and Spectral Data Across Varying Soil Moisture Regimes in Utah. Masters Thesis, Utah State University. ProQuest.
Payne, P. 1956. The Relationship between the Mechanical Properties of Soil and the Performance of Simple Cultivation Implements. Journal of Agricultural Engineering Research,
1(1):23-50.
Penn College of Agricultural Sciences. 2015. The Agronomy Agronomy Guide 2015 - 2016.
http://extension.psu.edu/agronomy-guide/extension_publicat ion_file.
Perumpral, J. V., R. D. Grisso, and C. S. Desai. 1983. A Soil-Tool Model Based on Limit Equilibrium Analysis. Transactions of the ASAE, 26(4):991-995.
Raj, P. P. 2008. Soil Mechanics & Foundation Engineering. Chennai: Pearson Education India.
Based on Soil Moisture Content, Tillage Depth and Operation Speed. American-Eurasian Journal of Agricultural & Environmental Science, 13(8):1057-1062.
Rose, C. 2004. An Introduction to the Environmental Physics of Soil, Water and Watersheds. Cambridge: Cambridge University Press.
Schmeiser Farm Equipment. 2014. Vineyard Rippers. www.tgschmeiser.com/products/rippers/vr.html.
Shmulevich, I. 2010. State of the Art Modeling of Soil–tillage Interaction Using Discrete Element Method. Soil and Tillage Research, 111(1):41-53.
Shmulevich, I., Z. Asaf, and D. Rubinstein. 2007. Interaction between Soil and a Wide Cutting Blade Using the Discrete Element Method. Soil and Tillage Research, 97(1):37-50. Sitharam, T. G. 2000. Numerical Simulation of Particulate
Materials Using Discrete Element Modeling. Current Science,
78(7):
Smith, M., L. Collis, and P.G. Fookes. 2001. Aggregates: Sand, Gravel and Crushed Rock Aggregates for Construction Purposes. Edited by M Smith and L Collis. 3rd ed. Bath: The
Geological Society of London.
Swick, W.C., and J.V. Perumpral. 1988. A Model for Predicting Soil-Tool Interaction. Journal of Terramechanics,
25(1):43-56.
Tong, J., and B. Z. Moayad. 2006. Effects of Rake Angle of Chisel Plough on Soil Cutting Factors and Power Requirements: A Computer Simulation. Soil and Tillage Research,
88(1-2):55-64.
Urbán, M., K. Kotrocz, and G. Kerényi. 2002. Investigation of the Soil - Tool Interaction by SPH (Smooth Particle Hydrodynamics) Based Simulation. tehetseg.bme.hu.
Wiebe, K. 2003. Land Quality, Agricultural Productivity, and Food Security: Biophysical Processes and Economic Choices at Local, Regional and Global Levels. Massachusetts: Edward Elgar Publishing.
Zadeh, S. 2006. Modelling of Energy Requirements by a Narrow Tillage Tool. Doctoral Thesis, University of Sasketchewan, Pp.6-40.