R E S E A R C H A R T I C L E
Open Access
Appropriate statistical methods for
analysing partially nested randomised
controlled trials with continuous outcomes:
a simulation study
Jane Candlish
*, M. Dawn Teare, Munyaradzi Dimairo, Laura Flight, Laura Mandefield and Stephen J. Walters
Abstract
Background:In individually randomised trials we might expect interventions delivered in groups or by care providers to result in clustering of outcomes for participants treated in the same group or by the same care provider. In partially nested randomised controlled trials (pnRCTs) this clustering only occurs in one trial arm, commonly the intervention arm. It is important to measure and account for between-cluster variability in trial design and analysis. We compare analysis approaches for pnRCTs with continuous outcomes, investigating the impact on statistical inference of cluster sizes, coding of the non-clustered arm, intracluster correlation coefficient (ICCs), and differential variance between intervention and control arm, and provide recommendations for analysis.
Methods:We performed a simulation study assessing the performance of six analysis approaches for a two-arm pnRCT with a continuous outcome. These include: linear regression model; fully clustered mixed-effects model with singleton clusters in control arm; fully clustered mixed-effects model with one large cluster in control arm; fully clustered mixed-effects model with pseudo clusters in control arm; partially nested homoscedastic mixed effects model, and partially nested heteroscedastic mixed effects model. We varied the cluster size, number of clusters, ICC, and individual variance between the two trial arms.
Results:All models provided unbiased intervention effect estimates. In the partially nested mixed-effects models, methods for classifying the non-clustered control arm had negligible impact. Failure to account for even small ICCs resulted in inflated Type I error rates and over-coverage of confidence intervals. Fully clustered mixed effects models provided poor control of the Type I error rates and biased ICC estimates. The heteroscedastic partially nested mixed-effects model maintained relatively good control of Type I error rates, unbiased ICC estimation, and did not noticeably reduce power even with homoscedastic individual variances across arms.
Conclusions:In general, we recommend the use of a heteroscedastic partially nested mixed-effects model, which models the clustering in only one arm, for continuous outcomes similar to those generated under the scenarios of our simulations study. However, with few clusters (3–6), small cluster sizes (5–10), and small ICC (≤0.05) this model underestimates Type I error rates and there is no optimal model.
Keywords:Clustering, Randomised controlled trial, Partially nested, Partially clustered, Therapist effects, Individually randomised group treatment, Individually randomised cluster trial, Intervention studies
* Correspondence:[email protected]
School of Health and Related Research (ScHARR), University of Sheffield, 30 Regent Street, S1 4DA, Sheffield, UK
Background
Randomised controlled trials (RCTs) are often categorised into two types: individually randomised controlled trials (iRCTs) where participants are individually randomised to treatment arms to receive one of the investigative treat-ments; and cluster randomised controlled trials (cRCTs) where groups of participants (clusters) are randomised to treatment arms. We may expect outcomes for participants within the same cluster to be more similar than those from different clusters. The similarity can arise due to partici-pants in the same cluster receiving care from the same
health provider or interacting with one another [1]. The
im-plications of clustering in cRCTs are widely acknowledged
[1, 2]. Clustering results in a reduction in statistical
effi-ciency in cRCTs and if ignored standard errors andp-values
for intervention effects are typically underestimated. Clustering can also occur in iRCTs. For instance, clus-tering of participants outcomes due to receiving treat-ment as part of a group-based parenting intervention
[3], treatment in specialist clinics for the treatment of
venous leg ulcers [4], or participants under the care of a
surgeon for comparison for hemostasis in elective
benign thyroid surgery [5]. The care provider or group
dynamics may play a role in the causal pathway of the intervention effect. We might expect correlated out-comes between individuals either in the same group or receiving treatment from the same care provider.
Standard sample size and analysis methods for iRCTs rely on the assumption of independence between partici-pants, which is violated when clustering is present. The
‘clustering effect’ is commonly quantified using the
intracluster correlation coefficient (ICC). The ICC mea-sures the extent to which outcomes from participants within the same cluster are correlated to one another
[1]. When designing and analysing iRCTs with
cluster-ing we need to consider implications of the potential lack of independence. Ignoring clustering in the ana-lysis can lead to over precise results and consequently
incorrect conclusions [1]. Clustering of any form
re-sults in a reduction in the effective sample size, hence, there is a reduction in the power to detect an intervention effect if it truly exists.
In addition to obtaining sufficient power and accurate results, accounting for clustering enables us to estimate the ICC. ICCs are often important for the interpretation of trial results; we may be directly interested in the inter-vention group or care provider effects. ICCs are also key when calculating sample sizes for RCTs with clustering,
in order to maintain power [1].
An increasingly applied design in healthcare and educa-tion research is a partially nested randomised controlled
trial (pnRCT) [6], where participants are individually
ran-domised to trial arms and clustering of outcomes occurs
in only one arm of the trial [7] (also termed partially
clustered trials). The STEPWISE trial is an example of a
pnRCT, assessing a structured lifestyle education
programme aimed at supporting weight loss for adults with schizophrenia and first episode psychosis in a community mental health setting. Individuals were rando-mised to either an intervention arm of group-based life-style education sessions or a control arm receiving usual
care at the individual level [8].
Specific statistical methods need to be used for analys-ing pnRCTs. Consequently, there has been a consider-able growth in the methodology literature (particularly in the fields of psychotherapy and educational research) in the past few decades both proposing and reviewing statistical methods for pnRCTs.
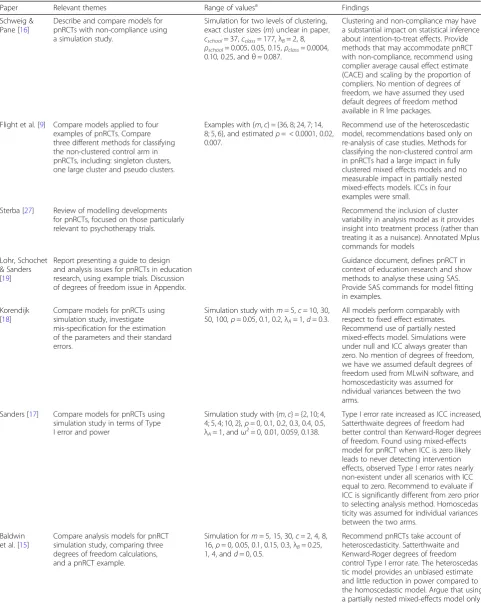
Table 1 presents a summary of relevant literature
on the analysis of pnRCTs. This expands on the
lit-erature search by Flight et al. [9] summarising models
for the analysis of pnRCTs. Sample size calculations
for pnRCTs have been addressed elsewhere [10–14].
Analysis methods for pnRCTs have mainly focussed on using mixed-effects models, individual-level models which account for the hierarchical structure of the data
[6, 7, 9, 15–19]. These models allow us to control for
baseline covariates and represent the different levels in the data, including cluster, individual, and repeated measures (where applicable). In addition to accounting for the clustering, we may expect the variance of the individ-ual errors to differ between trial arms in pnRCTs,
termed heteroscedastic variance [7]. When a clustered
intervention arm is compared to a non-clustered control arm the between-cluster variation in the intervention arm is not present in the control arm. The clustered interven-tion may result in a decrease or increase of the individual level variability.
In this study, we use a series of simulations to evaluate the statistical analysis models for two-arm parallel pnRCTs with continuous outcomes, assessing a range of scenarios including the effect of cluster size and the number of clusters. In theory, the mixed-effects models can be formulated so that they do not model clustering in the control arm, however, when running these models in statistical software packages it is necessary to impose some form of clustering in the control arm. The
litera-ture identified in Table 1 highlighted that research to
date is lacking in addressing the best way to treat the non-clustered control arm when fitting the models in statistical software, using scenarios of relevance in the field of public health with small clusters and small ICCs
[9], and evaluating the effect of the variance ratio of the
residuals on the model fit. In pnRCTs we may have small
numbers of clusters [9], thus we evaluate the impact of
Table 1Summary of relevant literature on analysis of pnRCTs
Paper Relevant themes Range of valuesa Findings
Schweig & Pane [16]
Describe and compare models for pnRCTs with non-compliance using a simulation study.
Simulation for two levels of clustering, exact cluster sizes (m) unclear in paper, cschool= 37,cclass= 177,λB= 2, 8, ρschool= 0.005, 0.05, 0.15,ρclass= 0.0004, 0.10, 0.25, andθ= 0.087.
Clustering and non-compliance may have a substantial impact on statistical inference about intention-to-treat effects. Provide methods that may accommodate pnRCT with non-compliance, recommend using complier average causal effect estimate (CACE) and scaling by the proportion of compliers. No mention of degrees of freedom, we have assumed they used default degrees of freedom method available in R lme packages.
Flight et al. [9] Compare models applied to four examples of pnRCTs. Compare three different methods for classifying the non-clustered control arm in pnRCTs, including: singleton clusters, one large cluster and pseudo clusters.
Examples with {m,c} = {36, 8; 24, 7; 14, 8; 5, 6}, and estimatedρ= < 0.0001, 0.02, 0.007.
Recommend use of the heteroscedastic model, recommendations based only on re-analysis of case studies. Methods for classifying the non-clustered control arm in pnRCTs had a large impact in fully clustered mixed effects models and no measurable impact in partially nested mixed-effects models. ICCs in four examples were small.
Sterba [27] Review of modelling developments for pnRCTs, focused on those particularly relevant to psychotherapy trials.
Recommend the inclusion of cluster variability in analysis model as it provides insight into treatment process (rather than treating it as a nuisance). Annotated Mplus commands for models
Lohr, Schochet & Sanders [19]
Report presenting a guide to design and analysis issues for pnRCTs in education research, using example trials. Discussion of degrees of freedom issue in Appendix.
Guidance document, defines pnRCT in context of education research and show methods to analyse these using SAS. Provide SAS commands for model fitting in examples.
Korendijk [18]
Compare models for pnRCTs using simulation study, investigate mis-specification for the estimation of the parameters and their standard errors.
Simulation study withm= 5,c= 10, 30, 50, 100,ρ= 0.05, 0.1, 0.2,λA= 1,d= 0.3.
All models perform comparably with respect to fixed effect estimates. Recommend use of partially nested mixed-effects model. Simulations were under null and ICC always greater than zero. No mention of degrees of freedom, we have we assumed default degrees of freedom used from MLwiN software, and homoscedasticity was assumed for ndividual variances between the two arms.
Sanders [17] Compare models for pnRCTs using simulation study in terms of Type I error and power
Simulation study with {m,c} = {2, 10; 4, 4; 5, 4; 10, 2},ρ= 0, 0.1, 0.2, 0.3, 0.4, 0.5, λA= 1, andω2= 0, 0.01, 0.059, 0.138.
Type I error rate increased as ICC increased, Satterthwaite degrees of freedom had better control than Kenward-Roger degrees of freedom. Found using mixed-effects model for pnRCT when ICC is zero likely leads to never detecting intervention effects, observed Type I error rates nearly non-existent under all scenarios with ICC equal to zero. Recommend to evaluate if ICC is significantly different from zero prior to selecting analysis method. Homoscedas ticity was assumed for individual variances between the two arms.
Baldwin et al. [15]
Compare analysis models for pnRCT simulation study, comparing three degrees of freedom calculations, and a pnRCT example.
Simulation form= 5, 15, 30,c= 2, 4, 8, 16,ρ= 0, 0.05, 0.1, 0.15, 0.3,λB= 0.25, 1, 4, andd= 0, 0.5.
We evaluate and provide recommendations for the
most appropriate analysis methods for pnRCTs,
including:
1) where mixed-effects models are necessary, 2) methods of specifying the clusters in the
non-clustered arm when fitting a model and the impact these have on the analysis,
3) the impact of cluster sizes and the number of clusters on statistical inference and,
4) the impact of heteroscedastic individual variance between trial arms on statistical inference.
Methods
Methods for analysis of partially nested trials
In this section, we present the main modelling ap-proaches currently available and used for pnRCTs,
in-cluding ignoring clustering altogether, imposing
clustering in the non-clustered control arm, and expli-citly modelling the partially nested design by modelling clustering only in the intervention arm.
It is possible to account for clustering by including each cluster as a fixed effect in a standard regression model, in addition to a fixed effect representing the intervention ef-fect. Although this method is simple to implement, it is
not recommended. Firstly, it does not reflect the study de-sign of a pnRCT and may require a large number of fixed
effects to be fitted lowering the degrees of freedom [9].
Secondly, if clusters are of size one there is insufficient in-formation to estimate both the intervention effect and the cluster effect for each cluster. Finally, it will generally underestimate the intervention effect variability as the cluster level variability is removed.
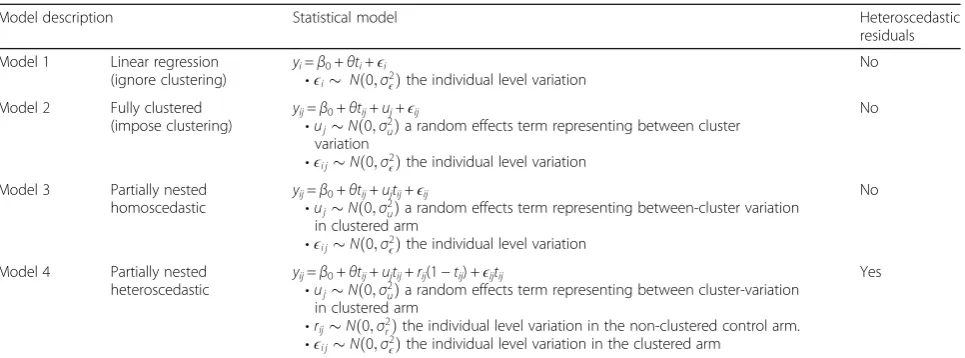
Table2presents a summary of the models for the
ana-lysis of pnRCTs using findings from the literature search
by Flight et al. [9]. We define: y as a continuous
out-come, i is the individual participant indicator, j is the
cluster indicator,tis the intervention indicator (0 =
con-trol, 1 = intervention), θ is the intervention effect, β0is
an intercept term. Error terms are defined depending on
the model procedure, represented using ϵ, u, and r,
where u represents the between cluster variation and ϵ
andrrepresent individual level variation.
Model 1 (Table2) is the linear regression model which
ig-nores the clustering and uses analysis for non-clustered tri-als, assuming independence between individuals regardless of whether they are in the same cluster. This infers that the
conditional variance ofyin both the intervention and
con-trol arms is equal. If the outcomes of individuals in the same cluster are correlated, the independence assumption Table 1Summary of relevant literature on analysis of pnRCTs(Continued)
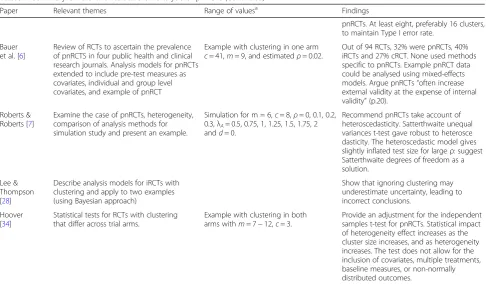
Paper Relevant themes Range of valuesa Findings
pnRCTs. At least eight, preferably 16 clusters, to maintain Type I error rate.
Bauer et al. [6]
Review of RCTs to ascertain the prevalence of pnRCTS in four public health and clinical research journals. Analysis models for pnRCTs extended to include pre-test measures as covariates, individual and group level covariates, and example of pnRCT
Example with clustering in one arm c= 41,m= 9, and estimatedρ= 0.02.
Out of 94 RCTs, 32% were pnRCTs, 40% iRCTs and 27% cRCT. None used methods specific to pnRCTs. Example pnRCT data could be analysed using mixed-effects models. Argue pnRCTs“often increase external validity at the expense of internal validity”(p.20).
Roberts & Roberts [7]
Examine the case of pnRCTs, heterogeneity, comparison of analysis methods for simulation study and present an example.
Simulation for m = 6,c= 8,ρ= 0, 0.1, 0.2, 0.3,λA= 0.5, 0.75, 1, 1.25, 1.5, 1.75, 2 andd= 0.
Recommend pnRCTs take account of heteroscedasticity. Satterthwaite unequal variances t-test gave robust to heterosce dasticity. The heteroscedastic model gives slightly inflated test size for largeρ: suggest Satterthwaite degrees of freedom as a solution.
Lee & Thompson [28]
Describe analysis models for iRCTs with clustering and apply to two examples (using Bayesian approach)
Show that ignoring clustering may underestimate uncertainty, leading to incorrect conclusions.
Hoover [34]
Statistical tests for RCTs with clustering that differ across trial arms.
Example with clustering in both arms withm= 7−12,c= 3.
Provide an adjustment for the independent samples t-test for pnRCTs. Statistical impact of heterogeneity effect increases as the cluster size increases, and as heterogeneity increases. The test does not allow for the inclusion of covariates, multiple treatments, baseline measures, or non-normally distributed outcomes.
a
m= cluster size,c= number of clusters,ρ= ICC,d= standardised effect size,ω2
is violated and we underestimate uncertainty around inter-vention effects when using the linear regression model above.
Model 2 (Table 2) is the fully clustered mixed-effects
model which includes the cluster as a random effect; this includes variability at both the individual and cluster level. The mixed-effects model with imposed clustering of the control arm requires the estimation of a random cluster effect for both intervention and control groups. Some op-tions for the imposed clustering in the control arm are
given in Table 3. The variance of the control arm and
intervention arm are assumed to be the same (homoscedas-tic). When the variance is believed to differ between control and intervention arm model 2 is not appropriate as it does not account for heteroscedasticity. Models 3 and 4
(Table 2) apply the cluster effect to the clustered arm only
[7,10,11,14], we term these the partially nested models.
Individuals in the non-clustered control arm are as-sumed independent. This accurately reflects the design of the study with clustering only in one arm. In the par-tially nested homoscedastic model, we apply the random
effect uj to the clustered intervention arm only;
between-cluster variability is only present for the inter-vention arm. Model 3 is homoscedastic as the variance
of the individual errors,ϵij, between arms is the same. In
practice, the variance of the individual errors may differ
between trial arms [7]. Therefore, model 3 is extended
to a partially nested heteroscedastic model, model 4, this allows for differing individual errors between
intervention and control arms but does not constrain the form of heteroscedasticity.
Imposed clustering in the control arm
Regardless of whether or not the model assumes cluste-ring in one (models 3 and 4) or both arms (model 2), within the statistical software package a decision must be made about how to code the cluster indicators in the control arm. One method is to impose clusters for all in-dividuals, including those in the control arm, and use analysis for cRCTs with clustering in both arms.
Table 3 represents the different options for imposing
clustering, j, in the control arm, lis the number of
indi-viduals in the control arm andk is the number of
arbi-trary clusters in the control group. Option one treats the control group as one single cluster; option two treats each individual in the control arm as their own cluster
of size one (singleton clusters) givingj=l clusters in the
control arm. ICC estimation can be problematic with options one and two, in theory, it is not possible to estimate between-cluster variability in option one, or es-timate within cluster variability in the control group
using option two [20]. Option three imposes artificial
pseudo-random clusters in the control group to
overcome the problem of estimating within or
between-cluster variability. The number of arbitrary between-clusters, k,
needs to be considered. We chose it to be equal across treatment arms. In addition, option three will likely result in a lower ICC estimation due to the assumed independence of control participants.
In our simulation study, the fully clustered model 2 is
parametrised using the imposed clustering from Table3.
The models are:
Model 2.1 fully clustered mixed-effects model with singleton clusters in the control arm;
Table 2Models for the analysis of pnRCTs
Model description Statistical model Heteroscedastic
residuals
Model 1 Linear regression (ignore clustering)
yi=β0+θti+ϵi
•ϵi Nð0;σ2ϵÞthe individual level variation
No
Model 2 Fully clustered
(impose clustering) y
ij=β0+θtij+uj+ϵij
•ujNð0;σ2
uÞa random effects term representing between cluster variation
•ϵi jNð0;σ2ϵÞthe individual level variation
No
Model 3 Partially nested homoscedastic
yij=β0+θtij+ujtij+ϵij
•ujNð0;σ2uÞa random effects term representing between-cluster variation
in clustered arm
•ϵi jNð0;σ2ϵÞthe individual level variation
No
Model 4 Partially nested
heteroscedastic y
ij=β0+θtij+ujtij+rij(1−tij) +ϵijtij
•ujNð0;σ2
uÞa random effects term representing between cluster-variation in clustered arm
•rijNð0;σ2
rÞthe individual level variation in the non-clustered control arm.
•ϵi jNð0;σ2ϵÞthe individual level variation in the clustered arm
Yes
Table 3Options for imposing clustering in the non-clustered control arm
Option Cluster Intervention
1 j= 0 j= 1,…,c
2 j= 1,…,l j=l+ 1,…,c
Model 2.2 fully clustered mixed-effects model with one large cluster in the control arm;
Model 2.3 fully clustered mixed-effects model with pseudo clusters in the control arm.
Flight et al. [9] investigated the effect of the different
methods of imposing clustering in the control arm
presented in Table3in four pnRCT case-studies. The four
case-studies covered trials evaluating the effect of: specialist leg ulcer clinics (clustered by clinic), acupuncture for low back pain (clustered by acupuncturist), postnatal support in the community (clustered by community support worker), and telephone befriending for maintaining quality of life in older people (clustered by volunteer facilitator). Little differ-ence was found between the different methods for the fully clustered mixed-effects models and there was no difference between the different methods for the partially nested mixed-effects models.
We anticipated that the method of imposing the clus-tering in the control arm does not affect the results of the methods which model clustering in only one arm, however, this evaluated in the simulation study.
Degrees of freedom for fixed effect estimates
In the mixed-effects models above we wish to carry out significance tests for the intervention effect. In addition to the correct choice of model, the test statistics and degrees of freedom in mixed-effects models also need to be considered. For large sample sizes in mixed-effects models, the test statistics for fixed effects can be as-sumed Normally distributed. However, for small samples, the t-distribution is generally used as an approximation of the distribution of the test statistic. Estimating the degrees of freedom for the t-distribution is unclear for pnRCTs and will affect both the significance test and the confi-dence intervals of the intervention effect estimate.
Comparison of degrees of freedom correction methods has been undertaken for cRCTs and pnRCTs with small
numbers of clusters [15, 21]. The Satterthwaite
small-sample degrees of freedom correction takes into account the variance structure of the data, for pnRCTs, it has been shown to be superior to the between-within method for maintaining Type I error rates (and
compa-rable to the Kenward-Roger method) [15]. Following
these results, the Satterthwaite approximation was used to calculate degrees of freedom (using dfmethod() option
for mixed, available in Stata 14 onwards [22]).
Simulation study
Overview
We performed a simulation study to evaluate the
statis-tical analysis models for pnRCTs presented in Table 2,
and the imposed clustering of the control arm in Table3
[23]. All models were fitted using a restricted maximum
likelihood procedure (REML). All simulations were done
in Stata [22], graphs produced using ggplot2 [24] in R
[25]. See Additional file1for simulation code.
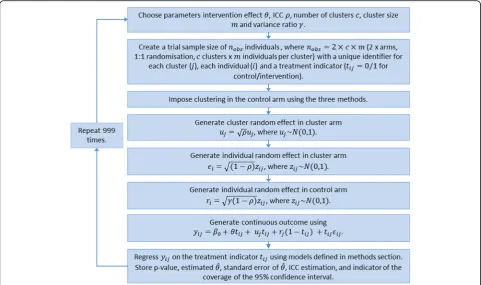
Data-generating mechanism
We simulated data to replicate a two-arm parallel pnRCT trial with a non-clustered control arm and a clustered intervention arm (randomised 1:1) and a con-tinuous outcome. We simulated data under various
de-sign scenarios and under both the null (θ= 0) and
alternative hypothesis (θ=A, whereA≠0).
Data were simulated from the following model with the intercept set to zero and group allocation denoted
byt(t= 0 for control,t= 1 for intervention arm):
For the intervention armffiffiffiffiffiffiffiffi ðt¼1Þyi j¼θþujp þffiffiffiρ zi j
1−ρ p
For the control armðt¼0Þyi j¼zi jpffiffiffiffiffiffiffiffiffiffiffiffiffiffiγð1−ρÞ
Whereuj~N(0, 1) andzij~N(0, 1). This simulates an ICC
of ρ and a ratio of individual level variance between the
non-clustered control arm and the clustered intervention
arm of γ. If γ= 1, there is homoscedasticity between the
individual level variance in the control and intervention arms. Full simulation study steps, including the data
generation process and modelling, are presented in Fig.1.
Simulation scenarios are presented in Table4. We
var-ied: the intervention effect, ICC, cluster size, number of clusters, and ratio of individual variance between the
trial arms. Ifγ= 0.25 then individual variance in the
con-trol arm is one quarter that in the intervention arm and
if γ= 4 then individual variance in the control arm is
four times that in the intervention arm.
Simulation values were chosen based on literature on
pnRCTs [7, 9, 15, 17, 18, 26–28], as well as extending
these to more extreme cases ofγ and ρ that may occur
in rare instances. Reporting of ICCs in iRCTs with clus-tering is limited at present and it is plausible that ICCs in pnRCTs differ from those of cRCTs. Current evidence suggests ICCs in iRCTs with clustering in either one or both arms are generally small and often less than 0.05
[7–9, 29], hence the choice to include a small ICC ρ=
0.01 in the simulations with ICCs of 0.2 or more occur-ring only in rare instances. We were unaware of specific literature on the evidence of heteroscedasticity, however, from the authors experience of working on trials it was
expected γ to typically stay within the range of 0.5–2.
to be investigated for a given total trial sample size.
Figure 2 provides a graphical example of the simulated
partially nested trial data.
Methods
Each simulated dataset was analysed using the models
described in Table2.
Estimand
Our estimands of interest are the REML estimate of
the intervention effect θ and the model estimate of
the ICC ρ.
Performance measures
We used the following performance measures: bias, mean square error (MSE), and coverage of 95%
confi-dence intervals forθ^, Type I error rate and power
(calcu-lated as the proportion of simu(calcu-lated results with a statistically significant intervention effect at the 5% level when the null or alternative hypothesis were true, for Type I error and power respectively) and where
appli-cable, model estimated ICC. See Additional file 2 for
more detail on performance measures. For each of the 1440 scenarios 1000 datasets were generated; a 5% significance level and 95% confidence interval based on 1000 simulations has a Monte Carlo error of 0.7%.
Results
Model convergence was generally satisfactory for all
models with models converging 95–100% of the time
across the different scenarios.
Imposed clustering in the control arm
Methods for imposing clustering in the control arm,
pre-sented in Table 3, had a negligible impact on the
per-formance measures of the partially nested mixed-effects models (models 3 and 4). Under the simulation
scenar-ios, the differences in the p-value, confidence intervals
Fig. 1Flowchart representing the simulation study steps
Table 4Simulation input scenario values (total 1440 scenarios)
Variable Notation Values
Number of clusters c 3, 6, 12, 24
Cluster size m 5, 10, 20, 30
Intervention effect θ 0, 0.2, 0.5
ICC ρ 0, 0.01, 0.05, 0.1, 0.2a, 0.3a
Ratio of individual variance between control and cluster trial arms
γ 0.25a, 0.5, 1, 2, 4a
a
and estimated ICC between the methods were only present at four decimal places. Model fitting was consid-erably faster (around four to five times faster) using ei-ther one large cluster or the pseudo clusters compared to the singleton clusters, however, this will likely be im-material when fitting only a small number of models.
Methods for imposing clustering in the control arm had a large impact on the performance measures of the fully clustered mixed-effects models (models 2.1, 2.2, and 2.3). Specific results for each performance measure are presented in the following sections.
Results are reported only for the partially nested mixed-effects models (models 3 and 4) with the non-clustered controls classified as one large cluster, as other methods were comparable. All three methods for classifying the non-clustered control arms for the fully clustered mixed-effects model (models 2.1, 2.2, and 2.3) are reported.
Bias
The bias of the intervention effect estimate was not af-fected by the analysis model used, individual variances
(γ) or the ICC (ρ). The maximum absolute bias of the
intervention effect was |0.057|, |0.043|, and |0.053| for
θ= 0, 0.2 and 0.5, respectively.
Mean square error
The models produced unbiased estimators with no dif-ference in the observed MSE between the different models. The MSE of the intervention effect estimate had a mean of 0.051 (standard deviation (SD) 0.056) and maximum of 0.346.
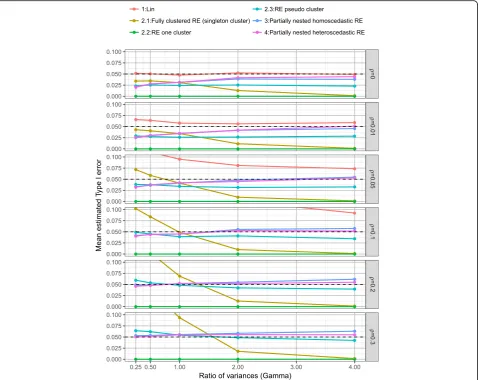
Type I error
Plots of the mean Type I error rates split by model, the
ratio of individual variances (γ) and the ICC (ρ) are
pre-sented in Fig.3. As would be expected the linear
regres-sion model which ignores clustering had inflated Type I
error rates, with Type I error rate affected by ICC (ρ),
the ratio of individual variances (γ), number of clusters
(c), and cluster size (m). Although the inflation was
minimal when ICC ρ= 0.01, the mean Type I error
was 0.061 (SD 0.010). When cluster size m≤10 and
ICC ρ= 0.01 the mean Type I error rate was 0.056
(SD 0.007).
Model 2, the fully clustered models with imposed clus-tering in the control arm resulted in biased Type I error rates. Imposing clustering as singleton clusters (model 2.1) led to Type I error rates which were largely affected
by the ratio of individual variances (γ) and ICC (ρ).
Im-posing one large cluster in the control arm (model 2.2) resulted in Type I error rates of zero (due to the Satterthwaite degrees of freedom correction resulting in large degrees of freedom when imposing one large clus-ter in the control arm). Imposing pseudo clusclus-ters in the control arm of the same size as the intervention arm (model 2.3) provided relatively good control of Type I error rates, mean Type I error of 0.039 (SD 0.018), but was affected slightly by both the ratio of individual
variances (γ) and ICC (ρ).
Both the homoscedastic and heteroscedastic partially nested models (models 3 and 4) provided good control of Type I error rates (model 3: mean Type I error 0.045 (SD 0.016) and model 4: mean Type I error 0.044 (SD 0.014)) with little difference present between the two models.
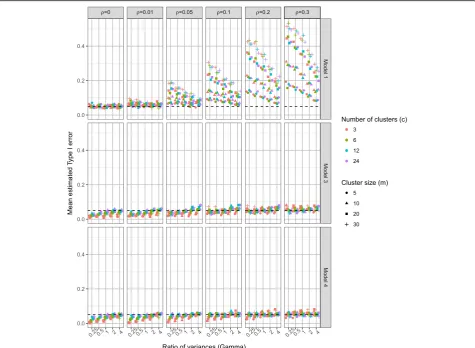
For more detailed comparison Fig.4presents the Type
I error rates for the linear regression model (model 1), the homoscedastic (model 3) and the heteroscedastic
(model 4) partially nested models by ICC (ρ), the ratio
of individual variances (γ), number of clusters (c), and
cluster size (m). Higher ICC values resulted in higher Type I error rates in each model. The impact of ignoring
clustering (model 1) depends on both ICC (ρ), cluster
size (m), and number of clusters (c). Larger number of clusters (c) resulted in better control of Type I error
rates for the partially nested models. When ICC ρ= 0,
the Type I error rates of the partially nested models (models 3 and 4) were reduced from the nominal level. This is due to the cluster variance components being es-timated when they are not actually present in the data.
When the ICC was small (ρ≤0.05) and the individual
variance in the control arm smaller than that in the
intervention arm (γ< 1), the Type I error rates of
par-tially nested models were reduced from the nominal 5%
level. When ICC was large (ρ= 0.3) the partially nested
models generally resulted in inflated Type I error rates. As ICC increased Type I error rates increased, with the −2
0 2 4
Control
Cluster 1Cluster 2Cluster 3Cluster 4Cluster 5Cluster 6Cluster 7Cluster 8Cluster 9Cluster 10Cluster 11Cluster 12
Cluster
Outcome
Fig. 2Example of simulated partially nested trial dataset,ρ= 0.1,
partially nested models 3 and 4 only reaching above the nominal Type I error rate of 5% on average when ICC ρ≥0.2.
The Satterthwaite correction used in Stata mixed (dfmethod(sat)) did not fully correct the Type I error rates to the nominal 5% level, even with the use of the heteroscedastic model 4. The heteroscedastic model 4 did have slightly improved control of Type I error rates than the homoscedastic model 3.
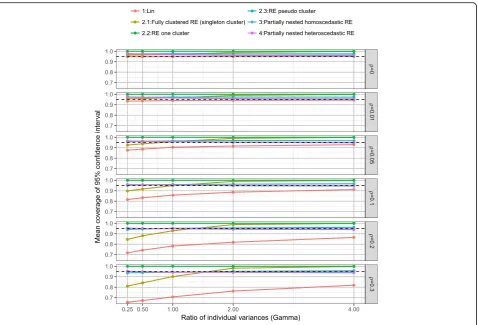
Coverage
Plots of the mean coverage of the 95% confidence inter-vals of the intervention effect estimate split by model,
ICC (ρ) and the ratio of individual variances (γ) are
pre-sented in Fig. 5under the alterative hypothesis. The
lin-ear regression model (model 1) resulted in under
coverage when ICC was small (ρ≤0.05) and the
cover-age rates decrease as ICC (ρ) increases. The fully
clus-tered models with imposed clustering in the control arm
resulted in both over and under coverage dependent on the direction of the variance ratio and the method of im-posed clustering. Imposing clustering as singleton clus-ters (model 2.1) resulted in coverage rates largely
affected by ratio of individual variances (γ). Imposing
one large cluster in the control arm (model 2.2) resulted in over coverage, due to the reduced Type I error rates of zero caused by the Satterthwaite degrees of freedom correction. Imposing pseudo clusters in the control arm (model 2.3) provided mean coverage rates of 0.961 (SD 0.018).
Both the homoscedastic and heteroscedastic partially nested models (models 3 and 4) provided good control of coverage rates of 95% confidence intervals (model 3: mean coverage rate 0.956 (SD 0.014) and model 4: mean coverage rate 0.956 (SD 0.014)) with little difference be-tween the two models. In the simulations over coverage of the 95% confidence intervals for the heteroscedastic
model 4 occurred when ICC ρ≤0.05, except when the
ratio of individual variances γ= 4. Hence, the results were generally conservative when ICC was small. Under coverage of the 95% confidence intervals for the
hetero-scedastic model 4 only occurred for large ICC (ρ) and
ratio of individual variances (γ).
Power
Increasing the number of clusters as opposed to increas-ing the cluster size had a bigger impact on power with a
fixed total sample size. Fig.6shows the power of the
lin-ear regression model (model 1), the homoscedastic (model 3) and the heteroscedastic (model 4) partially
nested models when intervention effect θ= 0.5 by ICC
(ρ), the ratio of individual variances (γ), number of
clusters (c), and cluster size (m) (see Additional file2for
when θ= 0.2). Under the simulation scenarios
con-ducted, 12 or more clusters and cluster sizes of ten or more were generally needed for a power greater than 80%. Using three or six clusters rarely gave power over
80%, only for ICC ρ≤0.05 and relatively large cluster
sizesm≥20, did power go over 80%.
For ICC ρ≤0.05, which is commonly assumed when
planning complex intervention trials in healthcare, power of 80% was generally achieved with: 24 clusters of any size, 12 clusters of size ten or more, and six clusters of size 20 or more (120 in each arm).
Under a ratio of individual variances γ= 1 the total
residual variance in both trial arms is equal to one,
hence, the intervention effect (θ) we simulated is the
standardised intervention effect. Figure 7 shows the
power of models 1, 3 and 4 under homoscedastic
indi-vidual variances (γ= 1). The heteroscedastic model 4 is
over-parameterised in the case of the ratio of individual
variances γ= 1, however, it did not result in a
substan-tially lower power than the homoscedastic model.
Table 5 presents the power of model 4 and model 1
under ICC ρ= 0, model 4 is over-parametrised here.
There is a loss in mean statistical power which ranged between 1.7 to 6.3%.
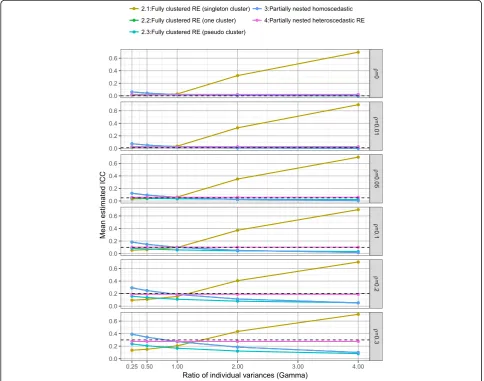
ICC
Figure 8 presents the mean estimated ICC across the
fully clustered and partially nested mixed effect models,
by the ratio of individual variances (γ) and ICC (ρ). ICC estimation was consistent under the heteroscedastic tially nested model (model 4). The homoscedastic par-tially nested model (model 3) resulted in biased ICC, with the direction of bias dependent upon the ratio of
individual variances (γ).
Figure 9 presents the ICC for the homoscedastic
(model 3) and heteroscedastic (model 4) partially nested
models by the ratio of individual variances (γ), ICC (ρ),
number of clusters (c), and cluster size (m). The ICC es-timation from the homoscedastic model was highly
af-fected by γ. The ICC estimation from the
heteroscedastic model was not affected by γ. Using the
heteroscedastic model, there was a slight positive bias in
the ICC estimation when ICC ρ≤0.05, and when ICC
ρ≥0.2 there was slight negative bias in the ICC
estima-tion. For example, when ICCρ= 0.0 the mean ICC
esti-mation was 0.028 (SD 0.018), and when ICCρ= 0.05 the
mean estimation was 0.060 (SD 0.014). As expected ICC estimation improved as sample size increased. The ICC estimation was only consistent across all values of ICC
(ρ) when there were 24 clusters, regardless of cluster
size. For an accurate estimate of ICC when true ICCρ=
0.05, under the simulation scenarios we required cluster
sizes (m) of 20 or 30 or at least six clusters of size ten or 24 clusters of size five.
Summary of results
Simulation results are summarised in Table6 presenting
the performance of the simple linear regression model (model 1), homoscedastic partially nested mixed effects model (model 3) and heteroscedastic partially nested mixed effects model (model 4) under different design scenarios. Results from the fully clustered mixed-effects
models (model 2) are excluded from Table 6 as we do
not recommend these in any scenario regardless of the method used to impose clustering in the control arm. None of the fully clustered mixed-effects models pro-vided full control of the Type I error rates and the par-tially nested mixed effects models always outperformed them.
Discussion
In this study, we have investigated six modelling strat-egies for the analysis of pnRCTs with a continuous out-come. Our simulation study showed that when analysing pnRCTs the use of the heteroscedastic partially nested mixed-effects model for normally distributed outcome
Fig. 6Power whenθ= 0.5, byρ,γ,c, andm
data (using Satterthwaite degrees of freedom) in general provides: unbiased effect estimates; maintains relatively good control of Type I error rates; and did not noticeably cause a reduction in power even with homoscedastic indi-vidual variances across arms. The heteroscedastic partially nested model takes account of the between-cluster
variance (if present) and therefore provides valid
infer-ences for the intervention effect. Additional file2presents
model-fitting code for R, Stata and SAS. When using the partially nested mixed-effects model, the method of classi-fying the non-clustered controls had a negligible impact on statistical inference under the simulation scenarios, agreeing with findings from analysis of four example
pnRCTs by Flight et al. [9].
Our findings were broadly similar to those of
Bald-win et al. [15]. However, they did not assess the
method of classifying the non-clustered controls or
performance of models under small ICC (ρ= 0.01,
lowest value used in our study) which commonly
occur in pnRCTs [7–9, 26, 29]. Unlike findings from
Baldwin et al. [15], the Satterthwaite degrees of freedom
correction did not fully control the Type I error rate in our simulations. The largest discrepancy from the nominal level occurred when the ICC was small, ratio of individual variances <1, and under small sample sizes.
Table 5Mean and SD of power of model 4 versus model 1 underρ= 0 over all scenarios
Intervention effect (θ)
Model Power
Mean (SD)
0 1 0.050 (0.007)
4 0.033 (0.014)
0.2 1 0.388 (0.276)
4 0.327 (0.286)
0.5 1 0.803 (0.254)
4 0.740 (0.298)
We have illustrated that using a naïve linear regression model, which ignores clustering in pnRCTs, gave inflated Type I error rates and resulted in under coverage of confidence intervals when clustering of outcomes was
present. When ICC 0.01≤ρ ≤0.05, which we believe is
common in pnRCTs [9], ignoring clustering led to
largely inflated Type I error rates using the linear regres-sion model. A low ICC may still have a large impact, particularly when cluster sizes are large.
When ICC was small and/or with very few clusters and small cluster sizes using the partially nested mixed-effects models 3 and 4 resulted in underestimated Type I error rates. These models correctly reflect the de-sign of the trials; however, they can result in conservati-vism regarding the precision of estimates due to the bias in estimating the variance estimates when we have a small number of clusters. Consequently, using the par-tially nested mixed effects models with small ICC may make it difficult to detect differences between the trial arms when present.
Sanders [17] recommend evaluating whether ICC is
sig-nificantly different from zero prior to selecting an analysis method. We caution such significance testing for ICC,
and similarly testing for heteroscedasticity [7]. These tests
will generally lack power in a pnRCT and it is not the
statistical significance of the ICC that matters but impact of the magnitude on inference. In general, we recommend the use of the partially nested models when analysing pnRCT trials, particularly if conservatism and an ICC esti-mate are desired. However, the choice of model and the requirement or not for conservatism needs to be consi-dered in the context of the specific trial setting.
Similar to cRCTs [1], in a pnRCT increasing the number
of clusters rather than increasing the cluster size has a greater increase in power for a fixed total sample size. Our simulation results showed that this will also provide a more accurate estimation of the ICC. When the number of clus-ters is small, for example, three clusclus-ters in the intervention arm, the ICC estimation will likely be upwardly biased. With six clusters in the intervention arm, the ICC estimate
was relatively unbiased once the true ICC ≥0.1. The ICC
estimation became consistent regardless of cluster size or true ICC only once there were 24 clusters in the simulation scenarios. This reflects findings from previous research that to reliably estimate the size of clustering effects a large
number of clusters are required [30].
This study investigated the case of analysing partially nested trials under complete compliance. Non-compliance in the clustered arm of a pnRCT may occur when some participants randomised to a particular treatment group or
care provider do not attend any sessions or receive treat-ment as part of different treattreat-ment group or care provider intended at randomisation. Consequently, non-complier outcomes may be assumed independent if they do not
receive the clustered intervention. Schweig and Pane [16]
describe and compare models for pnRCTs with non-com-pliance using a simulation study. They argue that an un-biased intention-to-treat (ITT) estimate under non-compliance on a pnRCT may be obtained using a Complier Average Causal Effects (CACE) model. This method in-volves estimating the treatment effect for compliers and scaling this CACE effect estimate by the proportion of compliers to provide an ITT effect estimate. The issues posed by non-compliance warrant further investigation, considering a broader range of scenarios and investigating the degrees of freedom corrections for valid statistical inferences.
The design and analysis of trials with clustering in one arm needs to take account of heterogeneity and ICC to have a sufficiently powered sample size and accurate intervention effect. We strongly recommend the reporting of ICCs in trials results papers. The framework developed for cRCTs is also broadly applicable in iRCTs with cluster-ing, identifying three dimensions to consider when report-ing an ICC: a description of the dataset (includreport-ing characteristics of the outcome and the intervention); how
the ICC was calculated; and the precision of the ICC [31].
This has the potential to improve the assumptions about ICCs in iRCTs, adhere to CONSORT reporting guidelines
for RCTs of nonpharmacological interventions [32], and
raise awareness of the need to account for clustering in both the sample size and analysis in iRCTs with clustering. A wide variety of terminology are used in iRCTs with clustering in one arm, including partially nested, partially clustered, multi-level, and individually randomized group intervention. A more consistent use of terminology would reduce confusion, improve reporting and make finding relevant ICCs from previous trials easier. We suggest the terminology partially nested randomised trial (pnRCT) to describe an iRCT with clustering in one arm.
Limitations
All the mixed-effects models assume that the cluster level means follow a Normal distribution. This may not be a valid assumption, for example, when we have a small number of clusters.
In the simulations, we have used fixed cluster sizes. In practice, cluster size may vary, causing a loss in efficiency when estimating the intervention effect. A simulation
study by Candel and Van Breukelen [10] found the
effi-ciency loss in the intervention effect estimate was rarely more than 10%, requiring recruitment of 11% more
Table 6Summary of simulation results by different models split byρ,m, andcaveraged over allγ
*
clusters for the intervention arm and 11% more individ-uals for the control arm. The loss of efficiency in the inter-cept variance reached to 15%, requiring 19% more clusters in the clustered arm, and no additional recruitment in the control arm. Additionally, it has been shown in cluster tri-als if the coefficient of variation in cluster size is small, less than 0.23, then the correction on sample size is negligible
[33]. It should be noted that cluster sizes are likely to be
more similar in group administered interventions com-pared to trials which impose clustering by being treated
by the same care provider [7].
Throughout the simulations we assumed there was no effect of clustering in the control arm, this may not strictly be true in practice. In healthcare intervention trials, a
commonly used control intervention is‘care as usual’. This
type of control may induce some form of low-level clus-tering, for instance, treatment by a healthcare practitioner. If the same practitioner treats numerous individuals, we can assume, in the same sense as we have done for the intervention arm that these individuals are clustered and include this in the modelling procedure. However, this in-formation is often not available in trial data and is not unique to pnRCTs.
Partially nested trials pose a number of challenges, in
particular, the issue of internal validity [6]. The grouping
of individuals as part of the delivery of a treatment may affect the outcome. However, taking a pragmatic view-point, we consider the grouping as part of the treatment as a whole if this is reflective of treatment delivery in real-world practice. In addition, if the ungrouped con-trols are the true comparison in real life a pnRCT design will provide external validity.
Conclusion
Partially nested RCTs are increasingly used in complex intervention research. Ignoring clustering can lead to infla-tions of the Type I error rates, even for small ICCs. When analysing a pnRCT with continuous outcomes we recom-mend the use of a heteroscedastic partially nested mixed-effects model with corrected degrees of freedoms such as using the Satterhwaite method, for outcomes similar to those generated under the scenarios of our simulations study. The method used for classifying the non-clustered controls had a negligible impact on the results using the par-tially nested mixed-effects model. The model is easy to im-plement in standard statistical software and does not cause a notable reduction in power under homoscedastic variances. With few clusters, small cluster sizes and small ICC, the par-tially nested model underestimated Type I error rates and gave largely inflated ICC estimates, hence, for such designs there is no optimal model and we need to be cautious in model interpretation. Finally, to aid the design and prior selection of an appropriate analysis plan for pnRCTs, we
strongly recommend the reporting of estimated ICC when publishing trials results.
Additional files
Additional file 1:Example Stata code used to run the simulations described in the manuscript text. (DOCX 16 kb)
Additional file 2:Additional details including: model fitting code for Stata, R, and SAS for the homoscedastic and heteroscedastic partially nested models; performance measures; and results tables. (DOCX 189 kb)
Abbreviations
cRCT:Cluster randomised controlled trials; ICC: Intracluster correlation coefficient; iRCT: Individually randomised controlled trials; pnRCT: Partially nested randomised controlled trials
Funding
JC was funded by the University of Sheffield Harry Worthington PhD Scholarship. MDT, SJW, MD, and LM were funded by the University of Sheffield. This is a summary of independent research funded by the National Institute for Health Research (NIHR)’s Doctoral Research Fellowship funding LF (DRF-2015-08-013). The views expressed are those of the author and not necessarily those of the NHS, the NIHR, the Department of Health or the University of Sheffield.
Availability of data and materials
All data used was simulated, simulations code is available in Additional file1.
Authors’contributions
JC designed and implemented the simulations and drafted and edited the manuscript. MD, LF, and LM provided assistance and consultation in running the simulations. MDT, MD, LF, LM, and SJW provided input into the simulation conception and design and revised the manuscript critically. All authors approved the final manuscript.
Ethics approval and consent to participate
Not applicable.
Consent for publication
Not applicable.
Competing interests
The authors declare that they have no competing interests.
Publisher’s Note
Springer Nature remains neutral with regard to jurisdictional claims in published maps and institutional affiliations.
Received: 15 February 2018 Accepted: 18 September 2018
References
1. Campbell MJ, Walters SJ. How to Design, Analyse and Report Cluster Randomised Trials in Medicine and Health Related Research. Chichester: Statistics in Practice, Wiley; 2014.
2. Campbell MK, Piaggio G, Elbourne DR, Altman DG, Group C. Consort 2010 statement: extension to cluster randomised trials. BMJ. 2012;345:e5661. 3. Hutchings J, Gardner F, Bywater T, Daley D, Whitaker C, Jones K, et al.
Parenting intervention in sure start services for children at risk of developing conduct disorder: pragmatic randomised controlled trial. BMJ. 2007;334(7595):678.
4. Morrell CJ, Walters SJ, Dixon S, Collins KA, Brereton LM, Peters J, et al. Cost effectiveness of community leg ulcer clinics: randomised controlled trial. BMJ. 1998;316(7143):1487–91.
6. Bauer DJ, Sterba SK, Hallfors DD. Evaluating group-based interventions when control participants are ungrouped. Multivariate Behav Res. 2008; 43(2):210–36.
7. Roberts C, Roberts SA. Design and analysis of clinical trials with clustering effects due to treatment. Clin Trials. 2005;2(2):152–62.
8. Gossage-Worrall R, Holt RIG, Barnard K, Carey ME, Davies MJ, Dickens C, et al. STEPWISE–STructured lifestyle education for people WIth SchizophrEnia: a study protocol for a randomised controlled trial. Trails. 2016;17(1):475. 9. Flight L, Allison A, Dimairo M, Lee E, Mandefield L, Walters SJ.
Recommendations for the analysis of individually randomised controlled trials with clustering in one arm–a case of continuous outcomes. BMC Med Res Methodol. 2016;16(1):165.
10. Candel MJJM, Van Breukelen GJP. Varying cluster sizes in trials with clusters in one treatment arm: sample size adjustments when testing treatment effects with linear mixed models. Stat Med. 2009;28(18):2307–24. 11. Fazzari MJ, Kim MY, Heo M. Sample size determination for three-level
randomized clinical trials with randomization at the first or second level. J Biopharm Stat. 2014;24(3):579–99.
12. Batistatou EE, Roberts C, Roberts S. Sample size and power calculations for trials and quasi-experimental studies with clustering. Stata J. 2014;14(1):159–75. 13. Moerbeek M, Wong WK. Sample size formulae for trials comparing
group and individual treatments in a multilevel model. Stat Med. 2008;27(15):2850–64.
14. Moerbeek M, Teerenstra S. Power analysis of trials with multilevel data. Boca Raton: Chapman & Hall; 2016.
15. Baldwin SA, Bauer DJ, Stice E, Rohde P. Evaluating models for partially clustered designs. Psychol Methods. 2011;16(2):149–65.
16. Schweig JD, Pane JF. Intention-to-treat analysis in partially nested randomized controlled trials with real-world complexity. Int J Res Method Educ. 2016;39(3):268–86.
17. Sanders E. Multilevel Analysis Methods for Partially Nested Cluster Randomized Trials. University of Washington; 2011. Available online at:
https://eric.ed.gov/?id=ED529306. Accessed 04 Sep 2018.
18. Korendijk EJH. Robustness and optimal design issues for cluster randomized trials. Utrecht University; 2012. Available online at:https://dspace.library.uu. nl/handle/1874/240965. Accessed 04 Sep 2018.
19. Lohr S, Schochet PZ, Sanders E. Partially Nested Randomized Controlled Trials in Education Research: A Guide to Design and Analysis. National Center for Education Research (NCER). Washington, DC; 2014. Available online at:https://ies.ed.gov/ncer/pubs/20142000/pdf/20142000.pdf. Accessed 04 Sep 2018.
20. Bland M. Grouping in individually randomised trials. In: 4th Annual Conference on Randomised Controlled Trials in the Social Sciences. York; 2009. Available online at:https://www-users.york.ac.uk/~mb55/talks/individ. pdf. Accessed 4 Sept 2018.
21. Kahan BC, Forbes G, Ali Y, Jairath V, Bremner S, Harhay MO, et al. Increased risk of type I errors in cluster randomised trials with small or medium numbers of clusters: a review, reanalysis, and simulation study. Trials. 2016;17(1):438. 22. StataCorp. Stata Statistical Software: Release 14. College Station:
StataCorp LP; 2015. p. 2015.
23. Burton A, Altman DG, Royston P, Holder RL. The design of simulation studies in medical statistics. Stat Med. 2006;25(24):4279–92.
24. Wickham H. ggplot2: elegant graphics for data analysis: New York: Springer-Verlag; 2016.
25. R Core Team. R: a language and environment for statistical computing. Vienna: R Foundation for Statistical Computing; 2017.http://www.R-project.org/
26. Baldwin SA, Murray DM, Shadish WR, Pals SL, Holland JM, Abramowitz JS, et al. Intraclass correlation associated with therapists: estimates and applications in planning psychotherapy research. Cogn Behav Ther. 2011;40(1):15–33. 27. Sterba SK. Partially nested designs in psychotherapy trials: a review of
modeling developments. Psychother Res. 2017;27(4):425–36. 28. Lee KJ, Thompson SG. The use of random effects models to allow for
clustering in individually randomized trials. Clin Trials. 2005;2(2):163–73. 29. Cook JA, Bruckner T, Maclennan GS, Seiler CM. Clustering in surgical trials :
database of intra-cluster correlations. Trials. 2012;13:2.
30. Maas CJM, Hox JJ. Robustness issues in multilevel regression analysis. Stat Neerl. 2004;58(2):127–37.
31. Campbell MK, Grimshaw JM, Elbourne DR, Pocock S, Campbell M, Grimshaw J, et al. Intracluster correlation coefficients in cluster randomized trials: empirical insights into how should they be reported. BMC Med Res Methodol. 2004;4:9.
32. Boutron I, Moher D, Altman DG, Schulz KF, Ravaud P, Grp C. Extending the CONSORT statement to randomized trials of nonpharmacologic treatment: explanation and elaboration. Ann Intern Med. 2008;148(4):295–309. 33. Eldridge SM, Ashby D, Kerry S. Sample size for cluster randomized trials:
effect of coefficient of variation of cluster size and analysis method. Int J Epidemiol. 2006;35(5):1292–300.