P R O C E E D I N G S
Open Access
Application of noncollapsing methods to the
gene-based association test: a comparison study
using Genetic Analysis Workshop 18 data
Tian-Xiao Zhang, Yi-Ran Xie, John P Rice
*From
Genetic Analysis Workshop 18
Stevenson, WA, USA. 13-17 October 2012
Abstract
Rare variants have been proposed to play a significant role in the onset and development of common diseases. However, traditional analysis methods have difficulties in detecting association signals for rare causal variants because of a lack of statistical power. We propose a two-stage, gene-based method for association mapping of rare variants by applying four different noncollapsing algorithms. Using the Genome Analysis Workshop18 whole genome sequencing data set of simulated blood pressure phenotypes, we studied and contrasted the false-positive rate of each algorithm using receiver operating characteristic curves. The statistical power of these methods was also evaluated and compared through the analysis of 200 simulated replications in a smaller genotype data set. We showed that the Fisher’s method was superior to the other 3 noncollapsing methods, but was no better than the standard method implemented with famSKAT. Further investigation is needed to explore the potential statistical properties of these approaches.
Background
During the past five years, genome-wide association stu-dies (GWAS) have rapidly become a standard method for discovering susceptible genes for a variety of complex diseases [1]. Up to now, hundreds of loci with more than 3000 single-nucleotide polymorphisms from approxi-mately 7000 GWAS have been reported to be associated with complex diseases [2]. Nevertheless, a large propor-tion of heritability is left unexplainable from GWAS results that are mainly based on association signals cap-tured by common variants [3]. One potential explanation for this“missing heritability enigma”has been the contri-bution of rare variants, which is often not assessed in reg-ular GWAS studies [3]. Unfortunately, traditional methods often fail in association mapping of rare variants because of poor statistical power. Several methods have been proposed to detect association signals for rare var-iants with improvements in statistical power compared to traditional methods [4-6].
As part of Genetic Analysis Workshop 18 (GAW18), simulated phenotypic data, based on a real sequencing data set, were provided to the scientific community to evaluate and compare statistical genetic methods for rare variants association mapping. We consider a two-stage, gene-based method to detect association signals for both common and rare variants. We first obtain significance pvalues by fitting a mixed effects model for each variant, and then apply 4 noncollapsing algorithms to obtain the gene-wise associationpvalues. Collapsing (or burden) methods combine variant information by assuming con-sistent direction of effects across variants. None of the methods considered here adopt this assumption, although some (Fisher’s, Gene Set Enrichment Analysis [GSEA], sequence kernel association test [SKAT]) do combine variant information.
Methods
Model fitting and algorithms
A mixed linear model was fitted for each variant as described in previous literature [7]. The model was defined as:Y=Xβ+Qv+Zμ+
* Correspondence: [email protected]
Department of Psychiatry, Washington University, 660 S. Euclid Ave., St. Louis, MO 63110, USA
where Y is the quantitative trait of interest (we used first-visit systolic blood pressure [SBP] data were used in this study); × is the genotype;bis the fixed effects of the genotypes; and Q represents the population struc-ture variables. In this study, we chose the first 10 princi-pal components from principrinci-pal component analysis (PCA) for Q;νis the fixed effects ofQ; Zis the variable that evaluates familial relatedness (the theoretical kin-ship matrix was used forZ); and µis the random effects coefficient forZthat corrects the polygenic impact.
After obtaining the variant-wisepvalues by fitting the mixed linear model, four noncollapsing algorithms were modified and applied to the data set to obtain the gene-wise associationpvalues. The algorithms of the 4 meth-ods are summarized as followed:
1. Naïve method. The most significant variant-wisep values within a specific gene were chosen as the gene-wise associationpvalues.
2. Fisher’s method [8]. The gene-wise statistics were calculated through the following equation:
X=−2
number of variants within a specific gene. Because many variants are highly correlated, the basic assumption of independent tests for Fisher’s method is violated. Fisher’s formula will not have a chi-square distribution, so we assessed the significance via permutation analysis.
3. Simes’method [9]. The gene-wise pvalue was sum-marized by the following equation:
Psimes= min
number of variants within a specific gene.
4. GSEA method [10,11]. The test statistics (indicated as ES score) were aggregated from variant-wisepvalues within each gene via a Kolmogorov-Smirnov-like pro-cess in which running sums are accumulated. The equa-tion is given as:
whereNis the total number of variants,r(j)is thejth largest statistic values,NH is the variant number of a
given gene,Sis any given gene, P is the parameter that gives a higher weight to variants with extreme statistic value, arbitrarily set to 1 in this study, andNRis given by:
NR=
Gj∗eS|
r(j∗)|p
Statistical significance and adjustment for multiple hypothesis testing were assessed by a 1000-permutation-based procedure. A family-wise error rate (FWER) proce-dure was used to adjust for multiple hypothesis testing. The FWER is a highly conservative correction procedure that seeks to ensure that the list of reported results does not include even a single false-positive gene. In this study, the FWERpvalue was calculated as the fraction of all permutations whose highest statistics (or smallest pvalues) in all genes is higher than a given gene. In addi-tion to the 4 noncollapsing algorithms introduced above, we also included 2 standard rare variants analysis meth-ods: SKAT [12] and famSKAT [13] in our analysis. FamS-KAT is an extended version of SFamS-KAT and can analyze rare variant when family correlations are present. Furthermore, to evaluate the statistical power of these methods, we extracted the variant information related to the 22 true-positive genes located on chromosome 3 and analyzed these data for all 200 simulated phenotype replicates.
Data and computation
The chromosome 3 sequencing data were analyzed only for phenotype replicate number 1 because of a huge computational burden. The sequencing data were anno-tated by ANNOVAR[14]. Intergenic variants (variants at least 1 kilobase [kb] away from any known gene regions) were excluded. We kept only variants mapped to regula-tory regions.
To preserve the familial structure, a permutation-of-residuals procedure was applied for the 1000 permuta-tions [15,16]. First, we fitted a mixed effects linear model on the phenotypic data with all predictors in the model (except for genotype term) and preserve the residuals for these models. Second, we shuffled the residuals (rather than the phenotypic data used in an ordinary permuta-tion procedure) and randomly assigned them to each subject and generated 1000 phenotypic data replicates. And third, we obtained the permuted statistics and pvalues by fitting a univariate linear model with geno-type as the only predictor of the residuals. This method may introduce potential bias to the permuted statistics andpvalues comparing to directly fitting the full model. To quantify this potential bias, we randomly chose 1429 variants and calculated the percentage difference of the
−log10 scaledpvalues obtained from directly fitting a full model and from the 2-step permutation procedure proposed in this paper.
(http://cran.r-project.org/web/packages/kinship2/index. html) was used to calculate the kinship coefficient matrix for our data set. The R package coxme (http:// cran.r-project.org/web/packages/coxme/index.html) was implemented for fitting the mixed linear model. The R package SKAT (http://cran.r-project.org/web/packages/ SKAT/index.html) was implemented for rare variant analysis with SKAT. The R source code for famSKAT
was downloaded (http://www.bumc.bu.edu/linga/
research/publications/famskat/) and implemented for rare variant analysis. Receiver operating characteristic (ROC) curves were made and compared among the 4 algorithms and two standard methods.
Results
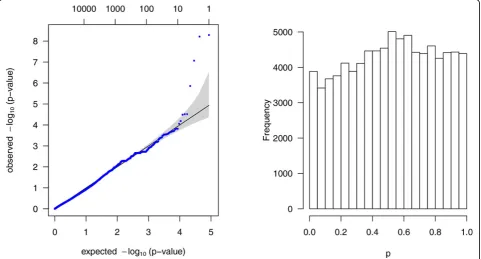
The data consisted of 1237 genes with 87,190 variants that passed the annotation criteria were extracted from the sequencing data set of chromosome 3 for 849 sub-jects. After fitting the mixed linear model, the Q-Q plot and histogram of pvalues of these 87,190 variants is shown in Figure 1. To compare the 4 noncollapsing methods and the 2 standard methods, ROC curves based on these 6 methods were calculated and are shown in Figure 2.
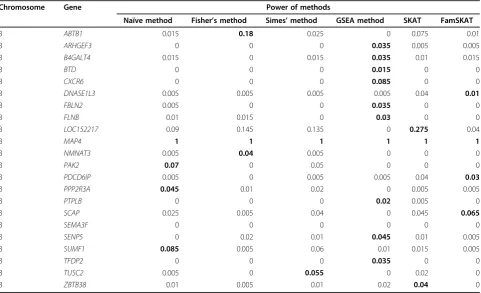
Data for the 22 true-positive genes with 1098 variants were extracted and used for analysis with 200 simulated phenotype replicates. The statistical power information for the 6 methods was summarized and is presented in
Table 1. The results of the permutation bias analysis showed that the percentage difference was only approxi-mately 10%, and the correlation coefficient of variant-wise statistics was 0.9959. These results indicate that the effects of this bias will be limited.
Discussion
The noncollapsing methods introduced in this paper have been broadly used in testing the significance of biological pathways in GWAS data sets [11]. When we substitute the term"pathway”in these noncollapsing algorithms for the term“gene” in sequencing analysis and“gene”for“ var-iants,” we can apply these noncollapsing algorithms to gene-based association detection through modifications. An obvious advantage of aggregatingpvalues (or statis-tics) by applying noncollapsing algorithms, compared to ordinary variants collapsing methods, is that it is a method free of the assumption that all the causal variants from a gene have effects in the same direction. This assumption may not be held in many scenarios even though it is the assumed in many existing rare variants association map-ping procedures.
Another advantage of this research is the utilization of residuals-of-permutation procedure [15,16]. Conducting a permutation on family data has been a challenge in sta-tistical genetics research. Ordinary permutation proce-dures have been mostly utilized in case-control data, which simply shuffle the phenotypic data and randomly
Figure 2ROC curves for 4 noncollapsing algorithms and 2 standard methods. ROC curves for 4 different pathway algorithms based on 1237 genes from 849 subjects on trait SBP (first visit). In the left plot, false-positive rate (FPR) ranges from 0 to 1. In the right plot, FPR is scaled to be less than 0.1 as only the true-positive rate (TPR) with a low FPR is of interest. Black curve, naïve method; blue curve, Fisher’s method; red curve, Simes’method; green curve, GSEA method; purple curve, SKAT; yellow curve, famSKAT.
Table 1 Comparison of the power of the 4 noncollapsing and 2 standard methods
Chromosome Gene Power of methods
Naïve method Fisher’s method Simes’method GSEA method SKAT FamSKAT
3 ABTB1 0.015 0.18 0.025 0 0.075 0.01
3 ARHGEF3 0 0 0 0.035 0.005 0.005
3 B4GALT4 0.015 0 0.015 0.035 0.01 0.015
3 BTD 0 0 0 0.015 0 0
3 CXCR6 0 0 0 0.085 0 0
3 DNASE1L3 0.005 0.005 0.005 0.005 0.04 0.01
3 FBLN2 0.005 0 0 0.035 0 0
3 FLNB 0.01 0.015 0 0.03 0 0
3 LOC152217 0.09 0.145 0.135 0 0.275 0.04
3 MAP4 1 1 1 1 1 1
3 NMNAT3 0.005 0.04 0.005 0 0 0
3 PAK2 0.07 0 0.05 0 0 0
3 PDCD6IP 0.005 0 0.005 0.005 0.04 0.03
3 PPP2R3A 0.045 0.01 0.02 0 0.005 0.005
3 PTPLB 0 0 0 0.02 0.005 0
3 SCAP 0.025 0.005 0.04 0 0.045 0.065
3 SEMA3F 0 0 0 0 0 0
3 SENP5 0 0.02 0.01 0.045 0.01 0.005
3 SUMF1 0.085 0.005 0.06 0.01 0.015 0.005
3 TFDP2 0 0 0 0.035 0 0
3 TUSC2 0.005 0 0.055 0 0.02 0
3 ZBTB38 0.01 0.005 0.01 0.02 0.04 0
assigns them to each subject, thus cannot be directly applied to family data because it destroys the family structure. In this paper, instead of shuffling the phenoty-pic data, we shuffled the residuals obtained from fitting a linear mixed effects model without genotype. These resi-duals have already accounted familial relatedness in the model fitting step and therefore our permutation proce-dure preserves the familial structure.
From the ROC curves in Figure 2 we note that, overall, the Simes’method performed a little better than the other 5 methods, and that GSEA, SKAT, and famSKAT did not perform as well. The other 2 methods were slightly better than the GSEA, SKAT, and famSKAT methods. However, when we limit the false-positive rate to be smaller than 0.1, as shown in the right hand plot of Figure 2 (in prac-tice, only a high true-positive rate with a low false-positive rate is of interest), we see that Fisher’s method and famS-KAT performed better than the other methods at the low false-positive rate range. They both capture approximately 15% of the causal genes (true positives) at a cost of only 5% false-positive signals. However, we did not test the sig-nificance of the ROC curves, so that all these observed dif-ferences could just be noise.
From the power analysis results in Table 1, we see that the geneMAP4was successfully identified to be signifi-cant for all simulated 200 replicates. All six methods achieved 100% power for this gene. This result is reason-able because, according to the“answer sheet”,MAP4has the most“causal variants”and these variants have a rela-tively larger effect size comparing to the variants within other genes. However, this result was obtained when we only analyzed 22 genes. For a genome-scale analysis, the significant signals may be missed as a consequence of correction for multiple comparisons. We have analyzed the whole genotypic data set of chromosome 3 with simulated phenotypic replicate number 1 (1237 genes and 87,190 variants). The result indicated that only naïve method and the 2 standard methods identified gene MAP4to be significant. For the other 21 genes, the lar-gest power was 0.275, which was achieved by SKAT for LOC152217.
Several previous researchers have already applied the noncollapsing methods proposed in this paper to con-duct gene-based analysis [18,19]. However, this previous work has mainly focused on common variants in GWAS data set. As an attempt to apply these noncollapsing algorithms to gene-based association tests using sequen-cing data, we have demonstrated some potentially pro-mising aspects of this approach. However, several problems remain unaddressed. One important issue is the computational intensity. In this study, we have uti-lized a multiprocessor computing server with a 23 × 2.8 GHz CPU and 64GB of memory. The most time-con-suming part of our analysis is the
permutation-of-residuals process and linear model fitting of the per-muted data sets. We have paralleled this process into 20 jobs, but it still takes around 30 hours to complete (this is only the work done for 1 chromosome).
Compared to the permutation process, thep value combination step can be completed much faster (~30 minutes). Because a lot of the non collapsing algorithms require permutation procedures to create null distribu-tion of the statistics, it is somewhat difficult to implement them on a genome-wide-scale data set. In addition, many noncollapsing algorithms cannot be utilized for a gene-based association test directly without proper modifica-tions. The choice of parameters in noncollapsing algo-rithm for rare variant association detection is more an art than a science. Finally, adjustment for multiple hypoth-esis testing is another important issue that needs to be addressed.
Our results indicate that the FWER method is too conservative. For the future work, hierarchical modeling combined with the Markov chain Monte Carlo method may provide better solution to the multiple hypothesis testing problems [20].
Conclusions
Our findings suggest that all the four new methods we proposed along with the standard method implemented with famSKAT were poor in statistical power. In sum, more research is still needed in the statistical method of association mapping for rare variants in the future.
Competing interests
The authors declare that they have no competing interests.
Authors’contributions
TXZ and JPR designed the overall study. TXZ and YRX conducted statistical analyses. TXZ and YRX drafted the manuscript. All authors read and approved the final manuscript. TXZ and JPR revised the manuscript critically.
Acknowledgements
The authors thank Peter Jones for technical support and advice. This work is supported in part by U.S. Public Health Service (USPHS) grant U24MH68457. The GAW18 whole genome sequence data were provided by the T2D-GENES Consortium, which is supported by NIH grants U01 DK085524, U01 DK085584, U01 DK085501, U01 DK085526, and U01 DK085545. The other genetic and phenotypic data for GAW18 were provided by the San Antonio Family Heart Study and San Antonio Family Diabetes/Gallbladder Study, which are supported by NIH grants P01 HL045222, R01 DK047482, and R01 DK053889. The Genetic Analysis Workshop is supported by NIH grant R01 GM031575.
This article has been published as part ofBMC ProceedingsVolume 8 Supplement 1, 2014: Genetic Analysis Workshop 18. The full contents of the supplement are available online at http://www.biomedcentral.com/bmcproc/ supplements/8/S1. Publication charges for this supplement were funded by the Texas Biomedical Research Institute.
Published: 17 June 2014
References
2. A Catalog of Published Genome-Wide Association Studies.[http://www. genome.gov/gwastudies].
3. Manolio TA, Collins FS, Cox NJ, Goldstein DB, Hindorff LA, Hunter DJ, McCarthy MI, Ramos EM, Cardon LR, Chakravarti A,et al:Finding the missing heritability of complex diseases.Nature2012,461:747-753. 4. Li B, Leal SM:Methods for detecting associations with rare variants for
common diseases: application to analysis of sequence data.Am J Hum Genet2008,83(3):311-321.
5. Wu MC, Lee S, Cai T, Li Y, Boehnke M, Lin X:Rare-variant association testing for sequencing data with the sequence kernel association test. Am J Hum Genet2011,89:82-93.
6. Neale BM, Rivas MA, Voight BF, Altshuler D, Devlin B, Orho-Melander M, Kathiresan S, Purcell SM, Roeder K, Daly MJ:Testing for an unusual distribution of rare variants.PLoS Genet2011,7:e1001322. 7. Zhang QY, Chung DY, Kraja A, Borecki II, Province MA:Methods for
adjusting population structure and familial relatedness in association test for collective effect of multiple rare variants on quantitative traits. BMC Proc2011,5(Suppl 9):S35.
8. Wikipedia.[http://en.wikipedia.org/wiki/Fisher’s_method]. 9. Simes RJ:An improved Bonferroni procedure for multiple tests of
significance.Biometrika1986,73:751-754.
10. Wang K, Li MY, Bucan M:Pathway-based approaches for analysis of genomewide association studies.Am J Hum Genet2007,81:1278-1283. 11. Zhang TX, Ruczinski I, Beaty TH:Candidate pathway based analysis for cleft lip with or without cleft palate.Stat Appl Genet Mol Biol2012,11:2. 12. Wu MC, Lee S, Cai T, Li Y, Boehnke M, Lin X:Rare-variant association
testing for sequencing data with the sequence kernel association test. Am J Hum Genet2011,89:82-93.
13. Chen H, Meigs JB, Dupuis J:Sequence kernel association test for quantitative traits in family samples.Genet Epidemiol2013,37:196-204. 14. Wang K, Li M, Hakonarson H:ANNOVAR: Functional annotation of genetic
variants from next-generation sequencing data.Nucleic Acids Res2010,
38:e164.
15. Anderson MJ, Robinson J:Permutation tests for linear models.Aust N Z J Stat2001,43:75-88.
16. Anderson MJ:Permutation tests for univariate or multivariate analysis of variance and regression.Can J Fish AquatSci2001,58:626-639.
17. Patterson N, Price AL, Reich D:Population structure and eigenanalysis. PLoS Genet2006,2:e190.
18. Lehne B, Lewis CM, Schlitt T:From SNPs to genes disease association at the gene level.PLoS One2011,6:e20133.
19. Huang H, Chanda P, Alonso A, Bader JS, Arking DE:Gene-based tests of association.PLoS Genet2011,7:e1002177.
20. Kim LL, Fijal BA, Witte JS:Hierarchical modeling of the relation between sequence variants and a quantitative trait: addressing multiple comparison and population stratification issues.Genet Epidemiol2001,
21(suppl 1):S668-S673.
doi:10.1186/1753-6561-8-S1-S53
Cite this article as:Zhanget al.:Application of noncollapsing methods to the gene-based association test: a comparison study using Genetic Analysis Workshop 18 data.BMC Proceedings20148(Suppl 1):S53.
Submit your next manuscript to BioMed Central and take full advantage of:
• Convenient online submission
• Thorough peer review
• No space constraints or color figure charges
• Immediate publication on acceptance
• Inclusion in PubMed, CAS, Scopus and Google Scholar
• Research which is freely available for redistribution