Evaluating the Learning Curve of Domain Adaptive
Statistical Machine Translation Systems
Nicola Bertoldi Mauro Cettolo Marcello Federico Fondazione Bruno Kessler
via Sommarive 18 38123 Trento, Italy
<surename>@fbk.eu
Christian Buck University of Edinburgh
10 Crichton Street EH8 9AB Edinburgh, UK
Abstract
The new frontier of computer assisted transla-tion technology is the effective integratransla-tion of statistical MT within the translation workflow. In this respect, the SMT ability of incremen-tally learning from the translations produced by users plays a central role. A still open problem is the evaluation of SMT systems that evolve over time. In this paper, we propose a new metric for assessing the quality of an adaptive MT component that is derived from the theory of learning curves: the percentage slope.
1 Introduction
Translation memories and computer assisted trans-lation (CAT) tools are currently the dominant tech-nologies in the translation and localization market, but recent achievements in statistical MT have raised new expectations in the translation industry. So far, statistical MT has focused on providing ready-to-use translations, rather than outputs that minimize the effort of a human translator. The MateCAT project1 aims at pushing what can be considered the new frontier of CAT technology: how to effectively inte-grate statistical MT within the translation workflow. One pursued research direction is developing do-main adaptiveSMT models, i.e. models that dynam-ically adapt to the translations that are continuously added to the translation memory by the user dur-ing her/his work. The ideal goal is to progressively reduce the mismatch between training and testing
1http://www.matecat.com/
data, in such a way that the adapted SMT engine will be able to provide the user withuseful suggestions
– i.e. perfect or worth being post-edited – when the translation memory fails to retrieve perfect or almost perfect matches. Among the well known machine learning paradigms that fit with this scenario are on-line learningandincremental learning, which basi-cally differ in the amount of data that is employed to dynamically adapt the system: a single piece of data in the first case and a batch of data in the lat-ter. Notice that in both cases one assumes that do-main adaptation is performed efficiently, i.e. by only processing the newly received data. Moreover, al-though the quantity of acquired in-domain data is generally limited, their high quality and relevance to the translation task justify their exploitation by all means possible.
Domain adaptive SMT embeds two challenges: (1) the design of effective adaptation algorithms, and (2) the evaluation of MT systems evolving over time. Since the ultimate goal of our efforts is to increase the productivity of human translators, the most ac-curate assessment methodology would be of course to run a field test. This way, we could compare pro-ductivity of human translators receiving suggestions from an MT engine featuring dynamic domain adap-tation against the productivity of human translators working with a static MT engine. As this evaluation is infeasible during daily MT development, we can resort to the several automatic MT metrics, which however, as we will see later, are unsuitable to track the dynamic behaviors we are interested to inves-tigate. Metrics for measuring performance in the case of interactive MT, see for example (Khadivi,
2008), like Key-Stroke Ratio (KSR), Mouse-Action Ratio (MAR), Key-Stroke and Mouse-Action Ratio (KSMR) are known to correlate well with the pro-ductivity of human translators, but their computation requires the actual use of an interactive MT system, i.e. a field test.
In the SMART project,2 the evaluation of adap-tive interacadap-tive MT is explored (Cesa-Bianchi et al., 2008). While no specific metric is proposed, the analysis is based on a plot of cumulative differences of BLEU scores between a baseline and an adaptive system. These differences are computed sentence by sentence and present an interesting view of the dy-namic change of the MT system. We are going to further elaborate on this idea.
Other metrics like Character Error Rate (CER) and Translation Edit Rate (TER) would accurately predict the translators’ productivity if references were generated by using the CAT system; on the contrary, references are usually, as in this paper, gen-erated from scratch based only on the source text and can thus be quite far from CAT-based transla-tions, both lexically and syntactically. The Human-targeted variant of TER, HTER (Snover et al., 2006), needs human intervention and is therefore unfit to meet our requirements.
The main goal of this paper is to design an objec-tive automatic evaluation methodology for an MT system adapting over time. We propose to use the
percentage slopefrom the theory on learning curves to measure the learning ability of adaptive MT sys-tems.
To assess the proposed metric, we have imple-mented a simple but effective adaptation strategy suitable for an MT system integrated in a CAT tool. We show that the percentage slope is able to expose different dynamic behaviors, such as learning, no learning, and forgetting.
2 Dynamic Adaptation Framework
In the MateCAT project scenario, the MT system, which is embedded in the CAT tool to increase the translators’ productivity, adapts over time by ex-ploiting translations generated by the user. The adapted system is then used to provide the user with translation suggestions for the next sentences.
2http://www.smart-project.eu
We refer to this process as dynamic (or incremen-tal) adaptation to emphasize that adaptation hap-pens continuously based on a stream of data.
2.1 Abstract View of the Adaptation Process
From an abstract point of view, the framework of in-cremental adaptation can be summarized as follows:
i) before the process starts, an initial system is built on available data including a parallel cor-pus;
ii) a stream of parallel data becomes available that is split into blocks of (not necessarily) similar size;
iii) the first/next block is considered, but only the source is available yet;
iv) the latest instance of the adapting system trans-lates the source text of the current block; v) the target part of the current block becomes
available for use;3
vi) the system is adapted using the current parallel block and possibly all the previous ones; vii) the loop continues from step iii) until all blocks
are processed.
In each adaptation step, all of the data available so far can be used, but no look ahead is possible. Note that, in principle, each block is translated with a different instance of the adapting system; hence, the same text occurring in two different blocks can be translated differently.
2.2 Evaluation Goals and Requirements
Although dynamic adaptation is closely related to static domain adaptation (Foster and Kuhn, 2007), in this scenario we are not interested in the quality of the final model. In fact, this model is only avail-able once the stream is depleted and therefore is not used anymore.
What we are interested in, and what we want to compare among different approaches, is the systems evolvement over time.
Consider a translator who uses such an incremen-tally adapting system and performs post-editing on its suggested translations. The highest productivity
3
gain is achieved when the adaptation is quick and persistent.
Even though in this paper we are concerned with an automatic metric, it is important to keep the use case of CAT in mind, in particular the presence of a human translator. The TransType2 project4 has found that repeated correction of the same error is strongly disliked by editors (Macklovitch, 2006) and may lead to rejection of the entire system. Similarly, segments that were translated correctly by previous, less adapted systems, should not be negatively af-fected by updates. We will refer to these particular aspects of adaptation asbackward reliability.
Automatic measures, which are aimed at static MT modules, can not take the evolution of the sys-tem into account and are therefore unable to pinpoint such problems. Thus, they are not suitable for the dynamic adaptation scenario.
A new evaluation methodology should satisfy the following requirements:
• ability to compare different strategies
• show behavior over time and reward early im-provements and consistent adaptation
• expose possible overfitting, i.e. check whether generalization is lost due to overly aggressive adaptation
• strong correlation to human productivity
• estimate benefit over a static baseline model without adaptation
• check backward reliability.
2.3 Evaluation Protocol
The performance of adaptive systems as sketched in Section 2.1 is evaluated on different parts of the stream as opposed to the global evaluation used for static systems. We distinguish between two proto-cols which differ in their use of historic data.
Forblock-wise evaluationonly the translations of the most recent block are evaluated with respect to the correct translations once these become available. Any static automatic MT score, e.g. TER (Snover et al., 2006), BLEU (Papineni et al., 2001), can be used, provided that it is reliable on a block of usually relatively small size.
In contrast, in incremental evaluation the scores are computed on all blocks available so far. The
4http://tt2.atosorigin.es
translations of previous blocks are kept fixed, i.e. blocks arenottranslated again once a newly adapted system becomes available as this new system has al-ready seen this data.
Both the block-wise and incremental protocols yield a sequence of scores that reflects the adaptation behavior over time. The former is useful to expose potential weaknesses as discussed above: we expect to see improvement at first and after a while, when enough adaptation data is available, a level curve. If this is not the case, this indicates a problem:
i) should the scores deteriorate over time we might be facing overfitting, possibly due to un-expected heterogeneity in our corpus;
ii) if the scores continue to improve, then the adap-tation method is not aggressive enough and the system underfits.
The incremental evaluation on the other hand allows for easy comparison of different adaptation strate-gies. While the performance on the most recent block becomes less important over time, the perfor-mance on all the blocks processed so far nicely re-flects the utility of the system in the application set-ting.
The metric we are going to propose in the next section processes such sequences of partial scores. It accumulates the trend into a single number and offers an interpretation that relates adaptive behavior to productivity gains.
3 The Percentage Slope
Learning curves (see (Stump P.E., 2002) for a de-tailed introduction) are mathematical models used to estimate the efficiency gain when an activity is repeated. The learning effect was noted in indus-trial environment: the underlying notion is that when people repeat an activity, there tends to be a gain in efficiency. That is exactly the expected behavior of our dynamically adapting MT system: it should im-prove its performance on texts including terms and expressions whose proper translation has been pre-viously provided. Thus we decided to exploit ele-ments from learning theory to measure the evolution of translation capability.
(U) model due to Crawford and thecumulative av-erage(CA) model due to Wright. Both models are based on a common mathematical form:
y=axb (1)
where:
a represents the theoretical labor hours required to build the first unit produced (a positive num-ber)
b represents the rate of learning (negative value, except for “forgetting”)
x represents the number of an item in the produc-tion sequence (unit#1,#2,#3, . . .)
The models differ in the interpretation ofy:
U:yis the labor hours required to build unit#x
CA:y is the average labor hours per unit required to build the first x units
Since b is a mathematically appropriate but counter-intuitive number for describing the slope, thepercentage slopeSis typically used:
S = 10blog10(2)+2 (2)
Sprovides the rate of learning on a scale of 0 to 100, as a percentage. A 100% slope represents no learn-ing at all, zero percentage reflects a theoretically in-finite rate of learning. In practice, human operations hardly ever achieve a rate of learning faster than 70% as measured on this scale.
The correspondence between our block-wise eval-uation (Section 2.3) with the U model, and the incre-mental evaluation with the CA model is straightfor-ward. In the first case, y is the number of errors done in the translation of the block#x; in the sec-ond case,y is the average number of errors (that is the TER score or the 100-BLEU score) made on the firstxblocks.
From a practical point of view, the sequence of scores can be provided while the adapting system is being used; the learning curve which best matches the sequence is then found5and eventually the per-centage slopeSis computed.
5
Notice that the best fitting learning curve can be estimated in the log scale with a simple linear regression analysis.
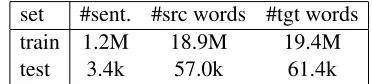
set #sent. #src words #tgt words train 1.2M 18.9M 19.4M test 3.4k 57.0k 61.4k
Table 1: Overall statistics on parallel data of the IT domain used for training and testing the SMT system. Counts of (English) source words and (Italian) target words refer to tokenized texts.
4 Experiments
In order to test-drive the evaluation metric intro-duced in Section 3, several SMT systems showing effective, weak, poor or absent adaptation capabil-ity have been developed. Moreover, a preliminary investigation on backward reliability has been car-ried out. The next paragraphs detail and discuss the experiments performed.
4.1 Data
The task considered in this work involves the trans-lation from English into Italian of documents in the Information Technology (IT) domain.
The training set consists of a large Translation Memory in the IT domain and several OPUS6 sub-corpora, namely KDE4, KDEdoc and PHP. The test set includes the human generated translation of 6 documents, disjoint from the training set. Although in the same domain, the test set is quite different from the training data as shown by comparing val-ues of perplexity (650 vs. 40) and OOV rate (2.4% vs. 0.4%) computed on the source side.7 Further-more, the 6 documents significantly differ among each other: perplexity and OOV rate range from 465 to 880 and from 0.8 to 3.3, respectively. Table 1 col-lects overall statistics on training and test sets.
To simulate the stream of fresh data, the IT test set has been split into blocks of about a thousand8 words each. Before splitting, sentences have been scrambled, with the rationale of generating a large number of homogeneous blocks, simulating a test set consisting of a single document.
6
http://opus.lingfil.uu.se 7
Figures for the training data were measured through a cross-validation technique.
8
4.2 Baseline System
The SMT baseline system is built upon the open-source MT toolkit Moses9 (Koehn et al., 2007). The translation and the lexicalized reordering mod-els are estimated on parallel training data with the default setting; a 5-gram LM smoothed through the improved Kneser-Ney technique (Chen and Good-man, 1999) is estimated on monolingual texts via the IRSTLM toolkit (Federico et al., 2008). Here-inafter, these models are referred to as background (BG) models. The log-linear interpolation weights are optimized by means of the standard MERT pro-cedure provided within the Moses toolkit.
4.3 Adaptive System
The adapting SMT system is built on Moses as well. Besides the BG models of the baseline system, trans-lation, reordering and language models estimated on the stream of fresh data are employed as additional features. Hereinafter, these models are referred to as foreground (FG) models. Unless differently spec-ified, the FG models employed to translate a given block are trained on all preceding blocks. Note that the first instance of the adapting system (i.e. that translating the first block) is exactly the baseline sys-tem, because no adaptation data is available to train FG models yet. FG translation and reordering mod-els are trained in the same way as the BG modmod-els. Due to the limited amount of adaptation data, the FG LM is a 3-gram LM smoothed through the more ro-bust Witten-Bell technique (Witten and Bell, 1991). The interpolation weights are inherited from a companion system trained and tuned on a different domain – official documents of the European Union organization – and are kept fixed.
4.4 Experiments on Adaptive SMT
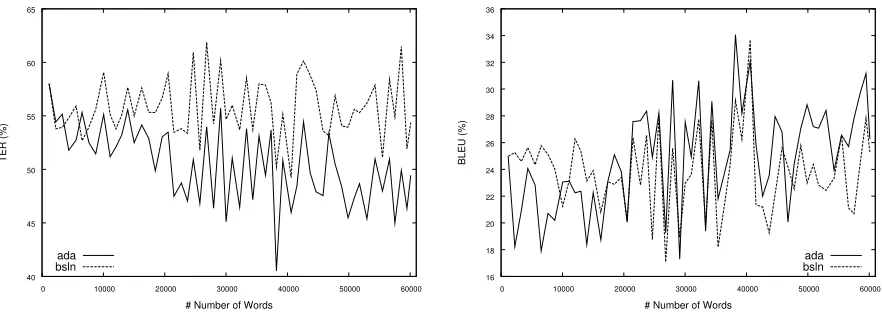
First of all, the baseline and adapting systems were run on the scrambled test set and compared at both block-wise and incremental mode (see Section 2.3). Figure 1 plots block-wise TER and BLEU scores of the baseline and adapting systems as functions of the amount (number of words) of adaptation data. On one hand, it can be guessed that the adapting system performs gradually better and better than the baseline; on the other hand, it is evident that such
9http://www.statmt.org/moses
plots are not the most effective way to show the evo-lution of the adapting system. In fact, the transla-tion difficulty of contiguous blocks can differ a lot. Hence, scores computed on them are not comparable and the corresponding curves are jagged.
The block-wise differences of TER and BLEU scores between the adapting and the baseline sys-tems are plotted in Figure 2: the plots are now cleaner and more readable and vaguely suggest a positive trend, but still remain too jagged and do not provide any information about the absolute perfor-mance of the systems.
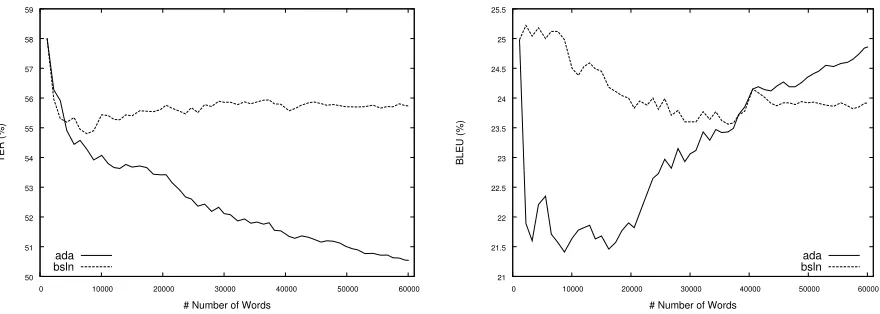
Figure 3 plots the incremental TER and BLEU scores of the baseline and adapting systems as func-tions of the amount of adaptation data. First of all, it is worth noting that the right-most values are the scores computed on the whole test set. In standard evaluation, those would be the only scores provided to show how the adapting system outperforms the baseline system; in particular, the relative improve-ment is larger for TER (9.3%) than for BLEU (3.9%) supposedly because tuning was performed to opti-mize BLEU score which thus is harder to improve. However, the overall scores obscure the way they are reached, that is the evolution over time of the systems, which is especially important for adaptive systems.
Secondly, the incremental evaluation yields much smoother plots clearly showing that after initial fluc-tuations: (i) performance of the baseline stabilizes around an average which does not change over time; (ii) scores of the adapting system tend to get increas-ingly better as more adaptation data is available for updating FG models.
The evaluation metric we are proposing, the per-centage slope introduced in Section 3, is indeed able to spot such kind of paradigmatic behaviors as we will see in the next section. But before going on with the assessment of the metric, some further com-ments on Figure 3:
• in early stages, the adaptation is not effective, likely because of the scarcity of data. This raises two issues: design of more effective adaptation strategies and, in the CAT frame-work, identifying the appropriate time to re-place the baseline with the adapting system;
40 45 50 55 60 65
0 10000 20000 30000 40000 50000 60000
TER (%)
# Number of Words
ada bsln
16 18 20 22 24 26 28 30 32 34 36
0 10000 20000 30000 40000 50000 60000
BLEU (%)
# Number of Words
ada bsln
Figure 1: Block-wise TER (on the left) and BLEU (right) scores of the baseline and the dynamically adapting systems.
-12 -10 -8 -6 -4 -2 0 2 4
0 10000 20000 30000 40000 50000 60000
TER (%)
# Number of Words ada -- bsln
-8 -6 -4 -2 0 2 4 6 8
0 10000 20000 30000 40000 50000 60000
BLEU (%)
# Number of Words
ada -- bsln
Figure 2: Block-wise TER (left) and BLEU (right) differences between the baseline and the dynamically adapting systems.
terms of TER very soon, while the overtaking with regard to BLEU is observed much later. This is because the baseline SMT system was tuned with respect to the BLEU score on in-domain data, differently to the adapting system.
Both these issues are out of the scope of this paper and will be subject of future investigations.
4.5 Assessment of the Percentage Slope
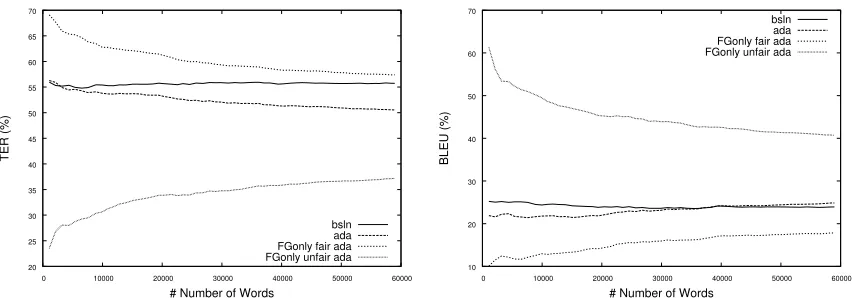
To assess its effectiveness, the percentage slope has been computed on errors committed by the baseline system, the adapting system and an adapting system featuring only FG models (that is without BG mod-els). The FG-only system was used to translate each block either fairly and unfairly: the former mode fits the adaptation process sketched in Section 2.1; in the latter mode, the FG model is adapted on the block
beforeits translation starts.
Figure 4 shows the TER and BLEU scores of such systems in the incremental evaluation. The four ferent behaviors are expected to correspond to dif-ferent percentage slopes. In fact, the S values col-lected in Table 2 confirm the expectations:
• the baseline, completely unable to learn, has in fact an S of 100%
• the adapting system, that learns through a dy-namic adaptation of FG models and generalizes thanks to BG models, has an S of 96-98%
50 51 52 53 54 55 56 57 58 59
0 10000 20000 30000 40000 50000 60000
TER (%)
# Number of Words ada
bsln
21 21.5 22 22.5 23 23.5 24 24.5 25 25.5
0 10000 20000 30000 40000 50000 60000
BLEU (%)
# Number of Words
ada bsln
Figure 3: Incremental TER (left) and BLEU (right) scores of the baseline and the dynamically adapting systems.
model
system
baseline adapting FG-only adapting fair unfair
U 100.4 96.9 96.2 107.2
CA 100.3 97.7 96.5 107.4
Table 2: S values of 4 SMT systems (see text) for the block-wise TER evaluation, corresponding to the U model, and the incremental evaluation, corresponding to the CA model.
• the FG-only adapting system tested in fair mode increases its performance as the models become larger, i.e. more general, as evidenced by an S similar to that of our original adapting system (96%).
Therefore, we can state that S exposes common behaviors of evolving SMT systems; however, stan-dard metrics like TER and BLEU are still in charge of providing absolute performance measures.
In order to give a hint for properly interpret-ing the values reported, we summarize the discus-sion in (Stump P.E., 2002) about “typical learning slopes”. Operations that are fully automated tend to have slopes of 100%, 70% if entirely manual, an intermediate value if mixed. In real industrial envi-ronments, the average slope depends on the type of manufacturing activity: for example, in aircraft in-dustry it is about 85%, it ranges in 90-95% in elec-tronics and in machining. Hence, a 96-98% slope as we measured in our experiments must be con-sidered a significant learning ability of a fully
au-tomated system.
4.6 Experiments on Backward Reliability
A proper assessment of the backward reliability of an evolving system as defined in Section 2.2 would require the identification of patterns translated dif-ferently by the system during its life. We will inves-tigate this issue in the future. For the moment, we try to attack the problem from a global point of view: we simply check that the adaptive system does ”re-member” its previous translation capabilities “on av-erage”, while it learns to better translate novel texts. To this end, a cross-validation policy was fol-lowed: the first two thirds of each test set document are used for dynamically training the FG models, while the remaining portions are used as held-out test sets.
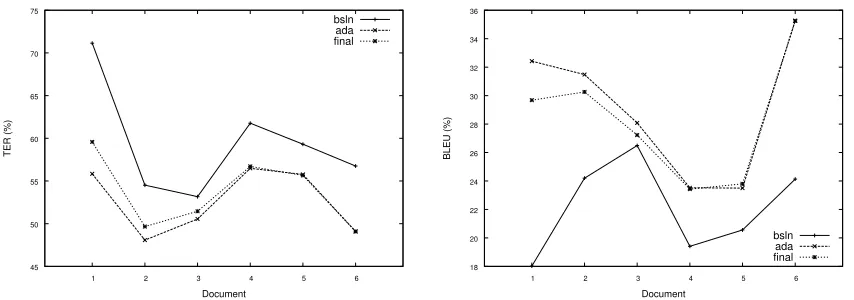
Figure 5 reports the TER and BLEU scores on the 6 test sets of three systems: the baseline sys-tem (bsln), the adapting system (ada) fed by in-crementally merging the available reduced adapta-tion sets, and the system adapted on all adaptaadapta-tion data sets (final).
The final system achieves performance close
toadasystem on each held-out set; this reveals that our adaptation process is effective both in learning and in remembering.
20 25 30 35 40 45 50 55 60 65 70
0 10000 20000 30000 40000 50000 60000
TER (%)
# Number of Words
bsln ada FGonly fair ada FGonly unfair ada
10 20 30 40 50 60 70
0 10000 20000 30000 40000 50000 60000
BLEU (%)
# Number of Words
bsln ada FGonly fair ada FGonly unfair ada
Figure 4: Incremental TER (left) and BLEU (right) of 4 systems showing different learning slopes.
ing method. On the other hand, it only provides cues about the average behavior and it is not as quickly informative as a single score could be. Hence, the design of a proper metric for measuring the back-ward reliability of MT systems is a challenging task that should be faced by the research community.
5 Summary and Future Work
The evaluation of a dynamically adapting system is an open issue. Metrics used in interactive MT such as HTER or field tests, are infeasible in the daily de-velopment as they involve human translators/judges. On the other hand, standard MT evaluation met-rics either do not expose changes over time (BLEU, TER) or cannot be applied (CER).
The main contribution of this paper is to propose the use of the percentage slope for the evaluation of adapting MT systems, a metric borrowed from the theory on learning curves. For assessing its effec-tiveness, we have developed a simple but effective adapting SMT system suitable to work in the context of a CAT tool supported by MT. We have compared several ways to plot the change in error rate over time for different systems and identified the most suitable for computing the percentage slope. Finally, we have shown that the percentage slope well ex-poses the paradigmatic behaviors of evolving SMT systems.
The MateCAT project has scheduled field tests for the near future which will allow for inclusion of human productivity in the assessment of the per-centage slope. Moreover, efforts will be devoted to the design of adaptation techniques which are more
sophisticated than the simple approach used in this work.
We have also identified the issue of backward re-liability of an adapting system, that is the ability to learn without forgetting the past, and the importance of monitoring it. A best practice based on a cross validation scheme has been proposed. Future inves-tigations will concern finding an effective metric to measure backward reliability.
Acknowledgments
This work was supported by the MateCAT project, which is funded by the EC under the7thFramework Programme.
References
N. Cesa-Bianchi, G. Reverberi, and S. Szedmak. 2008. Online learning algorithms for computer-assisted translation. Deliverable 4.2, SMART project (FP6).
http://www.smart-project.eu/files/D4
2.pdf.
S. F. Chen and J. Goodman. 1999. An empirical study of smoothing techniques for language modeling.
Com-puter Speech and Language, 4(13):359–393.
M. Federico, N. Bertoldi, and M. Cettolo. 2008. IRSTLM: an Open Source Toolkit for Handling Large Scale Language Models. InProc. of Interspeech, pp. 1618–1621, Melbourne, Australia.
G. Foster and R. Kuhn. 2007. Mixture-Model Adapta-tion for SMT. InProc. of WMT, pp. 128–135, Prague, Czech Republic.
S. Khadivi. 2008. Statistical Computer-Assisted
45 50 55 60 65 70 75
1 2 3 4 5 6
TER (%)
Document
bsln ada final
18 20 22 24 26 28 30 32 34 36
1 2 3 4 5 6
BLEU (%)
Document
bsln ada final
Figure 5: TER (left) and BLEU (right) scores of the baseline system, the evolving system and the final adapted system on the document-specific held-out test sets.
Aachen, Germany. Advisors: Hermann Ney and En-rique Vidal.
P. Koehn, H. Hoang, A. Birch, C. Callison-Burch, M. Federico, N. Bertoldi, B. Cowan, W. Shen, C. Moran, R. Zens, C. Dyer, O. Bojar, A. Con-stantin, and E. Herbst. 2007. Moses: Open Source Toolkit for Statistical Machine Translation. InProc. of
ACL: Demo and Poster Sessions, pp. 177–180, Prague,
Czech Republic.
E. Macklovitch. 2006. Transtype2: The last word. In
Proc. of LREC 2006, Genoa, Italy.
K. Papineni, S. Roukos, T. Ward, and W.-J. Zhu. 2001. Bleu: a method for automatic evaluation of machine translation. Research Report RC22176, IBM Research Division, Thomas J. Watson Research Center.
M. Snover, B. Dorr, R. Schwartz, L. Micciulla, and J. Makhoul. 2006. A study of translation edit rate with targeted human annotation. InProc. of AMTA, Boston, US-MA.
E. Stump P.E. 2002. All about learning curves. InProc.
of SCEA. http://www.galorath.com/im
ages/uploads/LearningCurves1.pdf.
I. H. Witten and T. C. Bell. 1991. The zero-frequency problem: Estimating the probabilities of novel events in adaptive text compression. IEEE Trans. Inform.