A LINEAR GRAMMAR APPROACH FOR THE
ANALYSIS OF MATHEMATICAL DOCUMENTS
by
JOSEF B. BAKER
A thesis submitted to
The University of Birmingham
for the degree of
DOCTOR OF PHILOSOPHY
School of Computer Science
College of Engineering and Physical Sciences
The University of Birmingham
University of Birmingham Research Archive
e-theses repository
This unpublished thesis/dissertation is copyright of the author and/or third parties. The intellectual property rights of the author or third parties in respect of this work are as defined by The Copyright Designs and Patents Act 1988 or as modified by any successor legislation.
Any use made of information contained in this thesis/dissertation must be in accordance with that legislation and must be properly acknowledged. Further distribution or reproduction in any format is prohibited without the permission of the copyright holder.
Abstract
Many approaches have been proposed for the recognition of mathematical formulae, tradi-tionally using the results of optical character recognition over scanned documents. How-ever, optical character recognition generally performs poorly when presented with math-ematics, making it difficult to accurately parse formulae. Due to the rapidly increasing number of natively digital documents available, an alternative to optical character recog-nition is now available, that of analysing files directly instead of images.
In this thesis, we explore such a method, analysing files in the ubiquitous Portable Document Format directly and combining it with image analysis, to produce the necessary information for the analysis of mathematical formulae and documents.
We also revisit a method proposed in the 1960s for parsing handwritten mathematics. An extremely efficient, yet impractical approach due to a reliance of perfect input and precise character positioning. We heavily modify and extend this method, removing many of its restrictions and use it in conjunction with the perfect input from the PDF analysis, yielding high quality results which compare favourably with the leading scientific document analysis system.
ACKNOWLEDGEMENTS
There are many people I would like to thank within the School of Computer Science for the opportunities, friendship and help that I have received during my enjoyable time at university. However, in particular I would like to thank my supervisor, Volker Sorge for the time and effort he has dedicated to me and the support he has given me since I started my undergraduate final year project with him back in 2006.
Without the support of my parents, Jane and Michael, I would not have been able to embark on my university career, and for everything they have done for me over the years, I will be eternally grateful.
CONTENTS
1 Introduction 1 1.1 Hypotheses . . . 2 1.2 Contributions . . . 2 1.3 Publications . . . 3 1.4 Overview of Thesis . . . 4I
Background
6
2 Traditional Text Recognition 7 2.1 Optical Character Recognition . . . 82.2 Segmentation . . . 9
2.2.1 Projection Profile Cutting . . . 9
2.2.2 Whitespace Analysis . . . 11
2.3 Recognition . . . 12
2.4 Post Processing and Correction . . . 13
3 Mathematical Formula Analysis 15 3.1 Mathematical Optical Character Recognition . . . 15
3.1.1 Specific Mathematical OCR . . . 16
3.1.2 Hybrid Recognition . . . 17
3.1.3 Database Driven Recognition . . . 18
3.2.1 Statistical Analysis and Heuristics . . . 19
3.2.2 OCR Based . . . 22
3.3 Mathematical Formula Recognition . . . 23
3.3.1 Projection Profile Cutting . . . 24
3.3.2 Virtual Link Networks . . . 26
3.3.3 Graph Rewriting . . . 28
3.3.4 Baseline Parsing and Coordinate Grammars . . . 29
4 Digital File Analysis and Extraction 32 4.1 Character Extraction from Postscript . . . 33
4.1.1 Character Extraction from PDF . . . 34
4.2 Layout Analysis and Segmentation . . . 36
4.2.1 PDF Bounding Boxes . . . 37
4.3 PDF File Structure . . . 39
4.3.1 Content Streams . . . 40
4.3.2 Fonts . . . 42
II
Mathematical Document Analysis
44
5 PDF Extraction and Glyph Matching 45 5.1 PDF Analysis . . . 455.1.1 Content Extraction . . . 46
5.1.2 Content Parsing . . . 48
5.2 Connected Component Extraction . . . 49
5.3 Glyph Character Matching . . . 49
6 Parsing Mathematics 52 6.1 Grammar . . . 52
6.1.1 Grammar Rules . . . 54
6.3 Generating Output . . . 73
6.3.1 LATEX Driver . . . 73
6.3.2 MathML Driver . . . 74
7 Improvements 76 7.1 Using Fonts and Spacing . . . 76
7.1.1 Grouping Characters . . . 78
7.1.2 Correcting Character Appearances . . . 81
7.1.3 Correcting Spatial Layout . . . 82
7.1.4 Towards a Semantic Interpretation . . . 84
7.2 Automated Recognition with Layout Analysis . . . 87
7.2.1 Layout Analysis . . . 88
8 Experimentation and Evaluation 95 8.1 Basic Grammar . . . 95
8.1.1 Experimental Setup . . . 95
8.1.2 Results . . . 96
8.1.3 Discussion . . . 99
8.2 Using Fonts and Spacing . . . 103
8.2.1 Experimental Setup . . . 103
8.2.2 Results . . . 103
8.2.3 Discussion . . . 105
8.3 Automated Layout Analysis . . . 106
8.3.1 Experimental Setup . . . 107
8.3.2 Results . . . 107
8.3.3 LATEX Comparison . . . 111
III
Conclusions
113
9 Contributions 114
9.1 PDF Analysis . . . 115
9.2 Linear Grammar . . . 115
9.3 Semantic and Layout Analysis . . . 116
10 Future Work 117 10.1 Semantic Analysis . . . 117
10.2 Full Layout Analysis . . . 118
10.3 Feedback Loop . . . 118
10.4 Comprehensive PDF Extractor . . . 118
10.5 Integration into Other Systems . . . 119
LIST OF FIGURES
2.1 Stages of projection profile cutting over a section of text . . . 10
2.2 Identifying whitespace rectangles . . . 11
3.1 Touching character detection in Infty . . . 18
3.2 An example of PPC on n P i=1 n+i . . . 24
3.3 A virtual link network for cx2y3 . . . 27
3.4 Multiple baselines of a mathematical formula . . . 30
3.5 A graphical form of the division replacement rule from Anderson’s grammar 30 4.1 A highlighted formula in a PDF file . . . 35
4.2 Bounding boxes of characters in PDF files . . . 38
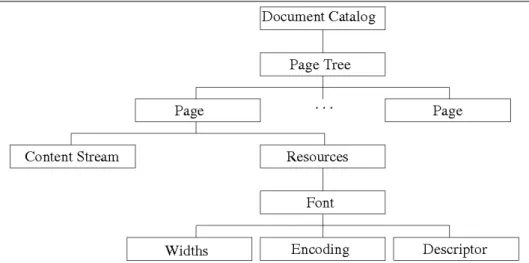
4.3 Internal structure of a PDF file . . . 39
5.1 PDF character and glyph relationships . . . 50
6.1 Coordinates of a symbol S . . . 53
6.2 Description of a Leaf rule . . . 55
6.3 Description of a Linearise rule . . . 56
6.4 Description of a Superscript rule . . . 57
6.5 Description of a Subscript rule . . . 58
6.6 Description of a Super-subscript rule . . . 59
6.7 Description of a Fraction rule . . . 60
6.8 Description of a Limits rule . . . 61
6.10 Description of a Under rule . . . 63
6.11 Description of a Root rule . . . 64
6.12 Description of a Multiline rule . . . 65
6.13 Description of a Case rule . . . 66
6.14 Description of a Matrix Element rule . . . 67
6.15 Description of a Matrix Row rule . . . 68
6.16 Description of a Matrix rule . . . 69
7.1 Reconstruction of page 317 from [Ste05]. Original page on the left and rendered LATEX output on the right. . . 90
8.1 Formulae from [Ste03]. Left column contains rendered images from the PDF, right column contains the formatted LATEX output of the generated results . . . 97
8.2 Sample generated LATEX code for first equation in Figure 8.1 . . . 98
8.3 Some of the incorrectly recognised formulae; original rendered image on the left, formatted LATEXoutput of the generated results on the right. . . . 98
8.4 Some of the correctly recognised formulae; original rendered image on the left, formatted LATEX output of the generated results on the right. . . 104
8.5 Two examples; original image above, formatted generated LATEX output below. . . 105
LIST OF TABLES
3.1 A list of features of formulae . . . 20
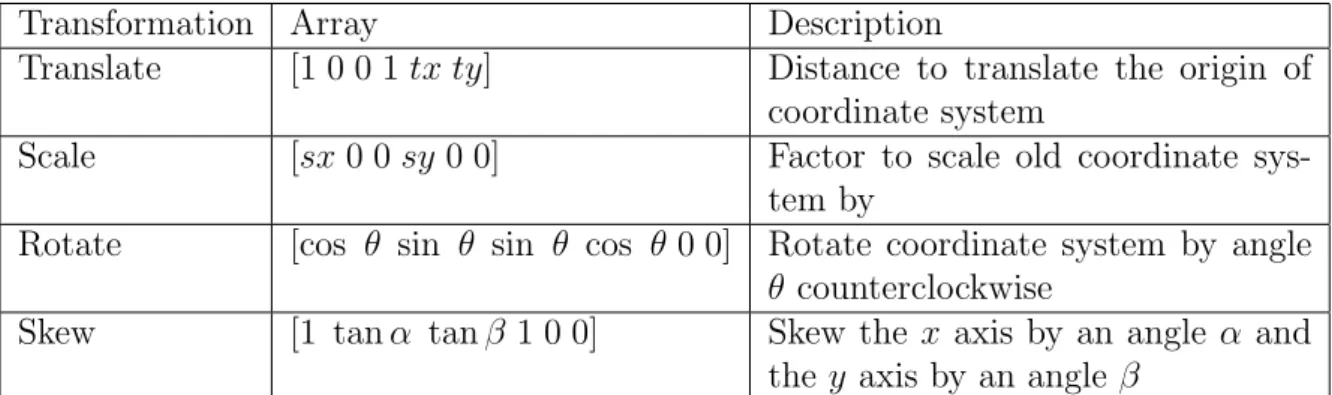
4.1 Transformation matrix operations . . . 40
4.2 Text state parameters and operators . . . 41
4.3 Text positioning operators . . . 41
4.4 Text showing operators . . . 41
4.5 Path construction operators . . . 42
7.1 Spacing between math objects in LATEX . . . 85
8.1 Infty character recognition results . . . 108
8.2 Maxtract character recognition results . . . 109
8.3 Formula recognition rate with respect to 628 expressions within the ground truth set . . . 109
8.4 Classification of minor differences between the systems’ output and ground truth set . . . 110
CHAPTER 1
INTRODUCTION
In recent years, the PDF format has become widely accepted as a quasi-standard for document presentation and exchange, and together with the exponential growth of the internet, users now have access to a very large number of documents. Whilst information is usually easily attainable through search engines such as Google, or specialised services like IEEE Xplore, mathematical notation is far more difficult to access. Due to the lack of a widely used standard, mathematics is often stored in a myriad of ways, including LATEX,
MathML, OpenMath, plain text and even images. This makes indexing of mathematics extremely difficult, meaning that search engines have to rely on keywords and surrounding text instead of the notation itself. Furthermore, even when mathematics has been located, its compatibility with other software is extremely limited. In general formulae can not be copied and pasted, read aloud by screen readers, or even selected. This is not just an annoyance, but can result in completely inaccessible documents for visually impaired users.
Thus making such documents accessible is a major challenge and many attempts have been made to accurately recognise and analyse scientific material. However, the majority of approaches rely on optical character recognition, which generally performs poorly when used over mathematics. Optical Character Recognition (OCR) is also usually used on natively digital files, such as PDF and PostScript, losing the information often contained within them, that can aid the analysis and recognition of mathematical documents.
Within this thesis we demonstrate an alternative to the traditional OCR based ap-proach, that of extracting data from PDF files directly and combining it with image analysis to produce precise character information. We propose methods for using this information in conjunction with segmentation and layout analysis techniques, together with a new grammar we have developed for parsing mathematical formulae, allowing the analysis of mathematical documents.
Finally we present an evaluation of our implementation of this work, Maxtract, with both a qualitative and quantitative evaluation and a comparison to a leading document analysis system.
1.1
Hypotheses
The aim of this thesis is to address the following two hypotheses;
• Analysis of PDF files for the purposes of document analysis and mathematical for-mula recognition will yield more accurate and in depth information than can be achieved through OCR.
• When used in conjunction with output from PDF analysis, a linear grammar can be used to accurately recognise and reproduce mathematical formulae to a higher standard than contemporary approaches.
1.2
Contributions
A summary of the contributions of this thesis is as follows;
1. We describe a novel approach to combine the results of PDF and image analysis, in order to extract precise character information from natively digital documents that is sufficient for accurate text, layout and formula analysis.
2. We describe a grammar that takes advantage of the precise input, and produces a linearised structure string, along with an efficient procedural implementation. We also describe versatile drivers that parse the string and can produce different output such as LATEX, MathML and Festival.
3. We show how the font and spacing information extracted from PDF documents can be exploited further, in order to aid both semantic, layout and full document analysis.
1.3
Publications
This thesis is based partly upon the following conference and workshop publications;
• Josef B. Baker, Alan P. Sexton and Volker Sorge “Extracting Precise Data on the Mathematical Content of PDF Documents”, Towards a Digital Mathematics Library 2008 [BSS08b]
• Josef B. Baker, Alan P. Sexton and Volker Sorge “Extracting Precise Data from PDF Documents for Mathematical Formula Recognition”, Document Analysis Systems 2008 [BSS08a]
• Josef B. Baker, Alan P. Sexton and Volker Sorge “A Linear Grammar Approach to Mathematical Formula Recognition from PDF”, Mathematical Knowledge Manage-ment 2009 [BSS09a] (Best Paper Award)
• Josef B. Baker, Alan P. Sexton and Volker Sorge “An Online Repository of Mathe-matical Samples”, Towards a Digital Mathematics Library 2009 [BSS09b]
• Josef B. Baker, Alan P. Sexton and Volker Sorge “Using Fonts Within PDF Files to Improve Formula Recognition”, Workshop for E-Inclusion in Mathematics 2009 [BSS09c]
• Josef B. Baker, Alan P. Sexton and Volker Sorge “Faithful Mathematical Formula Recognition from PDF Documents”, Document Analysis Systems 2010 [BSS10]
• Josef Baker, Alan Sexton and Volker Sorge “Towards Reverse Engineering of PDF”, Towards a Digital Mathematics Library 2011 [BSS11]
• Josef Baker, Alan Sexton, Volker Sorge and Masakazu Suzuki “Comparing Ap-proaches to Mathematical Document Analysis from PDF”, International Conference on Document Analysis and Recognition 2011 [BSSS11]
And a report for The European Digital Mathematics Library
• Petr Sojka, Josef Baker, Alan Sexton, and Volker Sorge. A State of the Art Report on Augmenting Metadata Techniques and Technology, November 2010. Deliverable D7.1 of EU CIP-ICT-PSP project 250503 EuDML: The European Digital Mathe-matics Library, http://eudml.eu/ [SBSS10]
1.4
Overview of Thesis
Part I is an overview of the techniques, algorithms and research related to the work in this thesis. In particular; Chapter 2 is a review of the traditional approach to the recognition and analysis of plain text, that of OCR over a scanned document. Chapter 3 looks at the difficulty of extending these techniques to documents containing mathematics and the additional methods required to identify and parse mathematical formulae. Finally, Chapter 4 presents alternatives to OCR-based document analysis when dealing with elec-tronic documents. The tools available and current research for extraction and analysis is compared, together with an overview of the Adobe PDF format.
Part II presents and evaluates our approach to mathematical document analysis from PDF documents. Chapter 5 details an algorithm for the extraction of PDF content and describes how to combine these results with image analysis to produce a list of each symbol appearing on a given page, with its precise coordinates, dimensions, names and typeface. Chapter 6 presents the basic grammar we have developed for the analysis of mathematical formulae, along with a procedural implementation of the grammar and the
drivers necessary for generating various output. Chapter 7 details the extensions to the grammar and subsequent improvements including automatic formula segmentation and layout analysis. An evaluation of the work presented in Chapters 5 – 7 is completed in Chapter 8, including both a qualitative and quantitative evaluation of each stage of development and a comparison to another mathematical document analysis system.
Finally, Part III is the conclusions, with Chapter 9 showing the contributions of this thesis and Chapter 10 looking at how the work can be improved and extended.
Part I
CHAPTER 2
TRADITIONAL TEXT RECOGNITION
Many commercial and open source software systems are available for the tasks of optical character recognition, OCR, and the identification of objects such as words and lines of text [Abb, HP, Suz, Bre, Nua]. Whilst the top performing systems can produce recognition rates of over 99.9%, this is only over ideal documents, typically, those consisting of plain text in a standard, common font with minimal noise and broken lines and well scanned at a resolution of at least 300 dots per inch [Eik93, FT96].
Rice et al. [RNN99], identify four areas which cause difficulty for OCR software:
• Imaging defects including noise, broken lines and warp
• Similar symbols such as i, l and 1 or o, O and 0
• Unusual symbols including punctuation, mathematical operators and non Latin symbols
• Typography with varying sizes, styles, fonts and baselines
Historic, handwritten, mathematical and unusually formatted documents exhibit char-acteristics of most, if not all, of the areas listed above, as will poorly scanned images and those at a low resolution. In such cases, recognition rates can drop to a level where it is more efficient to manually process documents [BF94].
This chapter will describe and review some of the techniques used for the recognition of text, with Section 2.1 being an introduction to OCR. Section 2.2 is concerned with
image segmentation and Section 2.3 at how glyphs are classified into characters. Finally Section 2.4 looks at the methods available for verifying and correcting the results.
2.1
Optical Character Recognition
Optical character recognition, is a technique used to identify glyphs composing characters within images, with the aim of producing the corresponding electronic encoding, usually in ASCII or Unicode. It is commonly combined with further analytical techniques to identify words, headings, formulae, tables and other structural elements within a page or document. OCR is typically used on two types of image; those obtained by scanning or photographing printed or hand written text and those which have been converted to an image from an original digital source such as a PDF or PostScript file. These are known as retro-digitised and natively digital documents respectively.
There are five main steps involved in OCR [HB97, Eik93]:
1. Image acquisition, in which either a paper document is scanned or photographed, or an electronic document is converted into an image
2. Image transformation, where skew, warp and noise are removed, followed by blur-ring, sharpening and binarisation of the image
3. Segmentation, where the image is divided into components such as its constituent glyphs
4. Character recognition, where connected components are classified by the features extracted from them
5. Grouping and error correction, where characters are grouped into words and error checking is completed
One of the aims of this thesis is to present new and alternative methods for the segmentation and recognition of mathematical texts, thus techniques for character
recog-nition and segmentation will be described and evaluated through the remainder of this section. However, image capture and transformation techniques are beyond the scope of the review.
2.2
Segmentation
Segmentation is the process of dividing a page into regions of similar objects and their atomic components and commonly include identifying columns, lines of texts and glyphs. This process usually begins with connected component labelling [RP66], in which every group of connected black pixels is given a unique label. If no touching characters or broken lines exist in the image, then each component represents a glyph, such as the shape forming the letter h, the dot or the stroke of a letter i, or the ligature fi. A noisy image, or one containing broken lines would result in too many glyphs being identified; conversely, touching characters would result in too few glyphs.
2.2.1
Projection Profile Cutting
X-Y tree decomposition [NS84, NSV92], otherwise known as Projection Profile Cutting (PPC), has the advantage of not only identifying connected components, but also obtain-ing the structural layout of an image. This technique is described in detail here as it forms the basis of layout analysis presented later in this thesis in Chapter 8.
PPC works by recursively separating the image via horizontal and vertical projections. In the first step, all pixels are projected on to the vertical axis, with cuts made between bands of black pixels. A similar process is then completed for each band, but with the pixels projected on to the horizontal axis instead. These steps are repeated until no more cuts can be made on either axis. In a standard page of single column text, the bands of black pixels initially found would signify lines of text, with the next cuts finding the horizontal spaces between characters. Projection based techniques work well for modern, printed, plain text, however warped and skewed images would cause this technique to fail,
as may unusual layouts, enclosed text or when tables and figures are encountered. [O’G93] These two methods can be combined by first identifying the connected components, then automatically computing cuts as an alternative to processing individual pixels. This has the advantage of not only being faster, but being able to overcome the inherent prob-lem with projection profile cutting, that of overlapping characters. By using information already obtained about glyphs, Raja et al. [RRSS06] were able to compute cuts even when glyphs were fully enclosed by others. This was particularly important as their work with mathematical documents contained many of these cases, such as square roots, boxes and parenthesis.
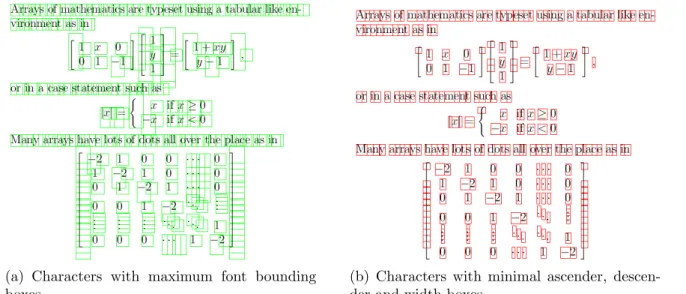
(a) Horizontal projection on a block of text
(b) Vertical projection on first line
(c) Second horizontal projection on symbols from first line
(d) Vertical projection on fourth line
(e) Vertical projection after removal of root
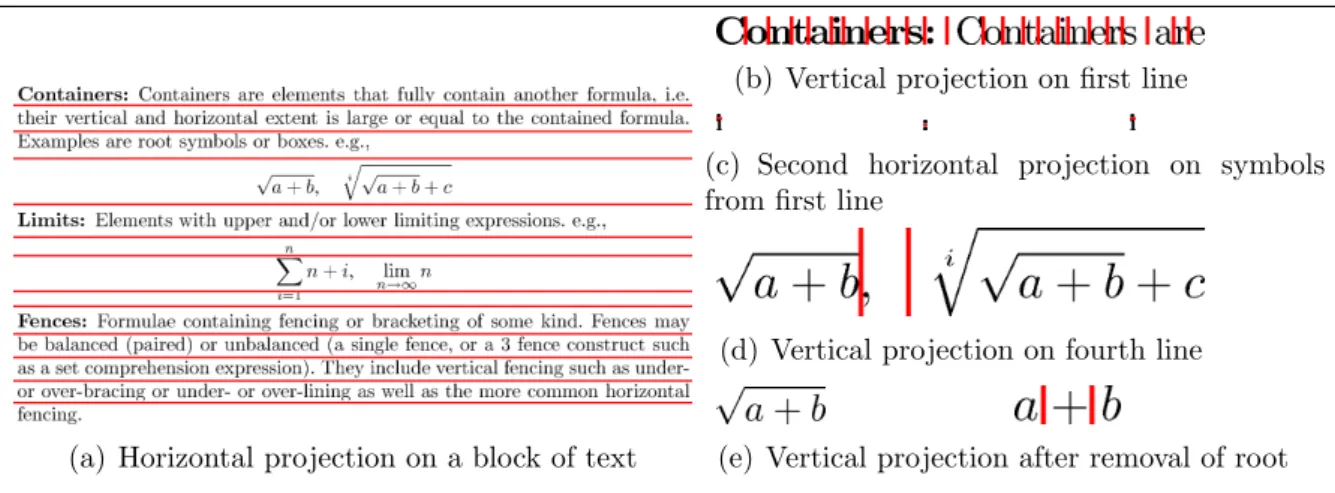
Figure 2.1: Stages of projection profile cutting over a section of text
Figure 2.1 shows an example of projection profile cutting being used over a page of text, with cuts indicated by red lines. In 2.1(a), cuts are made when unbroken horizontal whitespace is encountered, thus in this example each cut represents a break between lines of text. In 2.1(b) cuts are made when unbroken vertical whitespace is encountered, or the spaces between individual symbols. As projection profile cutting continues until no further cuts can be made, the symbols i and : are horizontally cut again, into their constituent glyphs as shown in 2.1(c).
The fourth line is cut vertically in 2.1(d), but no further cuts can be made due to the root symbols enclosing others. This can be solved by using prior knowledge about the type of symbols, removing the outer layer to complete further cuts as in 2.1(e).
2.2.2
Whitespace Analysis
Breuel presents an algorithm for finding maximal areas of whitespace, based upon recur-sively splitting an area until rectangles free of any obstacles are found [Bre02]. Obstacles are defined by the user and do not have to be connected components, indeed they maybe individual symbols, words or even blocks of text. Further analysis of the empty rectangles can then be used to determine structures such as columns, paragraphs and lines.
(a) Original page (b) Dividing page about B
(c) Dividing area about E
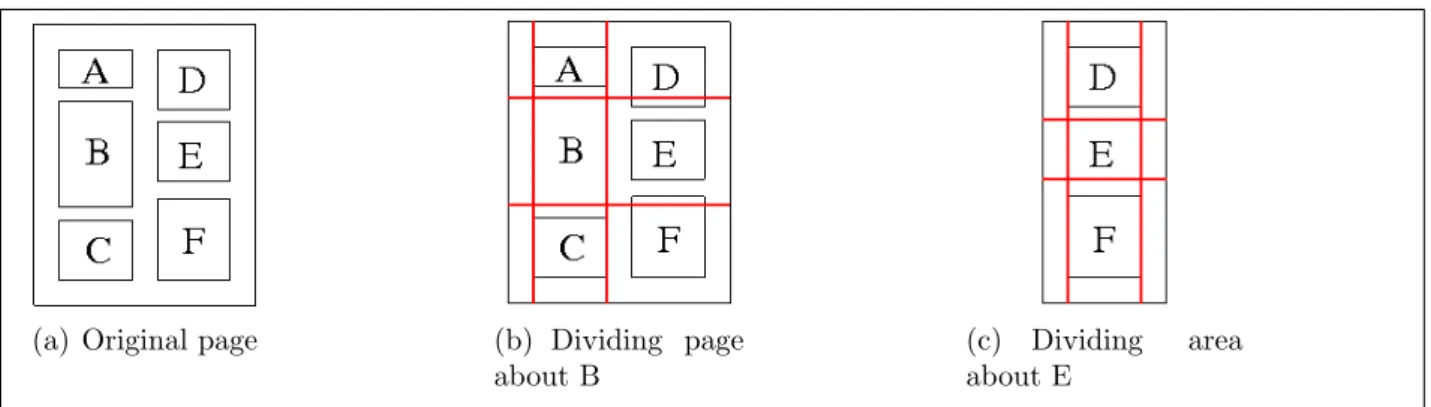
Figure 2.2: Identifying whitespace rectangles
Figure 2.2 is an example of this algorithm over six obstacles, A–F, on a page. Initially an obstacle near the middle of the page is chosen, B, and from this the page is divided into four rectangles; to its left, which is empty, right, which contains D, E and F, above, which contains A and D and below which contains C and F. Each rectangle is placed into a priority queue with the largest rectangle having the highest priority, the process is then recursively applied to the head of the queue. When an empty rectangle is at the head, then the largest area of whitespace has been found. This is removed from the queue and the algorithm continues until the desired number of rectangles are found, which are returned in decreasing size order.
In this example the largest empty rectangles are the two margins and the central column separator. The first is found as the left area in 2.2(b) and the others are the left and right areas in 2.2(c). The next largest areas are the top and bottom margins, followed by the vertical space between each obstacle.
gutters and separators, finding lines within these columns, identifying the vertical layout structure and determining the reading order of the page.
Separators are identified by having an aspect ratio of at least 1:3, a width of at least 1.5 times the average space between words and adjacent to words on both their right and left hand side. If available, prior knowledge about the width of columns may also be used. The vertical layout structure is determined based upon the relationship, such as indentation, size and spacing, and content, font, size and style of adjacent text lines. Finally, the reading order of the page is determined through the use of both geometric and linguistic information.
Over a set of 221 documents, given the words as obstacles this method achieved perfect results, segmenting correctly every column and line.
2.3
Recognition
In the recognition phase, the aim is to classify the extracted glyphs or groups of glyphs. Depending on the system and its requirements, a class may include all representations of a symbol in different fonts, styles and sizes, so that: a, a, a and a would all be classified
as the same, or subdivided by typeface.
The classification is completed by extracting a number of features from the glyphs and comparing these to the features of a ground truth set of symbols. The classes in the ground truth, instead of having a single perfect example which may only rarely be encountered in real life, will usually contain a number of different instances of the same character, such as those with different typefaces, orientations and sizes [Das90]. From these an average or representative model can be determined. Instances of the same character may occur in different classes when they significantly vary, such as ‘a’ and ‘a’. After initial training, the ground truth set can be extended and improved by including the recognition results and can also be subject to manual correction when misrecognition occurs or new classes of symbols are encountered [STF+03].
Features that are commonly extracted include the aspect ratio, perimeter, percentage of black pixels, projections of black pixels, number of holes, relative positions of pixels and the distances of the centre of gravity from boundaries [HB97, TJT96]. Images are often broken into a number of sections, say a 3×3 grid, with features analysed and compared within each block. After the features of the extracted components and the model symbols are compared, a list of weighted candidate characters is created for further analysis such as correction and parsing.
When characters are touching and their composite glyphs have not been segmented, a further problem is introduced. This is particularly common in handwritten, historical and mathematical documents. Wang et al. [WGS00] approached this problem by increasing the number of classes to include both pairs of digits, an additional 10∗10 classes, and pairs of characters, an additional 26∗26 classes. By using this method they avoided the introduction of additional artifacts which are produced when segmenting touching glyphs. Whilst this produced a promising initial recognition rate of approximately 87% for touching characters in standard text, they lacked sufficient training data for all classes. The method also failed when presented with non-standard text such as mathematics, due to the far greater number of initial classes.
Lee and Kim [LK99] also attempted to overcome the problems of touching characters, specifically those found within handwritten documents. After the extraction of connected components, in this case often a whole word, slant correction is used in order to remove the inherent slant often found within handwriting. A horizontally sliding window is then passed over the block of symbols, with a neural network used to attempt classification whenever a complete symbol was centred within the window.
2.4
Post Processing and Correction
The final stage of OCR is when individual characters are grouped together into words, then validated and corrected by comparing the results to a dictionary or valid sequences
of characters [RH74, Dam64, TE96]. This technique identifiesnon-word errors including; unusual sequences of characters, interspersed alpha and numeric symbols and words absent from a dictionary.
When such errors are identified, alternative character combinations are tried, using the different candidate characters from the OCR software until a valid word is found. This method is good at identifying errors caused by the misrecognition of similarly shaped characters such as; 1, l, I and i, and when characters have been incorrectly segmented such as the letters l and o touching, then being recognised as a b.
The dictionaries used are not only language specific, but are tailored for different types of document. For example when dealing with historical documents, many modern words would be removed from the dictionary, with archaic or now obsolete words added. The size of a dictionary is an important consideration, if it is too large then it will be slower, less efficient and may causereal word errors where the string exists in the dictionary but is different to the original word [TE96].
Another method used for correction is clustering [STF+03]. After recognition, all
symbols are divided into independent sets according to their shapes, with a representative symbol, or centroid, elected. These sets not only represent symbols such as x, P
or 3, but also their typeface, so that A, A and A would all be separate. When the variance of a cluster exceeds a threshold, it is split, likewise clusters sharing characteristics are merged. The advantage of this stage is that any errors identified are used to correct a whole cluster, rather than individual characters, removing the necessity to re-run OCR software or re-analyse results when common errors are found. A further advantage is the reduction in effort required to manually correct recognition results, as a user can analyse a cluster of similar shapes instead of strings of different characters [Suz].
CHAPTER 3
MATHEMATICAL FORMULA ANALYSIS
The recognition of mathematical formulae shares the same basic process as the recognition of text; character recognition, segmentation and structural analysis. However there are significant additional problems in the analysis of mathematics over plain text which are caused by;
• A much larger character set many of whose members are visually similar
• 2 dimensional layout of symbols rather than a series of linear relationships
• Wide variance in fonts and styles, conveying semantic differences
This means the techniques used for traditional text analysis, as described in the previ-ous chapter, are not suitable alone for the recognition and analysis of mathematics. This chapter, in Sections 3.1 and 3.2, will show how OCR and layout analysis techniques can be adapted for mathematics, and in Section 3.3 the additional processes required for the accurate recognition and analysis of mathematical formulae.
3.1
Mathematical Optical Character Recognition
Traditional OCR software generally performs very badly with mathematical and scien-tific texts. The main causes of this are that heuristics for text in straight lines do not transfer well into two dimensional structures and the character sets used in mathematicsare typically much larger, containing many visually similar characters. Also, the use of large lexicons, which are common in OCR is not applicable to mathematics, therefore the formula parsing algorithms are also used to correct recognition results. This can be very computationally expensive, resulting in recognition speeds far slower than for stan-dard text. Finally, subtle differences in typefaces may change the meaning of symbols in mathematics, far more so than in regular text, thus detecting these changes is also an ad-ditional, difficult problem [SKOY04]. In experimentation, Kanahori & Suzuki stated that the character recognition error rate of Infty, a specialist mathematical document analysis system, dropped from 99.8% for regular text to 96.5% for mathematics [KS06]. Research in the area of mathematical OCR has consisted of constructing dedicated mathematical recognition software, hybrids of commercial or open source OCR software with specific math recognition tools and the creation of databases of mathematical symbols.
3.1.1
Specific Mathematical OCR
Fateman et al. [BF94, FT96, FTBM96] initially experimented with mathematical formula recognition based upon the use of standard OCR software for character recognition. How-ever, they found that recognition rates of well over 99% for standard text dramatically reduced to just 10% when presented with well typeset, two dimensional equations. An example that they noted was the mathematical function log was recognised when in a line of text, but not when appearing in the denominator of an equation. Another problem they found was that most software only produced omnifont results, thus not recognising different fonts, styles and sizes – all of which are important when parsing mathematics. As a result of this they designed and created specific mathematical character-recognition software.
Initially they gathered a large set of samples of mathematical texts that were used for training the system. After scanning, all connected components were extracted and clustered with other objects sharing similar characteristics. These clusters were then manually corrected and if necessary split or merged and objects moved to the appropriate
cluster. Each group was then given a label, such as italic P, 10 point, and a model representation was generated, essentially an average of the whole group.
The character recogniser, when presented with a scanned image containing math-ematics, would attempt to match each connected component with a model from this training set. This was completed by choosing the model with the lowest Hausdorff dis-tance [HKKR93] to each object. They made use of heuristics based upon the size of the object in order to decrease the number of models to which it had to be compared to, greatly improving the efficiency of the system.
All objects that were not recognised at this stage could be classified into three distinct groups; those that were over connected, or touching, those that were disconnected or contained broken lines and any others. As the Hausdorff distance between two images is directed, their solution to identifying over connected and disconnected characters was to find the distance from the object to the model instead of the opposite way as before. Anything not identified by this stage was treated as unrecognisable and flagged for manual intervention.
3.1.2
Hybrid Recognition
Suzuki et al. [STF+03] take a different approach to the recognition of mathematical
character recognition. Connected components comprising the page are initially extracted, then a commercial OCR engine is used, which usually produces high quality recognition for ordinary text. However when mathematics is encountered, the engine will often fail, producing meaningless strings as a result, these are marked for further recognition. The results of the OCR are then verified by comparing the positions and sizes of the recognised components with those initially extracted. An example they use to show this is when x2
is misrecognised as at, which is particularly common due to the use of lexicons. During verification, the size difference between a and x together with the difference in position of the t and 2 is used to determine that a mistake has occurred.
(a) Touching x, 2 and candidate 2 (b) Residual top left (c) Residual bottom left (d) Residual bottom right (e) Residual top right
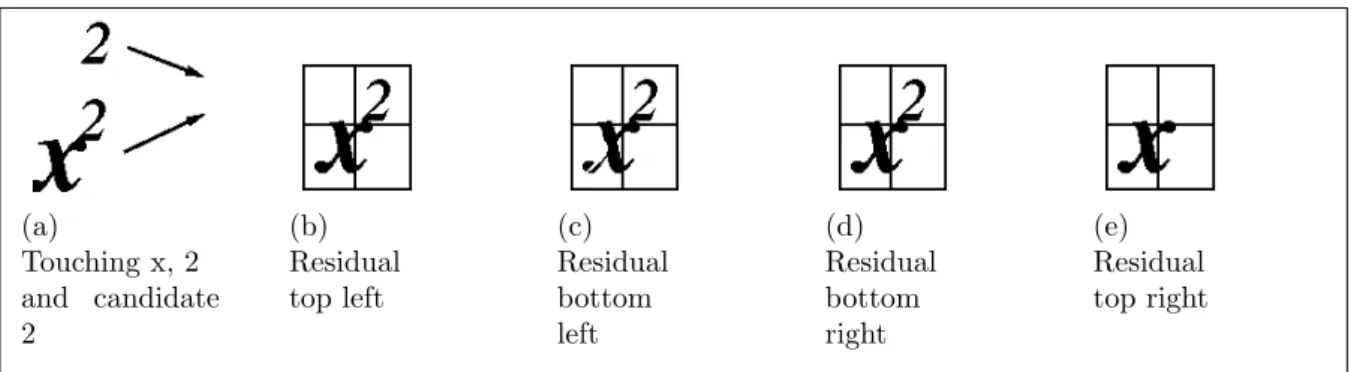
Figure 3.1: Touching character detection in Infty
engine is used. Features such as aspect ratios and crossing features are extracted and compared to reference symbols, to perform the initial classification. In the second step 36 dimension-directional features are used to select at least five candidate categories. The final step uses two additional 64 dimensional features, which are unified by voting in order to select several appropriate candidates. The final selection takes place during structural analysis of the mathematical expression.
To detect touching characters they analyse the aspect ratios and peripheral features of the recognised characters and compare them to the models. If the difference is larger than a set threshold then it is treated as a touching character. In order to recognise the composite characters, they begin by XORing models over the four corners of the image, as shown in Figure 3.1, where anx and its superscript 2 are touching. In 3.1(e), no residual image remains in the top right hand corner when the model 2 is placed there, so it is treated as a match. This results in a simple standard matching exercise to classify the remaining x.
3.1.3
Database Driven Recognition
Sexton and Sorge [SS05, SS06] developed a database-driven recognition system for mathe-matics. The database contains approximately 5300 standard and mathematical characters freely available in LATEX in 8 different point sizes. For each character in the database, 61
features are also computed.
the corresponding feature vector is calculated. This is then compared to those in the database, from which a list of best matches is found. The recognition was based upon the metric distances between the components and templates, found by the application of geometric moments to the decomposed glyphs. The list is retained so that higher level semantic analysis can be used to choose a candidate also based upon context.
Whilst they said initial experimentation results were promising the speed of the system was a limiting factor, around 10 minutes per page, and was subject to overtraining on LATEX fonts.
3.2
Math Segmentation
Many formula recognition systems do not specify how mathematics is segmented from the main body of text, thus they work on the assumption that input is either an area or a set of symbols comprised of mathematics [OM92]. The simplest, but least efficient method for this is manual segmentation, in which a user identifies particular areas of interest to be analysed. However, due to the time required for the manual clipping of formulae, this is unsuitable for the large scale analysis of mathematical documents. Section 3.2.1 will look at different ways of automatically identifying areas of mathematics based upon statistical analysis and heuristics, and Section 3.2.2 will look at OCR based segmentation techniques.
3.2.1
Statistical Analysis and Heuristics
Lin et al [LGT+11] completed an analysis over a large, but unspecified number, of PDF documents to identify key features for the location of both embedded and isolated formu-lae. Geometric features are generally used for the detection of isolated formulae, context features for embedded formulae and character features for both. These are shown in Table 3.1.
Name Definition
Geometric layout features
AlignCenter The relative distance of the lines horizontal center and the page body horizontal center
V-Width The variation between two lines widths V-Height A lines height
V-Space The space between two successive lines
Sparse-Ratio The ratio of the characters area of the lines area V-FontSize The variance of the font size
SerialNumber Whether there is a formula serial number in the end of the line
Character features Italic Whether the character is in italic
MathFunction The named math functions (sin, cos, etc.), defined in the math function dictionary
MathSymbol Categorized into: relations, operators, Greek letters, de-limiters, special symbols
Context features
Relationship Whether the preceding/following character is a formula element
Domain Describe operand domains of particular math symbols such as the integral symbol
Table 3.1: A list of features of formulae, taken from [LGT+11]
identify isolated formulae. This starts by ruling out any non-formulae lines, which are those without any of the character features described in the table. Subsequently, the geometric features are applied to each line and summed to give a score. Any line with a score above a threshold is labelled as an isolated formula.
For embedded formulae, character features are used to identify any isolated math symbols, again using a scoring system. Thereafter context features are used to expand these symbols into larger areas containing embedded formulae.
For isolated formulae, they reported a success rate of 90.6%, improving to 96.14% by combining the technique with a machine learning approach using a support vector machine trained on a ground truth set. For embedded formulae they reported a success rate of 83.61% [CL].
Chaudhuri and Garain [CG99] completed a statistical survey over more than 10000 documents, encountering over 11000 mathematical expressions of two distinct types, inline
or embedded and display or separate. The analysis of the survey produced features for identifying both types of expression. For display expressions, the two features identified were that it should be enclosed by wide white spacing and that the y-coordinates of the lower left pixel of each symbol in an expression line should be far more scattered than those of a text line.
To identify embedded expressions, they produced a list of 26 commonly occurring mathematical symbols and deduced that at least one of these would occur in any embedded expression. The list included such symbols as =,+,−,Σ and ∈. Every time one of these symbols occurred in a line, it was marked as containing an expression. To determine the extent of the expression, they found the first such symbol on each line, and then expanded the area to adjacent symbols, depending on what type of symbol it was, such as a binary operator and what other symbols were close by, such as numerals, ellipses and scripts.
In order to identify both inline and display mathematics from documents, after char-acter recognition has taken place, Fateman et al. [FT96, Fat99], suggest passing through the list of symbols a number of times, using heuristics to split the symbols into those representing text and those representing maths. Three passes are made over a document, each time moving symbols between amath bag and a text bag.
In the initial pass, all bold and italic text, mathematical symbols, numbers, brackets, dots and commas are put into the math bag, with everything else being classified as text, including unrecognised characters.
The second pass is performed over the math bag and aims to correct items that have been mistakenly classified as mathematics. The symbols are grouped together based on proximity, then any unmatched parenthesis, leading and trailing dots and commas and isolated 1s and 0s are moved to the text bag. The rule for isolated 1s and 0s is to compensate for recognition errors.
The third and final pass is over the text bag with the aim of moving incorrectly iden-tified text into the math bag. Essentially, isolated text surrounded by math and mathe-matical keywords such as sin, tan are moved from thetext bag into themath bag.
As the method is heavily reliant on the accurate recognition of all characters upon a page, it performed poorly upon low-quality and math-rich documents. However, it was adapted to work in conjunction with high quality input from PostScript analysis in later work [YF04].
3.2.2
OCR Based
Inoue et al. [IMS98] proposed a way to segment mathematics from text in Japanese articles, by using a novel method based upon the failure of OCR software. Any areas where the Japanese language specific OCR either failed or returned very low confidence results was treated as mathematics, in essence this meant any Latin and Greek symbols and math operators. A lexicon and grammar was used to help prevent any Kanji symbols being misrecognised as maths. Whilst this was a novel technique, it was limited to only working with languages that used a non-Latin based script and and made the assumption that anything written in different scripts was mathematics, which is obviously not always true.
This approach was heavily modified and extended by Suzuki et al. [STF+03] for use in the INFTY project [Suz], an integrated scientific document analysis system, and adapted to work for articles written in Latin scripts, mainly English. The approach was still based upon OCR software failing when presented with mathematics, however additional image analysis was incorporated to detect any misrecognition.
After scanning and initial image analysis, any large connected components are labelled as figures and tables. Then, as described in Section 3.1.2 the document is passed through commercial OCR software, which in conjunction with a large lexicon produces high qual-ity recognition results for all of the standard, i.e. non-mathematical text. Whenever meaningless string results are returned by the software, they are flagged as mathematics. The second stage of segmentation involves the results of the OCR being overlaid onto the original document. The bounding box position and size of each recognised character is compared with the original. If these values exceed a certain threshold, the characters
are also treated as mathematics. This method helps to identify in particular when there are changes in baseline, so it can identify expressions containing sub and superscripts that have been misrecognised as text.
On well-scanned, noise-free documents, this method offers very high segmentation results and, using corrected OCR, they obtained a recognition rate of 97.9% for the iden-tification and recognition of approximately 9600 mathematical formulae. However poor performance of the commercial OCR software, generally caused by low quality docu-ments severely impacts the ability to identify embedded formulae and the recognition rate dropped to 89.6% when used with uncorrected data.
3.3
Mathematical Formula Recognition
Mathematical formula recognition, MFR, is the process of taking a two dimensional array of symbols which form a mathematical formula and parsing them, based upon their types, sizes and positions, to produce a tree, graph, string or similar representation of the original formula. Depending upon the parsing methods and requirements, the analysis may simply return only the spatial structure of a formula, a partially semantic form such as LATEX or
Presentation MathML, or a full semantic representation in the form of Content MathML or OpenMath.
At this stage of processing it is assumed that character recognition and segmentation of mathematics has already taken place. Therefore a list of symbols, or lists of candidate characters with their respective coordinates is available for each formula.
The remainder of this chapter will review the various techniques for MFR including a structure based method in Section 3.3.1, graph based methods in Sections 3.3.2 and 3.3.3 and linear grammar methods in Section 3.3.4.
3.3.1
Projection Profile Cutting
Projection profile cutting has already been described in Section 2.2 as a method used as a preprocessing step before OCR on a scanned image. However, it has also been used to obtain the structural layout of a mathematical formula, by recursively separating components of a formula via horizontal and vertical projections in order to construct a parse tree [OM91, WF88].
Given a mathematical formula, PPC first performs a vertical projection of the pixels in the formula onto the x axis, in order to find white space that horizontally separates the components. The white space indicates the position where the formula can be cut vertically into components that are horizontally adjacent. Each of the discovered com-ponents is then, in turn, projected horizontally onto the y axis in order to separate its sub-components vertically. This procedure is repeated recursively until no further cuts can be performed. The remaining components are then considered to be atomic, though this does not necessarily mean that they are composed only of single glyphs.
The result of the PPC is a parse tree that represents the horizontal and vertical relationship between the atomic components. That is, the first level, given by the vertical cuts, represents parts of the formula that are horizontally adjacent; the second level, computed via horizontal cuts, represents the components that are vertically adjacent, etc.
Figure 3.2: An example of PPC on
n
P
i=1
As an example, the results of PPC for the simple formula
n
X
i=1
n+i
are given in figure 3.2. The first projection leads to vertical cuts that separate the expres-sion into the four components
n
P
i=1
, n, + and i. This corresponds to the first level of the resulting parse tree. Here,nand + are already atomic components and cannot be cut any further so become leaves of the tree. Note that even though the i is a single character it is comprised of two glyphs which are then cut again horizontally.
n
P
i=1
can now also be cut horizontally, with the cuts representing the limits and base of the summation becoming the second level of the tree. The lower limit is cut vertically then again horizontally into its atomic components and the PPC is complete. The resulting tree can then be walked to discover the structure of the original formula.
While in this example the parse tree is very small, PPC can easily scale to more complex expressions. Indeed PPC is a fast simple way to effectively perform more complex layout analysis of mathematical expressions [Zan00]. However, it has some significant drawbacks:
• As shown in the example, when characters are formed of more than one glyph, PPC will make additional cuts to separate them, which is undesirable as they have to be identified and reassembled at a later point.
• PPC may not identify super and sub-scripts, e.g. a2+ 4 may have the same parse
tree as a2 + 4, because the expression is reduced into its atomic components with just five vertical cuts. Therefore any formulae containing sub and superscripts will require additional processing.
• As demonstrated in Section 2.2, PPC in this state can not deal with enclosed char-acters. The most common example of this happens with square roots. In the case of
√
a = 2, neither a horizontal or vertical cut can separate the√and thea. Thus √a
• Poor quality images also cause significant problems, skew can alter horizontal and vertical relationships, touching characters can be recognised as atomic components and broken lines can lead to too many leaves.
Raja et al. [RRSS06] developed the PPC technique specifically to reassemble math-ematical formulae given prior knowledge of the symbols. This allows characters such as square roots to be removed when enclosing other symbols. It also prevents multi-glyph symbols such as = or i being split into their constituent glyphs.
3.3.2
Virtual Link Networks
Suzuki et al. [ES01, STF+03] use a virtual link network for formula recognition. This works by constructing a network of characters represented by vertices linked together by a number of directed, labelled edges with costs. Once this is complete, the tree with the lowest cost is returned. The technique has the added advantage of being able to correct recognition errors incorporated by OCR software.
Initially, the normalised size and centre of each character identified via OCR is calcu-lated. The relative positions of the centres of pairs of characters, together with their sizes are then analysed to determine possible spatial relationships.
The various relationships are then used to create a virtual link network. This is a network where each node represents at least one possible character, and each link shows the parent-child relationship between candidates for each node.
The OCR software used can return up to 10 different choices of character per node, each with a likeness value between 0, lowest match, and 100, highest. The top 5 matching characters will be used as a candidate for each node, providing the match value is over 50.
The different relationships that can exist between nodes are;
• Child is next character on the same line as Parent
• Child is in upper or under area of Parent (Fraction)
• Child is within a root symbol of Parent
• Child is under accent symbol of Parent
Costs are associated with each link, which increase the more that they disagree with the results of the initial structural analysis step. E.g. If the structural analysis step determined that two nodes were horizontal, a horizontal relationship would have a lower cost than a sub- or super-script relationship, also the cost of a link from a character with a low match value would be higher than a character with a high match value
A (c, x, Horizontal, 10) (C, χ,RSupScript, 50) (c, χ, Horizontal, 100) B (x,2, RSupScript, 10) (χ,2, RSupScript, 50) C (x, y,Horizontal, 10) (χ, y,Horizontal, 100) D (2,3, Horizontal, 10) E (y,3,RSupScript, 10) Figure 3.3: A virtual link network for cx2y3, taken from [ES01]
Admissible spanning trees are then searched for, and output if they have a total cost below a predetermined level. An admissible spanning tree has to meet the following 4 criteria.
1. Each node has a maximum of one child with the same label
2. Each node has a unique candidate chosen by the edges linked to it
3. The super- or sub-script sub-tree to the right of a node K are left of the horizontally adjacent child of K
4. The super- or sub-script sub-tree to the left of a node K are right of the horizontally adjacent parent of K
Once the list of admissible candidate trees is created, their costs are re-evaluated, adding penalties if certain conditions are met. These conditions are generally based around unusual relationships between nodes. Once this final step has been completed the tree with the lowest cost is returned.
Figure 3.3 shows the virtual link network created for cx2y3, together with a table
showing the possible links and costs between the nodes. Note that for three of the nodes, two different candidate characters are returned by the OCR software.
In a final verification stage, the trees are stored in CSV format for parsing via a context free tree grammar [FSU08, FSU10]. In order to achieve an acceptable parsing speed, a syntactic rather than semantic analysis is completed. A total of 39 fan-out rules for adjunct symbols, and 214 context-free rules, defining linear sequences of symbols and expressions, are in the grammar. The rule set can be increased in order to deal with different types of mathematics. In experimentation Suzuki et al. determined that the verification step identified and corrected approximately half of all remaining errors.
Whilst this a robust technique which is designed to cope with, and correct, errors returned by OCR software, it cannot cope when different characters have the same nor-malised size and shape, such as Ss, O0o and 1l. However, due to their different shapes SS and ll would be distinguished.
3.3.3
Graph Rewriting
Graph grammars have been widely used for diagram recognition in many different areas, including music notation, machine drawings and mathematical notation [DP88, FB93, GB95, LP98]. The general idea is to create a graph of connected nodes, and then use graph rewriting rules to replace sub-graphs with compressed nodes until only a single node remains.
Lavirotte & Pottier’s graph grammar technique uses information returned from the OCR software, such as bounding boxes, sizes, names and baselines of the characters within a formula, to build a graph [Lav97]. The graph consists of:
• Vertices: Each of which has a lexical type, such as operator, variable, digit, etc., its value and a unique identifier.
• Edges: Directed and weighted between pairs of vertices, representing the direction, such as top, or left, and the distance.
• Graph: The graph itself is connected, with at least one edge.
To build a graph, first, an attempt is made to link each symbol to another in 8 directions: top, bottom, left, right, top-left, bottom-left, top-right and bottom-right. Secondly context-sensitive rules for for each type of symbol are used to reduce the number of edges by removing any that are deemed to be illegal, such as the.inx.ybeing recognised as a subscript. Finally a concept of gravity is introduced, which determines the strength of links between symbols. For example, the 1 and + in 1+ would have a strong force between them but a weaker force in 1+, as the first case is statistically more likely to
occur.
Graph grammars are then used to parse the graph. In the same way as a standard grammar, the aim is to condense sub-graphs into single nodes, until just one remains containing the syntax tree of the formula. Context sensitive grammars are used, which helps to prevent ambiguities that may exist when multiple parsing rules are available.
Lavirotte notes that the grammars used are non-trivial and that heuristics are some-times required to remove ambiguities, also that the system needs to be adapted to incor-porate error detection and correction, as in real applications OCR is unable to recognise characters with 100% success [KRLP99]. Zanibbi comments that graph grammars are also very computationally expensive and that the approach taken by Lavirotte & Potier restricts the expressiveness of the grammar [Zan00].
3.3.4
Baseline Parsing and Coordinate Grammars
One of the most common techniques for parsing mathematics involves variations of stan-dard string and attribute grammars, with modified rules to deal with coordinates, types
of symbol and in particular their baselines.
Many have attempted to parse mathematical formula by identifying baselines within formulae [ZBC02, TF05, TWL08, Pro96]. The idea is to find the various baselines within a formula, using in the case of [Zan00, ZBC02] tree transformations to identify the major baseline and minor baselines. From these the structure of the formula can be deduced. Figure 3.4 shows an example of the different baselines found within a formula.
Figure 3.4: Multiple baselines of a mathematical formula from [Pro96]
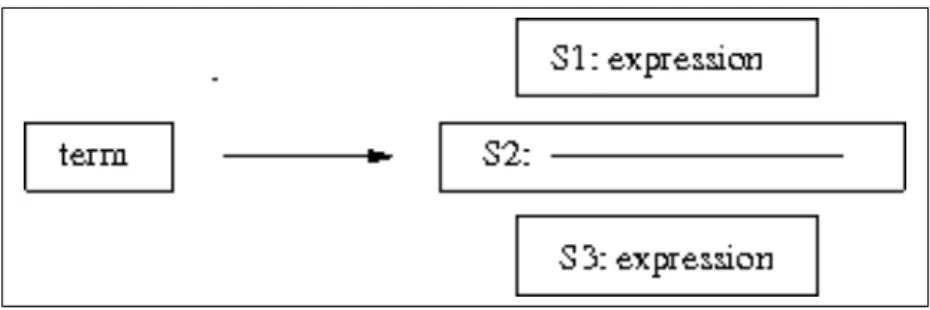
Anderson [And68] produced some of the earliest work in this area, which he called a coordinate grammar, and forms the basis of the approach described in Chapter 6. The input consists of a list of syntactic units, each of which has a value, e.g. a, 1, R, six coordinates: x and y minimum, maximum and centre, and a syntactic category. The parsing rules, when successful, combine these into single syntactic units recursively until the goal state is reached.
Figure 3.5: A graphical form of the division replacement rule from Anderson’s grammar
An example of one of these rules, for division, is shown in Figure 3.5. This is described as:
Given the goal “arithmetic term” and a set of characters, each with a set of coordinates, try to partition the set into three sub-sets: S1, S2 and S3, such that the following conditions hold:
1. S1 and S3 are expressions
3. S1 is above S2 and bounded by it in the x-direction item S3 is below S2 and bounded by it in the x-direction
If these tests are successful, assign a set of coordinates to the overall configura-tion, each of these being a function of S1, S2 and S3; report these coordinates along with success, else report failure.
A recursive descent parser is used, thus if more than one rule can be satisfied, the rules should be ordered and used successively for the further partitioning of characters, until all characters are partitioned successfully or failure is reported. Unfortunately, this was very computationally expensive and at the time could not cope with expressions containing more than 8 symbols [FT96].
Anderson also proposed an extremely efficient algorithm called Linearize which worked on a small subset of these rules. The method was based upon ordering the syntactic objects by theirx-coordinate, then processing them in the style of a string grammar. This produced a string, somewhat similar to a LATEX representation, which could be parsed by a
phase context grammar to perform a syntactic analysis of the formula. Unfortunately, this was extremely limited in its scope, and required very specific typesetting and placement of symbols.
Early research into these grammars, including Anderson’s, tended to be used solely to analyse formulae [FT96, FTBM96, Pro96]. However, they often make the assumption of perfect input as in the case of Anderson, and perform very poorly or even fail when pre-sented with real, noisy, OCR results [FT96, TUS06]. Therefore, they are often combined with other techniques and used for post processing parse trees in order to verify, identify errors and perform semantic analysis [TF05, TUS06, FT96].
Both top-down and bottom-up parsers can, and have been, used to implement such grammars. Anderson used a top-down parser, which was very computationally expensive, and Fateman used a bottom-up parser which was much faster— though it worked on a smaller subset of mathematics. Fateman proposed that a top-down approach would be far better to deal with more realistic, noisier input.
CHAPTER 4
DIGITAL FILE ANALYSIS AND EXTRACTION
Adobe’s Portable Document Format (PDF) has become the de facto standard for pub-lishing scientific electronic documents, from articles in conferences and journals to books and archive material. PDF is a rich format offering the ability to produce fully accessible and structured documents and whilst some of these files are only wrappers for images, a great deal of them contain, albeit in an obfuscated form, enough information for the ac-curate extraction of the symbols comprising a page. Being able to access this information removes one of the main barriers, that of OCR, in the analysis of mathematical formulae. Many tools exist that are able to extract some of this information, which are discussed in Section 4.1.1, however, they are insufficient for the accurate analysis of mathematics, or even text, thus many approaches to PDF analysis convert the file to an image first and process using traditional OCR techniques, losing all of the embedded information. However there is a growing body of research on the direct analysis of PDF files for text extraction, layout analysis and formula recognition which are discussed in Section 4.2
PDF is not the only format for the electronic publication of scientific articles, there are many PostScript files, PDF’s predecessor, available and techniques for the automated analysis of such files is also addressed in Section 4.1. Extraction from formats where mathematics is represented as images, for example HTML, is not covered as this is es-sentially an OCR problem, nor where the formulae is in a format such as MathML, or Microsoft Equation Editor files, because the mathematics is then already structured.
The final part of this chapter, Section 4.3 takes a closer look at the internal structure and specification of PDF, focusing on the commands and instructions that need to be processed in order to extract characters and their positions from a file.
4.1
Character Extraction from Postscript
By redefining the PostScriptshow command Nevill-Manning et al. [NMRW98] were able to convert standard PostScript files into their plain text ASCII equivalent. After exper-imenting with large samples of documents, they were also able to develop heuristics to identify spacing between words, line breaks and paragraphs, which are not explicitly de-fined within PostScript. When comparing their system to its peers, some of which used OCR, they found it to be very fast and robust, allowing them to create full text indices of over forty thousand technical reports.
One of the main problems they encountered was the use of non-standard encodings used for characters not within ASCII, particularly common for mathematical symbols. They found that they were unable to develop an effective system for finding and keeping track of the changes in encoding, thus any characters without a standard encoding were flagged as unknown. Another issue they encountered was the number of heuristics that they were relying on and proposed that future work would use machine learning algorithms instead, in order to determine rule sets for different styles of documents.
An alternative to this, overcoming some of the encoding problems, was proposed by Yang and Fateman [YF04]. Using a modified version of a PostScript to text converter, which adapted the Ghostscript interpreter to output information about words and their bounding boxes, they were able to identify and extract not only ASCII characters, but also mathematical symbols, and in addition their respective typeface, size and location. When a document had been passed through the interpreter, a series of instructions were output, which were followed to produce a string of characters, along with their font and bounding box. Whilst this was generally a trivial task, certain characters had to be
identified through pattern matching groups of commands. This occurred when glyphs were constructed of multiple commands, common with square roots, integral signs and division lines.
Whilst the system appeared to have complete accuracy, it only worked with opti-mal PostScript files – those generated by LATEX and dvips, and containing the optional
fontname field. However, they stated that additional routines could be written in order to better process files from other sources. Also, whilst documents are still available in PostScript it is falling into disuse as an archival format and has been rapidly overtaken by PDF.
4.1.1
Character Extraction from PDF
There are a number of programming-language specific libraries and open and closed source PDF tools available [Phe, Ltd11, Bru09, Ste11, Fou10]. The functionality of these varies but they commonly have routines to extract characters and fonts from a given file, then reconstruct them into words which are output in reading order. Common PDF files however, whilst still valid, often have large amounts of optional information that is missing or incomplete. This may include character mapping and font names where type 3 fonts are used and structural information [PB03]. The differences in the amount of information contained in PDF files is demonstrated by Phelps & Wilensky, who stated that two PDF files which render identically may vary in size by up to 1000% [PW03].
Files with missing information can be displayed in a standard viewer but have sig-nificant issues when one tries to extract text. This can result in many problems for text-extraction software including; incorrectly formed words, missing or unreliably named symbols and fonts, and out of order, or even missing text. Tools have been designed to try and overcome these issues, but they still fail in many circumstances. These problems are noted in documentation accompanying the tools, for example CamlPDF state that text extraction is incomplete whilst Multivalent has a section about obtaining ‘garbage text’ when running the extractor. Despite problems with certain files, these tools can produce
excellent results in the correct circumstances and many have been used as part of more advanced PDF analysis software.
Within PDF documents, font information is often obfuscated within embedded exe-cutable font files and is thus generally unavailable, meaning that obtaining simple font metrics such as precise heights and widths of characters is not possible through standard analysis. Furthermore, customised font encodings are regularly created when non-ASCII symbols are used. Whilst this is a particular issue for scientific documents which make use of special symbols, it can also affect standard documents that have ligatures such as
fi and fl, which will often be missed when trying to copy them or to read them aloud. The encodings can be incomplete so are often ignored by PDF tools, resulting in incor-rect character identification as experienced by [LGT+11]. Furthermore, some symbols are actually created from multiple overlaid characters and lines, and to deduce what this actually represents requires further analysis.
Figure 4.1: A highlighted formula in a PDF file
These problems are highlighted in Figure 4.1 where a formula has been copied, with the result of pasting:
S 5 bearing no semblance to the original.
4.2
Layout Analysis and Segmentation
Trying to deduce the logical layout of a PDF file through following the often convoluted structure can be a very complex task [SF05]. Even though there are commands for setting the spacing between characters, words and lines and for specifying line breaks (described in section 4.3.1), they are very rarely used. Instead, absolute positioning commands are used and, due to kerning, single words are often split over several instructions and the position of line and column breaks has to be inferred through spatial analysis. Heuristics have been developed [YF04, NMRW98, HB07] to help identify these breaks, but for anything other than simple one column documents they often fail, as can be seen and heard when using PDF reader functions such as read out loud orsave as text.
Specialised PDF analysis in conjunction with open source PDF tools, the PDF API and whitespace analysis have been used for full text extraction and the identification of words, lines, paragraphs, tables and columns [LB95]. Hassan and Baumgartner worked with one of these libraries, PdfBox [Fou10] to perform intelligent text extraction on PDF documents [HB05]. By this they meant using the perfect extraction results from PDF together with a combination of top down and bottom up parsing to create a graph repre-senting the textual content of the file. Unfortunately this approach failed when presented with many scientific documents, especially those containing mathematical formulae and tables. Later work focused on improving the system to also analyse tables [HB07].
Yuan and Liu [YL05] also use a modified version of PdfBox, to extract and parse the text contained within a PDF file. The extracted text is processed to generate tags which are injected back into the file to aid searching. The focus was on identifying the title, author, address, abstract and keywords of each paper. By taking advantage of the additional font information and perfect character recognition, they were able to attain accuracy levels of up to 92.5%. This was achieved by experimenting with recent PDF files, those published within the past two years, which were also compatible with PdfBox. The conclusions of their work noted that more effort was required to modify the PDF parser and improve its compatibility to work with a wider range of files.
![Table 3.1: A list of features of formulae, taken from [LGT + 11]](https://thumb-us.123doks.com/thumbv2/123dok_us/9944007.2487243/31.892.180.759.121.622/table-list-features-formulae-taken-lgt.webp)