ABSTRACT
BROMFIELD LEE, DEBORAH CHRISTINA DEIRDRE. Development of Sensorial Experiments and their Implementation into Undergraduate Laboratories. (Under the direction of Maria T. Oliver-Hoyo).
“Visualization” of chemical phenomena often has been limited in the teaching laboratories to the sense of sight. We have developed chemistry experiments that rely on senses other than eyesight to investigate chemical concepts, make quantitative determinations, and familiarize students with chemical techniques traditionally designed using only eyesight. Multi-sensory learning can benefit all students by actively engaging them in learning through stimulation or an alternative way of experiencing a concept or ideas. Perception of events or concepts usually depends on the information from the different sensory systems combined. The use of multi-sensory learning can take advantage of all the senses to reinforce learning as each sense builds toward a more complete experience of scientific data. Research has shown that multi-sensory representations of scientific phenomena is a valuable tool for enhancing understanding of chemistry as well as displacing misconceptions through experience. Multi-sensory experiences have also been shown to enrich memory performance. There are few experiments published which utilize multiple senses in the teaching laboratory.
to aid implementation. All experiments are rigorously tested for accuracy and all chemicals examined for safety prior to implementation.
The pedagogical objectives were established of to provide the ability to develop and stimulate students’ conceptual understanding. The educational assessments of these experiments are are fashioned using the framework chosen (Marzano and Kendall). All the experiments are designed as collaborative, inquiry-based experiments in aims of enhancing the students understanding of the subject and promote critical thinking skills. These experiments use an investigative approach rather than verification methods. Terminology and misconceptions of the experiment were evaluated to prevent misunderstanding or confusion during the experiment. Interventions to address these misconceptions and learning problems associated with the experiment were developed. We have developed the Learning Lab Report, LLR, as an alternative model for the traditional laboratory reports, with the goal of transforming the traditional reports into something more useful for both students and instructors. The educational strategies are employed to develop this format in order to promote students to think critically about the concepts and take an active involvement in learning. From the results of the LLR, all experiments were reviewed and re-written to address any learning problems.
Development of Sensorial Experiments and their Implementation into
Undergraduate Laboratories
by
Deborah Christina Bromfield Lee
A dissertation submitted to the Graduate Faculty of
North Carolina State University
In partial fulfillment of the
Requirements for the degree of
Doctor of Philosophy
Chemistry
Raleigh, North Carolina
2009
APPROVED BY:
_______________________________ ______________________________
Dr.
Christopher
Gorman
Dr.
Melissa
Jones
________________________________
________________________________
Dr. Reza Ghiladi
Dr. Maria T. Oliver-Hoyo
DEDICATION
To the loves in my life and my inspiration, my dearest husband, my parents and siblings. Donjuma, Audré, Charles, Stephanie and Charles Jr.
BIOGRAPHY
Deborah Christina Bromfield was born to Audré and Charles Bromfield on June 19th, 1981
in Kingston, Jamaica. She was later blessed with a sister and brother, whom she would eventually grow to love dearly. Her parents worked hard to send the children to Hillel Acadamy. Deborah did well and even skipped the 5th grade, passing her Common Entrance examinations placing her in one
of the premier high school (7th grade, British school system) in the Caribbean. She began high school in 1992 at Immaculate Conception High. Deborah was always a shy but curious child, often investigating things that may not need investigation and once resulted in a broken arm. She had always loved science and wanted to be a pathologist. She loved and excelled in math, physics, religious studies and home economics, and later a new chemistry teacher and her mother’s high school friend sparked a passion for chemistry in Deborah. Several major surgeries and CXC exams later, she graduated in 1997, continuing on to the A’ levels (British post-secondary examination).
ACKNOWLEDGEMENTS
I would like to express my sincere gratitude to my advisor, Dr. Maria Oliver-Hoyo, for her guidance and mentorship. I am grateful for the opportunity to be under her direction, which has allowed me to learn not only the chemical education research methodologies but the ability to develop myself towards my academic goals. I am grateful for her support academically, financially and personally. Additionally, this work would not have been possible without her help in incorporating these experiments in the General and Organic chemistry laboratories.
I would like to thank my Drs. Christopher Gorman, Gail Jones James and Alexander Dieters for serving as my doctoral committee, their support and advice during my preliminary oral exams that helped to really provide direction on my project. I would like to express my appreciation to Dr. Reza Ghiladi for joining committee on short notice in order to schedule the oral defense. I would like to thank Dr. Maria Gallardo-Williams for incorporating the organic experiment into the laboratory schedule and her organic students who enthusiastically tested these procedures. Thank you to Drs. Daniel Comins and T. Brent Gunnoe (University of Virginia) for their generous loans of glassware for my experimentation. My sincere appreciation for Drs. Kay Sandberg and Kazi Rahman (Mount Olive College) for their suggestions and help on sections of this dissertation and Dr. Ana Lemes Silva (visiting scholar) for her contributions to the development of the LLR format.
I would like to thank my dear friends particularly my dear friends from ICHS and USF for their love, support and encouragement. My Grandparents Beryll & Beresford, Aunts Michelle & Hope, step-parents Canute and Pam, and rest of my family and surrogate family provided never-ending love, support and confidence in me and for this I am grateful. I would like to express my appreciation to Aunt Joan, although she was taken from us tragically, her passion for chemistry inspired me and her help with my high school chemistry was always appreciated!
TABLE OF CONTENTS
LIST OF TABLES ... viii
LIST OF FIGURES ... xiv
LIST OF SCHEMES ... xvi
LIST OF GRAPHS ... xvii
LIST OF EQUATIONS ... xviii
LIST OF ABBREVIATIONS ... xix
CHAPTER 1 . Overview & Proposal ... 1
1.1 Introduction ... 1
1.2 Literature Review ... 2
1.3 Sensory Process Overview ... 5
1.4 Sensory learning ... 26
1.5 Proposal ... 29
REFERENCES ... 31
CHAPTER 2 . Project overview ... 38
2.1 Chemical and pedagogical considerations ... 38
2.2 Educational framework, objectives and assessments ... 43
REFERENCES ... 67
CHAPTER 3 . The Sensorial Experiments ... 70
3.1 The Sensorial Experiments ... 70
3.2 Qualitative Organic Analysis Experiment ... 72
3.3 Esterification Kinetics Experiments ... 84
3.4 Equilibrium Experiments ... 103
3.5 Thermometric Titration Experiments ... 150
3.6 Olfactory Titration ... 191
REFERENCES ... 204
CHAPTER 4 . Conclusions and Future Work ... 217
4.1 Summary and Conclusions ... 217
4.2Sensory adaptations ... 224
APPENDICES ... 234
Appendix A . Publications ... 236
Appendix B . Qualitative Organic Analysis Experiment ... 244
Appendix C . Esterification Kinetics Experiment ... 264
Appendix D . Le Chatêlier’s and equilibrium study ... 277
Appendix E . Acetyl salicylic Acid Kinetics Experiment... 305
Appendix F . Thermometric Titrations ... 325
LIST OF TABLES
Table 1.1. Methods and types of analysis for studying the relationships in the perceptual
process. ... 7
Table 1.2. Sound intensities and dangerous exposure times. ... 13
Table 1.3. Degree of hearing loss and the decibel ranges. ... 14
Table 1.4. Channels and mechanoreceptive fibers associated with receptors. ... 15
Table 1.5. Two point threshold values for various areas on the body. ... 17
Table 1.6. Primary odorants and examples described by Amoore. ... 20
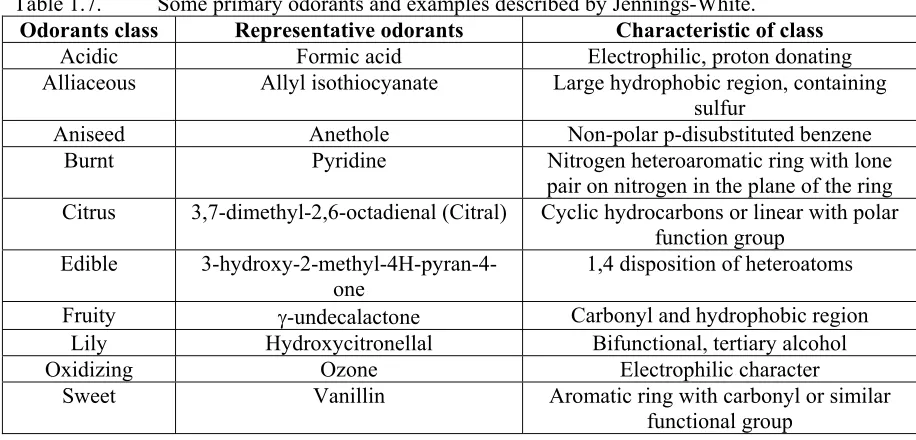
Table 1.7. Some primary odorants and examples described by Jennings-White. ... 22
Table 1.8. Comparison of the odor thresholds for some common chemicals. ... 24
Table 1.9. Examples of enantiomers showing differing aromas. ... 25
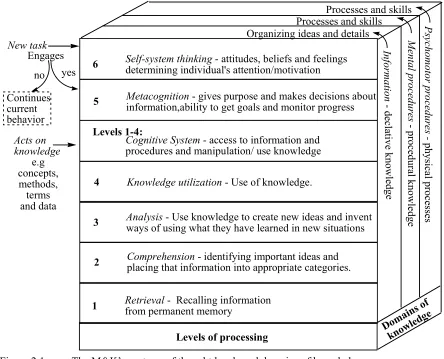
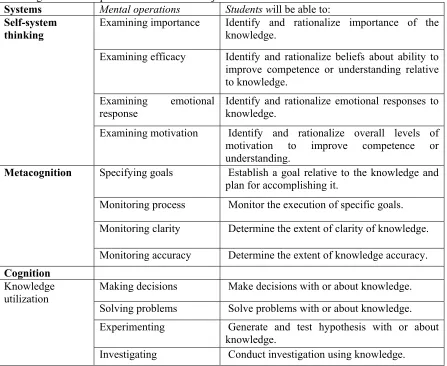
Table 2.1. Description of taxonomy levels of M&K and students’ mental operations relative to knowledge domains expressed as educational objectives. ... 46
Table 2.2. Example of mental operations acting on the three knowledge domains as it relates to thermometric titrations. ... 49
Table 2.3. Definitions of cognitive and affective Bloom’s domains and corresponding levels. 51 Table 2.4. Comparison of the taxonomies of M&K and Bloom. ... 53
Table 2.5. Summary of the problems with Bloom’s taxonomy addressed by M&K. ... 54
Table 2.6. Basic structure of the Learning Lab Report. ... 60
Table 3.1. Reported aroma descriptions and aromas observed in the laboratory. ... 75
Table 3.2. Some odor characterizations made by students. ... 79
Table 3.4. Students’ results for three confirmatory tests. ... 82 Table 3.5. Reported aroma descriptions and observed aromas from ester synthesized in the
research laboratory prior to use in the kinetics studies. ... 87 Table 3.6. Representative values for odor thresholds and volatilities for selected esters. ... 89 Table 3.7. Average results obtained when assessing the rate of esterification reactions
performed in the research laboratory. ... 91 Table 3.8. Average results when evaluating the factors affecting the rate of esterification in the research laboratory. Each data point had a deviation of ±2 seconds and n=6 trials. . 92 Table 3.9. Percentages of student responses characterized by correctness and completeness
(C&C), correct but not complete (C) or did not answer the question correctly or completely (N). ... 95 Table 3.10. Students’ descriptions of observed aromas for Part A. ... 98 Table 3.11. Sample data from students on effects of alcohols for Part B. ... 99 Table 3.12. Sample data for ethyl acetate aroma detection by varying the amount of (a) ethanol, (b) catalyst and concentration of acetic acid (c). ... 100 Table 3.13. Percentage of student post-lab responses characterized by correctness and
completeness (C&C), correct by not complete (C) or did not answer the question correctly or completely (N). ... 101 Table 3.14. ΔH values for the equilibrium reactions. ... 106 Table 3.15. Sample data for complex ion equilibria that rely on color, clarity, sound and
temperature changes. ... 107 Table 3.16. Equilibrium that rely primarily on aroma and color changes. ... 109 Table 3.17. Equilibrium with temperature dependence that rely on clarity, sound and
Table 3.18. Solubility and chromate equilibria reactions that rely on clarity, sound and
temperature changes. ... 111
Table 3.19. Equilibrium LLR pedagogical objectives and assessments. ... 113
Table 3.20. Percentages of student responses characterized by correctness and completeness. 130 Table 3.21. Percentages of student responses with thoughtful responses to various questions. 131 Table 3.22. Problems observed during implementation and interventions to address these. ... 132
Table 3.23. Effect of HCl concentration on the time for the emergence of the AcOH aroma (3 trials each). ... 135
Table 3.24. ASA kinetics LLR objectives, assessment and associated cognitive skills. ... 137
Table 3.25. Change in correctness of kinetics responses for pre-lab questions through reflection. ... 148
Table 3.26. Comparison of colorimetric and thermometric titration data using 10.0 mL NaOH. ... 160
Table 3.27. Thermometric titration data obtained from the first student volunteer for four acids. ... 160
Table 3.28. The experimental and calculated values for the heat capacity of the medium (cm). 161 Table 3.29. Density (dependent on the concentration) for ~ 0.5 – 1.6 M HCl, NaOH, NaCl. ... 162
Table 3.30. ΔHn data for traditional and thermometric titration experiments at various concentrations. ... 163
Table 3.31. ΔHd values at infinite dilution for various concentrations of HCl. ... 163
Table 3.32. Comparison of data for various ~ 1M acids. ... 164
Table 3.33. Titration LLR pedagogical objectives and assessments. ... 164
Table 3.35. Percentages of student responses characterized by correctness and completeness. 180
Table 3.36. Percentage of thoughtful responses related to the demonstration. ... 182
Table 3.37. Percentages of student responses characterized by correctness and completeness for similar questions used in both implementations. ... 185
Table 3.38. Score changes for pre-lab questions after reflection. ... 188
Table 3.39. Problems observed during the implementations with relevant suggestions and modifications. ... 189
Table 3.40. Titration using the rutabaga indicator (Method A) compared to various indicators. ... 201
Table 3.41. Titration of NaOH vs. HCl using the rutabaga indicator (Methods A-C) compared to standardized concentration using phenolphthalein. * Color change observed. ... 202
Table 3.42. Redox indicators (n=3 trials) compared against the rutabaga indicator (CAN vs. Fe2+ and H 2O2) using method D. ... 203
Table B.1. List of Organic Samples/Functional Group and Corresponding Numbers/Letters. 255 Table B.2. List of Unknowns. ... 255
Table B.3. Examples of descriptive words to be used describe the smells of the samples. ... 256
Table B.4. All student responses aroma classifications. ... 256
Table B.5. Rubric for qualitative organic experiment (Section 203). ... 261
Table B.6. Rubric for qualitative organic experiment (Sections 202, 204 and 206)... 262
Table B.7. Grade percentage ranges with the percentage of total student, male (m) and female (f) by lab section. ... 262
Table C.1. Amount of carboxylic acid needed to make solutions with various concentrations.
... 268
Table C.2. Sample data for students’ results for Table 2. ... 271
Table C.3. Example of the variability of results of two groups of students. ... 271
Table C.4. Sample of volume equivalents for reagents drops used in Part B. ... 272
Table C.5. Number of students responses by correctness as percentages for esterification pre and post lab questions. ... 276
Table D.1. Chemicals and quantities needed for equilibrium experiment. ... 298
Table D.2. Number of students with complete and correct responses (C&C), correct but not complete (C), somewhat correct and incorrect (N) in the equilibrium pre-lab questions. ... 302
Table D.3. Complete chloride source investigation data. ... 303
Table D.4. Common drying agents’ strength and power of dehydration. ... 304
Table E.1. Number of students with complete and correct responses (C&C), correct but not complete (C), somewhat correct and incorrect (N) in the ASA kinetics titration pre-lab questions. ... 321
Table E.2. Rubric and percentage of FS students with C&C, C, SC and N responses. ... 322
Table E.3. Percentage of first semester students with C&C, C, SC and N responses (section of lab separated and graded based on correctness). ... 323
Table E.4. Rubric and Percentage of second semester students with C&C, C, SC and N responses. ... 323
Table E.5. Average and medium scores for SS section for the entire lab grade. ... 324
Table E.6. Concentration of acetic acid in air around experimental set-up. ... 324
Table F.2. Number of students with complete and correct responses (C&C), correct but not complete (C), somewhat correct and incorrect (N) in the titration pre-lab questions. ... 349 Table F.3. Average for each titration question of the pre-lab prior to and after the experiment.
... 350 Table F.4. Percentage of complete and correct responses (C&C), correct but not complete (C), somewhat correct and incorrect (N). ... 350 Table F.5. Sample observations of the dilution of H2SO4. ... 351
LIST OF FIGURES
Figure 1.1. Perceptual cycle with an example of the visual perceptual process of an apple. ... 5
Figure 1.2. Electrical activity in axon. ... 9
Figure 1.3. Spectral sensitivity curves of visual pigments in cones. ... 11
Figure 1.4. Audibility curve. ... 13
Figure 1.5. Response of warm and cold fibers to temperature stimulus. ... 16
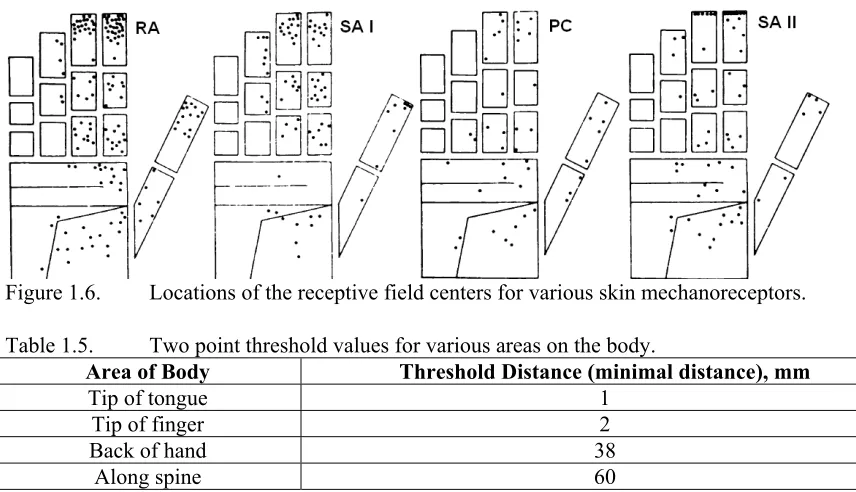
Figure 1.6. Locations of the receptive field centers for various skin mechanoreceptors. ... 17
Figure 1.7. Some exploratory procedures. ... 18
Figure 1.8. Proposed olfactory receptor sites with representative compounds proposed to fit them. ... 21
Figure 2.1. The M&K’s systems of thought levels and domains of knowledge. ... 44
Figure 3.1. Lumitest light probe. ... 76
Figure 3.2. Sample calculations to approximate concentration of esters in air for the ethyl and propyl acetate (ppm). ... 90
Figure 3.3. Esterification experimental set-up. ... 93
Figure 3.4. Students’ esterification mechanisms. ... 96
Figure 3.5. Esterification mechanism with explanations for each step. ... 97
Figure 3.6. Kinetics hydrolysis experimental set-up. ... 137
Figure 3.7. Section of kinetics post lab question depicting reaction at the molecular level. ... 140
Figure 3.8. Calculation diagram for the ASA kinetics. ... 142
Figure 3.9. Thermometric titration apparatus. ... 159
Figure 3.10. Taber’s diagram depicting an acid at different concentrations and strengths. ... 168
Figure 3.11. Calculation and conversion diagram. ... 177
Figure 3.13. Sample of the C response to activity question 1 with incorrect water structure. .... 181
Figure 3.14. Sample SC response with incorrect structures and charges to activity question 1. . 181
Figure 3.15. Sample of the N response to activity question 1 showing incorrect Lewis structure and an inappropriate response to the question. ... 181
Figure 3.16. Sample C&C response for the reversal of the order of addition of reagents. ... 186
Figure 3.17. SC diagram for the reversal of the order of addition of reagents. ... 186
Figure 3.18. Incorrect reverse addition diagram. ... 186
Figure 3.19. Sample C&C response to post-lab question 5. ... 187
Figure 3.20. Sample N response for pictorial representation of diprotic acid titration ... 187
Figure 3.21. Sample pictorial representations of the titration for post-lab question 1. ... 188
Figure 3.22. Aglyconic side chains with average content of rutabaga glucosinolates. ... 192
Figure 3.23. Generic structure of glucosinolate showing anomeric carbon resembling O,S-acetal. ... 192
Figure 3.24. Purin-6-yl-1-thio-D-glucopyranosides (204) and oxathiolanes (209) used to determine hydrolysis mechanism. ... 194
Figure 3.25. Polar effects with attached groups. ... 195
Figure 3.26. Resonance effects of leaving group on the hydrolysis mechanism. ... 195
LIST OF SCHEMES
Scheme 3.1. Sample chemical tests and expected results for alcohol and carboxylic acid. ... 76
Scheme 3.2. Sensorial observations of functional groups with characteristic tests. ... 81
Scheme 3.3. Flow chart of the esterification kinetics experimental procedure. ... 97
Scheme 3.4. Equilibrium terminology map. ... 122
Scheme 3.5. Equilibrium LLR experimental components and design... 128
Scheme 3.6. Hydrolysis of acetyl salicylic acid produces a vinegar aroma from acetic acid. ... 133
Scheme 3.7. Mechanism of ASA acid-catalyzed hydrolysis. ... 134
Scheme 3.8. Mechanism of ASA base-promoted hydrolysis. ... 135
Scheme 3.9. Potential mechanisms for O,O- or O,S- acetal acid-catalyzed hydrolysis. ... 193
Scheme 3.10. Final step of both mechanisms - Lossen like rearrangement to form the isothiocyanate. ... 196
Scheme 3.11. Breakdown product of β-hydroxyl isothiocyanate. ... 196
Scheme 3.12. Redox reaction using CAN (Ce4+) with Fe2+ and H 2O2. ... 197
Scheme 3.13. Proposed intermediate for redox titration for indole glucosinolate. ... 197
Scheme 3.14. Proposed mechanism for the oxidation of the hydroxyindoles using Fremy’s salt. 198 Scheme 3.15. Oxidation of sulfide side chain to produce sulfinyl groups. ... 198
Scheme 3.16. Oxidation of sulfide at the anomeric carbon. ... 199
Scheme 3.17. Oxidation of sulfide of s-pyridyl glycoside. ... 199
Scheme C.1. Fisher Esterification Mechanism ... 269
Scheme G.1. Proposed complete mechanism depicting C-S cleavage of glucosinolate. ... 362
LIST OF GRAPHS
Graph 3.1 Distribution of students’ grades as the probability of z-scores (Normative data). .... 83
Graph 3.2. Graph depicting disturbances (A-D) in the complex ion equilibrium. ... 116
Graph 3.3. Representative pre-lab activity concentration vs. interval/time graph. ... 117
Graph 3.4. Representative graph of ln[ASA] vs. time. ... 136
Graph 3.5. Representative graph of [ASA] vs. time. ... 136
Graph 3.6. Representative graph of 1/[ASA] vs. time. ... 136
Graph 3.7. Enthalpimetric graph for the traditional determination of ΔH. ... 151
Graph 3.8. Representative thermograms for (a) an ideal titration and (b) actual titration results. ... 153
Graph 3.9. Temperature effect on graph due to the titrant and analyte. ... 155
Graph 3.10. Determination of ΔHn using Method A. ... 156
Graph 3.11. Determination of ΔHn using Method B. ... 157
Graph 3.12. Graph of temperature vs. time for calibration of the Styrofoam cups to determine cm. ... 161
Graph 3.13. Thermometric titration graph for NaOH vs. HCl. ... 183
Graph 3.14. Student thermometric graph using Method A. ... 183
LIST OF EQUATIONS
Equation 1.1. Weber’s Law. ... 7
Equation 3.1. Typical calorimetric equation. ... 152
Equation 3.2. Energy and enthalpy equation. ... 152
Equation 3.3. Temperature change equation. ... 152
Equation 3.4. Derivation of calorimetric equations. ... 153
Equation 3.5. Equation for the slope of the thermogram. ... 153
Equation 3.6. Equation to determine enthalpy. ... 153
Equation 3.7. Approximation of ct. ... 154
Equation 3.8. Total heat capacity of system. ... 154
Equation 3.9. Resulting enthalpy equation. ... 154
Equation 3.10. Enthalpy equation for medium. ... 154
Equation 3.11. Determination of heat capacity of medium. ... 154
Equation F.1. Heat of cooling (mix hot + cold). ... 351
Equation F.2. Heat lost by hot water. ... 351
Equation F.3. Heat gained by cold water. ... 351
Equation F.4. Heat lost or gain in insulators. ... 351
Equation F.5. Heat of calorimeter. ... 351
LIST OF ABBREVIATIONS
ASA acetyl salicylic acidC Correct but not complete response C&C Complete and correct response ca Heat capacity of container, J/K
cm Heat capacity of the medium, J/K
CNS Central nervous system
cs Specific heat capacity (intensive property), J/gK or J/g°C
ct Total heat capacity (extensive property), J/K or J/°C
cw Specific heat capacity of water, intensive property , 4.18J/gK
ΔHd enthalpy of dilution, J/mol
ΔHn enthalpy of neutralization, J/mol
ΔHs enthalpy of solution, J/mol
ΔT change in temperature TF - TI, K or °C
EDG electron donating group
EP exploratory procedures
Et ethyl EtOH ethanol
EWG electron withdrawing group
FG functional group
fMRI functional magnetic resonance imagining
FS First semester
FV First student volunteer
GC-MS gas chromatography-mass spectroscopy GLC gas-liquid chromatography
GS Glucosinolate i-pr isopropyl
IR infrared spectroscopy
Keq thermodynamic equilibrium constant
kf forward rate constant
kr reverse rate constant
LCP Le Chatêlier’s principle LED light-emitting diode LLR Learning Lab Report
lp light probe
m slope of a line M&K Marzano and Kendall Me methyl MeOH methanol
MORE Model–Observe–Reflect–Explain MSDS Material Safety Data Sheets
Mt Molarity of titrant, M
NP non-Pacinian p pressure of stimulus
PET positron emission tomography PNS Peripheral nervous system ppt precipitate Pr propyl q amount of heat
Qc reaction quotient
R rectus for right, enantiomer stereochemistry S sinister for left, enantiomer stereochemistry SC Somewhat correct response
sol'n solution
SS Second semester
SV Second student volunteer SWH Science Writing Heuristic T or temp Temperature, K or °C
TA teaching assistant
CHAPTER 1
. Overview & Proposal
1.1 IntroductionEven though chemistry involves the investigation of everything we experience through all our senses, “visualization” of chemical phenomena often has been limited in the teaching laboratories to the sense of sight traditionally. We have developed sensorial chemistry experiments to investigate chemical concepts, make quantitative determinations, and familiarize students with chemical techniques traditionally requiring only eyesight. These sensorial experiments were designed to utilize multiple or different senses in making chemical determinations. The research objectives of this dissertation project are both scientific (chemical) and pedagogical in nature. In order to develop sensorial experiments, a strong knowledge of chemical principles and reactions must be learned and utilized. In these experiments, the chemistry is manipulated in order for the students to explore reactions and principles with senses other than eyesight. The chemistry of the experiments is thoroughly screened so that students may perform the experiments in a safe manner, as they will be relying on senses traditionally not employed in the teaching environment. These sensorial experiments utilize typical equipment found in teaching laboratories as well as inexpensive chemicals in order to aid in their implementation.
their learning. The format also allowed instructors to monitor students’ thought processes from the pre-lab to post lab, thereby aiding pedagogical modifications of the experiments. In addition to this new format, all the experiments were designed as collaborative, inquiry-based experiments that used an investigative approach rather than a verification one in aims of enhancing the students understanding of the subject and promoting critical thinking skills. The experiments study several topics usually covered in the first 2 years of the chemistry curriculum (general and organic chemistry courses). The literature review, proposal, pedagogical framework, novel laboratory format and development and results of these experiments are presented.
1.2 Literature Review
the sense of smell (5). In the demonstration students rank the degree of the ammonia observed from the reaction of ammonium chloride with different bases of varying strengths, demonstrating that the acid-base reaction that had the strongest smell has the largest Keq.
Hiemenz and Pfeiffer described conductivity titrations of NaOH with trichloroacetic acid where the endpoint is detected audibly using a modified conductivity cell and balance (6).The experiment involves production of a continuous sound through an amplifier, which is nullified at the endpoint, and the tarred sample is re-weighed to determine the amount of base added. A modified Beckman Zeromatic II pH meter with an audio-encoded Simpson meter was used by Tallman to perform acid base titrations (7). This experiment was performed successfully by the first blind student at North Dakota State University who was surprised how well laboratory work supported class work. Ratiff devised conductivity experiments that use sound rather than the traditional LED set-up to determine the conductivity of various solutions using simple materials such as a minibuzzer and a 9V battery (8).
world (12). The nanoManipulator uses a microcomputer programmed to control a joystick device which gives tangible response from an atomic force microscope (AFM). MolySim is a molecular modeling software being used to help students to visualize molecules by assembling a molecule, displaying its different conformations, and providing the dynamic energetics of the system (13). The program utilizes a novel joystick which allows the student to ‘feel’ the properties of the molecule.
These few published experiments and sensory equipment that utilize smell, hearing and touch allow students to perceive scientific concepts through senses other than eyesight, demonstrating the usefulness of the senses in making observations. Our sensorial experiments allows for the exploration of chemistry, which explores everything we experience through our senses, with multiple or different senses. The use of multi-sensory experiences can take advantage of all the senses to support learning in the laboratory as each sense builds toward a more complete experience of the chemical concept explored. The development of sensorial experiments provides a resource for the utilization of the senses in the undergraduate chemistry laboratory in a safe way.
1.3 Sensory Process Overview
Perceptual process
The perceptual process is dynamic, as it is continually changing from one received stimulus to action. Figure 1.1 provides an example of the perceptual process with the cyclical visual perceptual process of viewing an apple. The distal stimulus takes place at a distance such as when looking at a stimuli (apple) (14). The distal stimuli can either be environmental or attended stimuli. Environmental stimuli are all the stimuli available to the observer such as the view of an entire classroom. Attended stimuli are stimuli that are the point of focus of the observer for example a book on a table in the classroom (15).
A B
C Distal Stimulus
e.g. Apple, 3D, red, round
Proximal Stimulus
e.g. Flat upside down image inside eye
Trasnduction Electrical
energy out
Stimulus in
Processing
Signals from neurons to brain
Action
Perception Recognition
"Apple" "Fruit" "Sweet"
Figure 1.1. Perceptual cycle with an example of the visual perceptual process of an apple. * Arrows A, B, and C indicate three relationships measured by researchers.
impacts the proximal image resulting in an altered perception, but does not affect the distal stimulus. The proximal stimulus is converted into electrical energy in the transduction stage, which generates electrical signals in the neurons (nerve cells) for neural processing (Figure 1.1). The electrical signals are transferred through the nerves to the brain to be transformed into the perception of the stimulus. The ability for us to categorize the stimulus and give it meaning is the recognition stage and is a different process from perception. Recognition and perception often lead to an active response.
In order to study the perceptual process and understand what people perceive via their senses, scientists use various methods to observe the stimulus-perception (A), stimulus-neural processing (B) and neural processing-perception (C) relationships (Figure 1.1). These relationships in the perceptual process can be analyzed by studying the physiological (or phenomenological) and psychophysical levels shown in Table 1.1 (15,16). The psychophysical method is used to measure the stimuli-perception relationship (A) and involves asking a subject to describe what they perceive. These types of studies are qualitative forms of measurement important in studying the perceptual process showing that various perceptions can alter a person’s expectation (14,15).
Table 1.1. Methods and types of analysis for studying the relationships in the perceptual process.
Method Analysis Example
A Psychophysical Stimulus-perception Person describing a stimulus.
B Physiological Stimulus-neural
processing
Monitoring neural firing in response to a given stimulus. C Psychophysical and physiological Neural processing-perception descriptions of a given stimulus. Observing neural firing and
Absolute threshold is the minimum intensity of the stimuli detected 50% of the time by a subject. Gustav Fechner described three methods to measure absolute thresholds: method of constant stimuli, limits, and adjustment (18). The method of constant stimuli measures stimuli of varying intensities presented in random order to a subject and is the most accurate but slowest method. The method of limits occurs when stimuli are presented in ascending or descending order and even though it is the fastest method it is the least accurate. The observer responds when the stimulus is perceived and the cross-over point of the ascending and descending order is the threshold (15). The method of adjustments arises when the stimuli intensity is slowly changed until the observer can barely detect it. This method is done repeatedly to obtain an average (14). The difference threshold, described by Ernst Weber, measures the smallest difference between two stimuli that a person can detect 50% of the time and is sometimes referred to the just-noticeable difference (18,19). The same methods used to observe the absolute threshold can be used to as observe the difference threshold (15). Weber also observed that despite the magnitude of stimuli, two stimuli must differ by a constant in order for their difference to be detected. This observation led to the formulation of Weber's law shown in Equation 1 (20,21,).
ΔI
I = k
ΔI - difference threshold
I - initial stimulus intensity k- contant
The brain and the nervous system
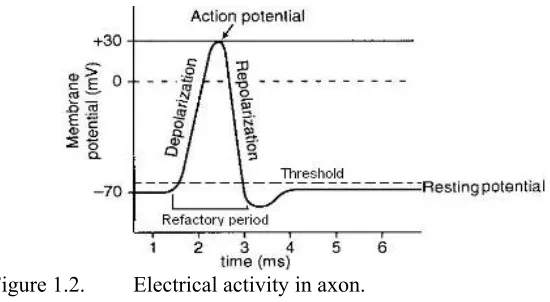
Although the operation of the brain is vastly complex, information is known about the brain and its connection to our sensorial perceptions. The activity of the cerebral cortex is the focus of a significant amount of research as one of its functions is creating perception particularly through modular organization - functional compartments separated from each other or into separate structures (22). The organization of the senses is into primary receiving areas, in which the signals are received in the brain by the sensory receptors. The nervous system is divided into two parts, the central (CNS - spinal cord and brain) and peripheral (PNS - spinal and cranial nerves) nervous systems which communicate and interact with each other. The CNS is responsible for integrating, processing and coordinating sensory data and motor information and is responsible for learning, memory and emotion (23). The PNS conducts sensory information to the CNS (afferent system) and carries motor commands from the CNS (23). Axons are composed of nerve fibers which carry sensory and motor information in the PNS by conducting electrical impulses (action potential). Receptors are sensory structures that detect internal stimuli or respond to external stimuli, while effectors respond to motor information with a reaction from the CNS (23).
Figure 1.2. Electrical activity in axon.
Our knowledge of the world is limited to the stimuli that excite our sensory receptors. Sensory receptors are the interface between our nervous system and the internal and external environments (23). The senses consist of general (pain, pressure, touch, vibrations, and proprioception) and special senses (vision, gustation, olfaction and hearing). The special senses are more complex and its receptors are located in sense organs, while general sense receptors are distributed throughout the body (23). The visual, auditory and tactile organs detect physical stimuli directly while the olfactory and gustatory organs sense objects through chemoreception processes. In order to understand how humans perceive the world, the basic concepts of sensory receptors and processing are explored.
The sense of sight
Visual perception has been explained by a variety of theories and experimental data. One obvious quality of vision is the ability to perceive color and our emotional connection to colors. Color is thought to aid perceptual organization (separation of areas) and hence is potentially crucial for survival. Achromatic color (black, white and grey shades) is due to the neural processing in the rods, while chromatic color (all colors excluding white, black and shades of grey) is due to processing in the cones. Our ability to observe color is due to solid objects reflecting certain wavelengths of light and fluid objects transmitting certain wavelengths (14).
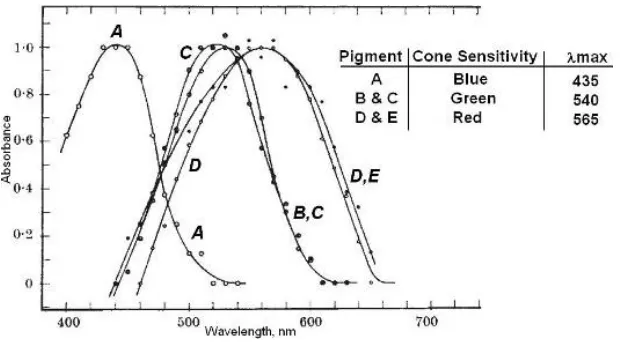
Johannes von Kries in 1896 proposed the duplicity theory of vision which states that rods function to aid dark adaptation (how the eye recovers its sensitivity in the dark after exposure to bright light) while spectral sensitivity (color or light sensitivity) is due to the cones (24,26). Rods provide information about the absence or presence of photons, and the cones provide information on the wavelength (23). The increased sensitivity of the receptors during dark adaptation is due to the rate of visual pigment regeneration (27), where the rods are significantly slower (more sensitive in dark) than the cones and more sensitive to shorter wavelengths of light (28). This leads to the Purkinje shift (described by Johannes Evangelista von Purkinje in 1825) which is the inclination for the sensitivity of the eye to shift toward the blue region of the color spectrum (500nm and lower) at low levels of light (29,30).
would lead to certain non-genetic related color-blind disorders. The opponent-process theory of color vision (developed by Ewald Hering) suggests that there are some color combinations that can not be observed, such as red-green or yellow-blue (14,33). The opponent-process theory was shown to be due to the overlap in the wavelengths of these pairs causing an antagonistic effect where opponent cells in the cortex respond positively to one of the color pair while negatively to the other (14).
Figure 1.3. Spectral sensitivity curves of visual pigments in cones.
color and affects about 1 in 30,000 people (34). The opponent-process theory has been associated with some of these color deficiency disorders (14). Focusing problems of the eye affect the perception of images and include myopia (near-sighted), hyperopia (farsighted) and astigmatism affecting 30%, 25% and 16.5% of the US population respectively (35). Corrective lens can be used to correct these problems, but require different strengths depending on the severity (37).
The sense of hearing
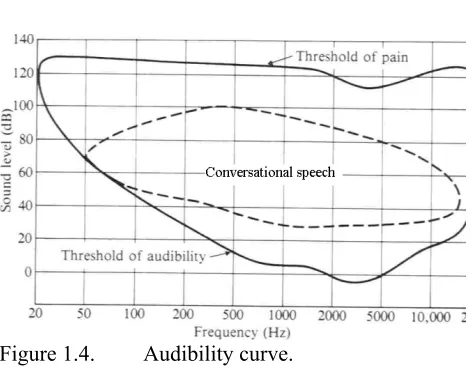
Hearing is the detection of sound vibrations propagating through a medium such as air. It is the sense of sound perception. Our observation of sound vibrations is not directly observed, but rather the effect of the vibration on the pressure of the medium. Acoustic or sound stimulus is the physical pressure change that takes place allowing for the experience of hearing while changes in pressure of the medium are sound waves (14). Quality of sound is related to the frequency (repetition of cycle per second, Hertz, Hz) and amplitude (height of wave) of a tone. Humans are most sensitive to frequencies in the range of 1,000-4,000Hz, however (38), children and young adults can detect frequencies ranging from 20-20,000Hz (39). The unit of sound is the decibel (dB) and is related to the sound pressure of stimulus (p) and standard sound pressure (p0, usually 20μPa)
by
0
log
20
p
p
dB
=
×
. The threshold (lowest audible sound) is considered to be 0dB at 1,000Hz,(39). The smallest change in air pressure that humans are sensitive to is 10-15dB above air pressure generated by random motion of air molecules.
the reference level when measuring hearing loss (Figure 1.4)(14,41). The minimum intensity in the threshold of hearing occurs at about 4,000 Hz (39). The audibility curve indicates the sound intensity that creates the same perception of loudness or intensity of sound at various frequencies. The differences in timbre are caused by the relative strength of the harmonics as well as the time from the start to the end of the tone (14).
Table 1.2. Sound intensities and dangerous exposure times.
Decibel Level Example Dangerous time exposure
0 Lowest audible sound
30-50 Soft whisper, quiet library, gentle breeze, refrigerator
70 Busy traffic, noisy restaurant Some danger if continuous 90 Shop tools, gas lawn mower, truck noise Less than 8 hours
100 Chain saw, pneumatic drill, babies’ cry 2 hours
120-140 Gun shot, sandblasting, jet plane Immediate danger 160 Rocket launching pad, shot gun Hearing loss inevitable
Figure 1.4. Audibility curve.
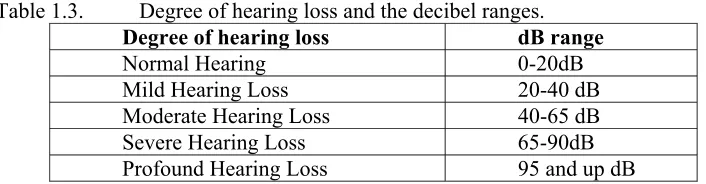
results from damage to the outer or middle ear not permitting transmission of vibration occur in 0.8% of the population and are not severe as they often times can be surgically corrected or relieved with hearing aids (45). Damage to the hair cells of the inner ear or nerves results in sensorineural hearing loss (permanent) accounting for 8% of the population (90% of all types of hearing loss) and can range from mild to profound (24,45). For this type of hearing loss, surgery can not correct the loss and often hearing aids do not help as they may amplify sounds but remain unclear.
Table 1.3. Degree of hearing loss and the decibel ranges.
Degree of hearing loss dB range
Normal Hearing 0-20dB
Mild Hearing Loss 20-40 dB
Moderate Hearing Loss 40-65 dB
Severe Hearing Loss 65-90dB
Profound Hearing Loss 95 and up dB
Persons who are deaf or deaf and blind are able to determine what is being said to them using the vibrations of the person’s mouth and face by placing their hand on the speakers face. Tadoma is a tactile speech method where a deaf or deaf/blind person places the thumb on the speaker's lips and other fingers along the jaw line (46). Reed et al. have demonstrated that good speech reception can be achieved through the tactile sense and showed that performance is approximately equal to that of normal listening in noise or babbling with a signal-to-noise ratio of 0-6 dB. Reed used a Tadoma system to monitor and translate signals from the speaker’s face into tactile information which then is outputted in to an artificial face. The ability of deaf or deaf and blind students to easily make observations by touch would allow them to actively participate in the undergraduate laboratory with experiments that utilize tactile sensations (Chapter 4).
The sense of touch (Cutaneous Senses)
noticeable by sight, such as surface texture. Cutaneous sensations are based on stimulus of skin receptors and allows for tactile (pressure), temperature and pain perception (47). These receptors serve different functions based on the physical properties, location and size of the receptor. These receptors synapse (site of communication between nerves) into mechanoreceptive or thermoreceptive nerve fibers, depending on the function of the receptor. Mechanoreceptive nerve fibers respond to tactile frequency changes or mechanical displacement, while thermoreceptive fibers respond to temperature changes. The nerve fibers allow signals to proceed to the somatosensory receiving area in the parietal lobe and the secondary somatosensory cortex (14,23).
Mechanoreceptors are classified as tactile receptors, baroreceptors, and proprioreceptors. The tactile receptors provide sensation of touch, pressure and vibration. The baroreceptors detect pressure changes in blood vessels, digestive, reproductive and urinary tracts. The proprioreceptors monitor positions of joints and muscle (23). Tactile sensations are felt by the displacement of skin, and the sensation occurs via separate receptor channels, which are described by the four different receptors that are sensitive to different stimuli at different frequency ranges (Table 1.4). Four types of mechanoreceptive fibers associated with tactile receptors are classified as either rapidly adapting (RA I and Pacinian, P) or slowly adapting (SA I and SA II).
Table 1.4. Channels and mechanoreceptive fibers associated with receptors. Receptor Channel Frequency Fiber Stimulus Perception Merkel NP III 0.3-3Hz SA I Pressure Pressure
Meissner NP I 3-40Hz RA I Taps Flutter
Ruffini NP II 15-400Hz SA II Stretching Buzzing Pacinian PC 10>500Hz P Rapid vibration Vibration
temperature between 30-48°C (Figure 1.5)(24). Extreme temperatures in either direction cause pain (14,48). Thermoreceptors are very active when temperature changes, however adapts quickly to stable temperatures (23). Temperature sensations take place along the same pathways as pain sensations (23). Nociceptors respond to intense stimulations such as severe temperatures and immense pressure. Pain perception is affected by an individual’s culture and past experiences. Sarlani et al have shown that women tend to report greater sensitivity and perceived unpleasantness to experimentally induced thermal pain at 15°C and 44°C than males, but showed no significant difference in thermal sensitivity and adaptation to temperatures between 15°C and 44°C for both genders (49). This research also showed no difference in thermal intensity for both sides of the body (equal laterality) but lower thermal threshold was noted with the left hand vs. the right hand. Functional magnetic resonance imagining (fMRI) studies of Brooks et al studying thermal pain threshold have shown that when subjects were distracted from thermal pain stimulation, brain activity was lessened (50).
Cold fibers Warm fibers
5 10
Fibe
r Res
po
nse
,
imp
uls
e/
se
cond
Temperature, °C
10 20 30 40 50 60
Figure 1.5. Response of warm and cold fibers to temperature stimulus.
(Figure 1.6) (52), producing varying sensitivity (47). Areas with small receptive fields, such as the lips and fingertips, have greater tactile acuity as the stimulus may affect multiple neurons at once allowing for better perception (Table 1.5) (53). SA I and RA I fibers have small receptive fields found in great abundance in the fingertips accounting for the high acuity in the fingertips (14).
Figure 1.6. Locations of the receptive field centers for various skin mechanoreceptors.
Table 1.5. Two point threshold values for various areas on the body.
Area of Body Threshold Distance (minimal distance), mm
Tip of tongue 1
Tip of finger 2
Back of hand 38
Along spine 60
(a) Lateral motion - texture (b) Pressure - hardness (c) Static contact - temperature
(d) Enclosure - global shape, volume
(e) Contour following -
exact shape, global shape (f) Unsupported holding - weight Figure 1.7. Some exploratory procedures.
The ability to identify objects (3D) by touch is referred to as haptic perception. Many people can identify common objects within one to two seconds using touch. Exploratory procedures (EP) are distinctive movements used to identify objects and the type of procedure used depends on the object qualities (Figure 1.7). The exploratory procedures of lateral motion (a) and ‘contour following (e) are usually used to judge texture. Enclosure (d) and contour following (e) procedures are used to judge exact shape (14,56). Other types of procedures may exist such as shaking a box to explore what may be inside or a child rocking a tooth to feel how loose it may be (53). It is, however, easier to identify familiar objects than unfamiliar ones.
presented experimentation that demonstration that there was a greater perceptual sensitivity to 3D objects when an object was viewed visually first then observed by touch. They hypothesize that increased sensorial experience produces increased perceptual differentiation and they eliminated the role of cognition by using unfamiliar objects (59).
There are several disorders that affect the sense of touch, which may be related to the sensitivity of the nerves, disorders of the somatosensory cortex, and symptoms of other disorders or illnesses such as tumors in the brain. Many disorders affecting touch are due to accidents or injuries and are very uncommon. Hypoesthesia (numbness) is the partial or total lack of sensation or cutaneous stimulation in a part of the body, and may be attributed to various reasons such as damaged nerves. Paresthesia is a sensation of tingling or pricking of the skin and is usually associated with other illnesses (60).
The sense of smell
by olfaction. The odor threshold of any compound affects at what concentrations we observe it. However, smell and flavor (combination of smell and taste) have more importance to human in a non-crucial manner such as in foods and fragrances.
There are different theories concerning the discrimination of odor intensity and quality, however, that the odor of a substance is generally determined by its structure is widely accepted. Researchers have found that the physical and chemical properties of odorants affect the quality of the odor, however, the specific details of the mechanism has not been determined. Since this relationship has not been determined, focus has been on the correlation between odorant and neural coding. This type of research utilizes odotopes (compounds with a similar chemical feature) and observes neural activity. It has been shown that olfactory receptor neurons respond to a number of odorants and similar neurons are clustered in particular areas of the nasal passage (14).
Table 1.6. Primary odorants and examples described by Amoore.
Primary odorants described by Amoore Example of odorants
Ethereal Ether, dichloroethane
Camphoraceous Camphor, ethers
Musky Esters Floral Alcohols Minty Ketones
Pungent carboxylic acids
Putrid disulfides, amines
molecules in certain receptors (Figure 1.8) (64). A similar theory has also been proposed by R.W. Moncrieff, however an analysis of chemical differences and properties in the various classes were included in the study such as the reactions and interactions of the molecules (65). The results of these studies are sometimes referred to as the Moncrieff-Amoore site fitting theory (66).
Figure 1.8. Proposed olfactory receptor sites with representative compounds proposed to fit them.
sites while the presence of electrophilic or nucleophilic regions on molecules is grouped in certain classes of odorants (Table 1.7). This research suggests that odor molecules possess a variety of features and thus excite specific receptors more or less strongly. This combination of excitatory signals from different receptors makes up what we perceive as the molecule's smell (67).
Table 1.7. Some primary odorants and examples described by Jennings-White.
Odorants class Representative odorants Characteristic of class
Acidic Formic acid Electrophilic, proton donating
Alliaceous Allyl isothiocyanate Large hydrophobic region, containing sulfur
Aniseed Anethole Non-polar p-disubstituted benzene
Burnt Pyridine Nitrogen heteroaromatic ring with lone pair on nitrogen in the plane of the ring Citrus 3,7-dimethyl-2,6-octadienal (Citral) Cyclic hydrocarbons or linear with polar
function group Edible
3-hydroxy-2-methyl-4H-pyran-4-one
1,4 disposition of heteroatoms Fruity γ-undecalactone Carbonyl and hydrophobic region
Lily Hydroxycitronellal Bifunctional, tertiary alcohol
Oxidizing Ozone Electrophilic character
Sweet Vanillin Aromatic ring with carbonyl or similar functional group
Other theories on olfaction include the vibrational and radiation theories, however recent research has shown these theories are not valid (68). Vibration theory of olfaction proposes that a molecule's characteristic odor is due to its vibrational frequency in the infrared range as proposed by R.H. Wright (69). The radiation theory proposes that olfaction is a result of the heat released from the organism’s receptors and is due to the size and shape of the receptor which results in differing heats released. Substances in the absorption band of this region will loose energy which allows for the stimulation (70).
characterizing the stimulus. These two threshold values are often used interchangeable. The odor recognition threshold is the concentration at which an odor can be identified or described and is divided into two categories: 50% and 100% odor recognition threshold. A 50% odor recognition threshold is the concentration at which 50% of the people recognize the odor and the 100% odor recognition threshold is the lowest concentration at which 100% of trained observers can positively identify an odor (71). These odor threshold values can be expressed as volume of odorant per volume of solvent or air and are usually presented in units of ppm. The odor threshold for the perception of an odor varies with the odor type, but is typically from 2 x 10⁻⁷ to 1 ppm of air (66). Table 1.8
includes some characteristic values.
Table 1.8. Comparison of the odor thresholds for some common chemicals.
Odor Threshold, ppm Chemical Vapor Pressure, mmHg at 20°C Detection range 50% recognition
Amyl alcohol 2 0.10-0.30 1.0
Ammonia 115 (10% solution) 0.037-5.75 46.8
butyl acetate 8 0.006-0.007 0.037
cyclohexanone 2 0.019-0.12 0.12
ethyl acetate 76 0.61-6.3 13.2
methanol 97 4.26-33 53.3
methyl ethyl ketone 2.1 0.27-2.0 5.5
There are several interesting aspects of olfaction that are often overlooked. The human sense of smell is not as sensitive as in many other animals, however, is sensitive enough to detect one molecule per receptor and the lowered sensitivity in human is therefore attributed to a lower number of receptors (14). Humans have the ability to detect differences in odor intensity due to differences in threshold (75). Identification of odorants improves with practice, in that subjects will associate the name with an odor much better after first being corrected after a misidentification (important in designing experiments that involve aromas). Having knowledge of the identification of an aroma tends to transform the perception of the odor (14,75). Unfamiliar odors usually lead to avoidance, but this perception can be changed based on information given to the observer. For example, presentation of pleasant or unpleasant pictures before observation of an aroma alters the perception of the aroma (76). Studies have also shown that ~75% of humans can identify other people by their odor, but not as a sole means of identification (14).
there are many examples of enantiomers that smell completely different as shown in Table 1.9 (80,81). A well known pair of enantiomers showing this property is the R and S carvones and this pair is often used in olfactory studies as a method of threshold evaluation using persons with and without the ability to smell one or both carvones (82). The biggest problem associated with olfaction research is that characteristics and detectability of aromas are subjective or individual-dependent (24,83), however Walker et al suggest that a larger part of the variation is due to lack of correlation of methods used between laboratories rather than to individuals tested (84).
Table 1.9. Examples of enantiomers showing differing aromas.
Compound Odor description
7-Hydroxy-6,7-dihydro-citronellal (+) Lily of the valley with green minty notes 7-Hydroxy-6,7-dihydro-citronellal (−) Sweet lily of the valley note
Linalool (+) Sweet, petigrain
Linalool (−) Woody, lavender
Carvone (+) Caraway
Carvone (−) Spearmint
Androstenone (+) Odorless
Androstenone (−) Sweaty, urine, strong, musky
Limonene (+) Orange
Limonene (−) Turpentine
is essential for olfactory memory, where patients with unilateral amygdala damaged were impaired in their memory for matching odors with names, but were not significantly impaired in odor recognition. Persons with bilateral amygdala damage have severe impairment in both odor-name matching as well as in odor recognition memory (87).
Anosmia, which may be due to injury, allergies or infection, is often a difficult disorder to diagnose and treat. The severity of this disorder ranges from the inability to smell one form of chemicals to being unable to smell anything at all and it affects 1-2% of the US population (88). Hyposmia is the decreased ability to observe aromas and may be a result of allergies or colds affecting (temporary) ~5% of the US (89). Hyperosmia is increased sensitivity to aromas which may be caused by illnesses such as migraines. Migraine sufferers (25% of women and 8% of men) often experience hypersensitivity to aromas and these headaches are often triggered by intense aroma (90). Research has shown that migraine sufferers who experience hypersensitivity to odors during migraines also experience hyperacuity between attacks in that they are able to observe aromas at lower concentrations than non sufferers (91).
1.4 Sensory learning
contribute equally to the integrated perception (94). The multi-sensory enhancement possibly encourages learning due to increased attention (95) and the use of more than one sense may encourage learning, if not just to stimulate interest in the concept. Studies conducted by Cann and Ross have shown that olfactory stimuli enhance memory recognition (96). Chu and Downes performed experiments linking better memory retention of aromas to the Proust phenomenon (97). Proust phenomenon is the ability of odors to be spontaneously prompted from autobiographical memories, which were personal accounts of events or memories related to a person’s past. This phenomenon is believed to occur due to the fact that memory of odors does not deteriorate as quickly as memories from other senses (98).
Lehmann and Murray performed experiments that suggest that past multi-sensory experiences can enrich current uni-sensory processing and memory performance (99). Their research determined the kinds of multi-sensory experiences necessary to produce distinct memory that can be retrieved upon repetition of the visual component. A review by Shams and Seitz suggests that multi-sensory-training protocols can better approximate natural settings and are more effective for learning. Memory research presented shows that multi-sensory exposure can result in superior recognition of objects when compared to uni-sensory exposure because multi-sensory training can engage individuals with different learning styles (100).
can change to other types of learning styles over time (101). However, this multi-sensory approach may potentially benefit students by bringing attention to a learning preference as this research suggests, but more importantly beneficial through increased contact with the material through the use of different modes or sensory exposure.
Dede et al. have used virtual immersion experiments to demonstrate that multi-sensory representations of scientific phenomena is a valuable tool for enhancing understanding of chemistry and physics as well as displacing misconceptions through experiential metaphors and analogies (102). Multi-tool teaching approaches such as multimedia and virtual environments incorporated into traditional lectures haven been shown to facilitate diverse educational environments and addressing variety of learning preferences which generates enthusiasm in majority of students (103). Research conducted on chemical engineering courses taught using an instructional model to address the different learning styles suggest that this approach enhanced understanding and promoted the development of thinking skills. It was suggested that with suitable modifications for the differences in course material, the model may be equally effective for chemistry instruction (104).
1.5 Proposal
Multi-sensory learning can benefit all students by actively engaging them in learning through stimulation or through their different learning styles (101-104). Multi-sensory exposure in the laboratory can engage individuals with different learning styles and potentially increase memory retention (100). Manipulation of typical chemical experiments to use multiple senses can be mentally stimulating for students potentially allowing for better memory retention similar to results found by multi-sensory input in virtual environment experiments (105). Since perception generally depends on information from the different sensory systems, multi-sensory experiences in the laboratory exploits all the senses for investigating chemical concepts, making qualitative determinations and familiarizing students with chemical techniques. These experiments could potentially reinforce learning since each sense builds toward a more complete experience of concepts (93).
REFERENCES
1.
Wood, J. T.; Eddy, R. J. Chem. Edu. 1996,73, 257–258.2.
Neppel, K.; Oliver-Hoyo, M. T.; Queen, C.; Reed, N. J. Chem. Edu.2005, 82, 607.3.
Flair, M.; Setzer, W. N. J. Chem. Edu. 1990,67, 795–796.4.
Rancke-Madsen, E., Krogh, J.A. Acta Chem. Scand., 1956, 10, 495-499.5.
Anderson, M.; Buckley, A. J. Chem. Edu.1996, 73, 639-640.6.
Hiemenz, P. C.; Pfeiffer, E. J. Chem. Edu.1972, 49, 263.7.
Tallman, D. E. J. Chem. Edu.1978, 55, 605.8.
Ratliff, J. L. J. Chem. Edu.1997, 74, 710.9.
Anderson, J. L. J. Chem. Edu.1982, 59, 871.10. Davies, R. A., John, N. W., MacDonald, J. N., Hughes, K. H.,
2005, Proceedings of the tenth international conference on 3D Web technology: 3D technologies for the World Wide Web, 143–150.11. Sato, M.; Liu, X.; Murayama, J.; Akahane, K.; Isshiki, M.
LNCS Transactions on Edutainment I, 2008, 5080, 28–39.12. Jones, G. M.; Andre, T.; Superfine, R.; Taylor, R.
J. Res. Sci. Teach., 2003, 40, 303.13. ttp://www.molysym.com/ Last accessed on October 30
th 2007;http://www.nsti.org/Nanotech2004/showabstract.html?absno=873 Last Accessed on October 30th
2007.
14. Goldstein, E.B. Sensation & Perception, 5th ed. Brooks/Cole Publishing Company, California,
1999.15. David J. Echevarria,
Sensation and Perception, Chapter 1, Spring 2008; http://www.usm.edu/neurolab/CourseMaterials.html; (accessed August 2008).16. Moskowitz, H. R.
Crit.l Rev. Food Sci. Nut., 1977, 9, 41-79.18. Sensory Thresholds.
http://www.cliffsnotes.com/WileyCDA/CliffsReviewTopic/topicArticleId-25438,articleId-25322.html. (accessed September 2008).19. Fechner, G. Psychological Research,
1987, 49, 213-219.20. Teghtsoonian, R.
Psych. Rev., 1971, 78, 71-80.21. Weber’s Law of Just Noticeable Differences,
http://www.usd.edu/psyc301/WebersLaw.htm, (accessed September 2008).22. Examples of research on cerebral cortex as it related to perception. Parker, A. J.
Nature Reviews Neuroscience, 2007, 8, 379-391., Engineer, C. T.; Perez, C. A.; Chen, Y. H.; Carraway, R. S.; Reed, A. C.; Shetake, J. A.; Jakkamsetti, V.; Chang, K. Q.; Kilgard, M. P. Nature Neuroscience, 2008, 11, 603-608.; Butler, S. R, Brit. Med. J.1971, 4, 544-7.; Parker, A., J., Krug, K. Current Opinion in Neurobiology, 2003, 13, 433–439. Caselli, R. Mayo Clinic proceedings. 1991, 66, 129-42.23. Martini, F. H.
Fundamentals of Anatomy & Physiology, 5th Edition, 2001, Chapters 16-17, Prentice Hall, NJ.24. Soderquist, D.R.
Sensory Processes, 2002. Sage Publications, California.25. The Eye, http://www.csulb.edu/~cwallis/482/visualsystem/eye.html; (accessed June 2008).
26. Weale, R. A.
Ann. R. Coll. Surg. Engl. 1961, 28, 16–35.27. Kolb, H., Fernandez, E., Nelson, R. Webvision: Light and Dark Adaptation, updated February
2008, http://webvision.med.utah.edu/light_dark.html; (accessed September 2008).28. Rushton, W. A. H.
J. Physiol., 1972, 220, 1-31.29. Barlow, H. B.
Nature,1957, 179, 255 – 256; Anstis, S. Vision Research, 2002, 42, 2485–2491.30. human eye. Encyclopedia Britannica. 2008
.http://www.britannica.com/EBchecked/topic/199272/eye; (Accessed June 2008).
31. Young-Helmholtz three-colour theory Encyclopedia Britannica
, 2008,http://www.britannica.com/EBchecked/topic/654047/Young-Helmholtz-three-colour-theory; (accessed June, 2008).
32. Wald, G. Brown, P.
Science, 1958, 127, 222–249; Wald, G. Nature, 1968,219, 800 – 807.33. Ewald Hering, Encyclopædia Britannica Online, 2008,
34. Color vision deficiency, Reviewed March 2006,
http://ghr.nlm.nih.gov/condition=colorvisiondeficiency; Vision Problems, Updated September, 2006, http://www.nlm.nih.gov/medlineplus/ency/article/003029.htm; (accessed June 2008).
35. Eye Conditions, http://www.ceilasik.com/celc-conditions.htm, (accessed June 2009); Agnosia,
http://www.psychnet-uk.com/dsm_iv/agnosia.htm, (accessed September 2008); Ghadiali, R. ACNR, 2004, 4, 18-20.
36.
Wrong Diagnosis: Statistics on Myopia; Statistics on Astigmatism; Statistics on Hyperopia, updated January 21st 2009, http://www.wrongdiagnosis.com/m/myopia/stats.htm#medical_stats; http://www.wrongdiagnosis.com/h/hyperopia/stats.htm#medical_stats;http://www.wrongdiagnosis.com/a/astigmatism/stats.htm; (accessed January, 2009).
37.
Unite For Sight Refractive Error Module,http://www.uniteforsight.org/course/refractiveerror.php; (accessed June, 2008).
38. human ear, Encyclopedia Britannica, 2008,
http://www.britannica.com/EBchecked/topic/175622/ear; (accessed June 2008).
39. sound
. Encyclopædia Britannica Online. 2008,http://www.britannica.com/EBchecked/topic/555255/sound. (accessed September 2008).
40. Geldard, F. The Human senses, 2nd edition, 1972, John Wiley & Sons, Inc., New York.
41. Noise exposure associated with marching and pep bands: measurements, assessment of risks,
and possible solutions; http://www.duke.edu/~jak21/physics.html, (accessed September 2008).
42. MedlinePlus: Hearing, Ear Infections, and Deafness, NIDCD, updated 2008,
http://www.nidcd.nih.gov/health/hearing/; (accessed June, 2008).
43. An Educator's Guide to Hearing Disability Issues,
http://www.ed.uiuc.edu/wp/access/hearing.html; (accessed June, 2008).
44. Hearing Loss May Be More Widespread Than Thought, updated 2000,
http://www.nlm.nih.gov/medlineplus/news/fullstory_67460.html; (accessed September, 2008).
45. Hearing Loss, updated July 2008;
http://www.dizziness-and-balance.com/disorders/hearing/hearing.html; (accessed January 2009).