A Predictive Model for the Relative Differences between Nonlinear and
Equivalent-Linear Site Response Analyses
Byungmin Kim1, Youssef M. A. Hashash2, Albert R. Kottke3, Dominic Assimaki4, Wei Li5, Ellen M. Rathje6, Kenneth W. Campbell7, Walter J. Silva8, and Jonathan P. Stewart9
1Postdoctoral researcher, Dept. of Civil and Environmental Engineering, University of Illinois at Urbana-Champaign, IL ([email protected])
2Professor, Dept. of Civil and Environmental Engineering, University of Illinois at Urbana-Champaign, IL ([email protected])
3Engineer, Bechtel Corporation, San Francisco, CA
4Professor, School of Civil and Environmental Engineering, Georgia Institute of Technology, Atlanta, GA 5Project Engineering Associate, Paul C. Rizzo Associates
6Professor, Dept. of Civil, Architectural and Environmental Engineering, University of Texas, Austin, TX 7Vice President, EQECAT, Inc., Oakland, CA
8Pacific Engineering and Analysis, Inc., El Cerrito, CA
9Professor and Chair, Dept. of Civil and Environmental Engineering, University of California at Los Angeles, CA
ABSTRACT
This study investigates the nonlinear amplification of ground motion in site response analysis, with the particular goal of providing guidance on the conditions for which nonlinear (NL) approaches provide results distinct from otherwise similar equivalent-linear (EL) approaches. Relative differences in spectral accelerations computed by NL and EL site response analyses are assessed for different periods using NL and EL site response simulation results by Assimaki and Li (2012) for 23 strong motion accelerograph sites in California and one downhole array site in Japan subject to 510 synthetic ground motions. Site and ground motion parameters investigated for their effect on nonlinear response include the time-averaged shear-wave velocity in the top 30 m of the soil profile (VS30), site amplification at the
fundamental frequency (Amp), peak ground acceleration and peak ground velocity of incident motions (PGAin and PGVin, respectively), and estimated strain (est=PGVin/VS30). We find that the soil nonlinearity
is most clearly dependent on est, with an upper-bound threshold of approximately 0.1 % identifying
conditions where EL and NL results are similar. For est > 0.4 %, it is recommended that a greater weight
be given to the NL approach because the spectral accelerations computed by NL and EL analyses differ by more than 30 %, particularly for short periods (T ≤ 0.55 sec). For longer periods (T ≥ 1.0 sec), the differences between spectral accelerations by nonlinear and equivalent-linear site responses are relatively small.
INTRODUCTION
An equivalent-linear (EL) site response analysis approximates the nonlinear response of soil using strain-compatible time-invariant soil properties, and provides reasonable estimation of ground response for many situations. Time domain nonlinear (NL) site response computes the dynamic response of the soil at each time step. This more rigorous approach can better capture soil behavior under large strains such as for soft soil sites subject to strong ground motions, but it is computationally expensive and requires the use of input parameters (such as Rayleigh damping) that are relatively unfamiliar for most engineers. Due to the advantages and disadvantages of these two approaches, the conditions under which the two methods produce consistent and divergent estimates of site amplification are of practical interest.
they noted that this threshold is likely too high. Matasovic and Hashash (2012) also reported that ground motion intensity measures alone cannot be sufficient to indicate the soil nonlinearity because strain levels in soft soils can be quite high even for low levels of shaking.
Recently, Kaklamanos et al. (2013) tested the accuracy and precision of linear and equivalent-linear site response analyses using 100 KiK-net downhole arrays in Japan to provide thresholds for the selection of linear, equivalent-linear, and nonlinear methods with respect to the maximum shear strain computed from site response analysis. They proposed that the EL approach is sufficient below the EL-NL transition zone, defined when the maximum shear strains range from 0.1 % to 0.4 %. A disadvantage of this approach is that a full site response analysis is required to estimate the strains from which the appropriate type of analysis is judged, which will be inefficient in many cases.
Assimaki and Li (2012) proposed an empirical relationship between soil nonlinearity and site and ground motion parameters that can be identified a priori (i.e., prior to running a response analysis). They compared the amplification of spectral accelerations computed by (1) commonly used site response analysis methods (i.e., the linear visco-elastic (LIE) and the equivalent-linear); (2) empirical equations given by Boore and Atkinson (2008); and (3) nonlinear site response analyses using the modified Kondnor and Zelasko (MKZ) hyperbolic model (Matasovic and Vucetic 1993). Assimaki and Lee (2012) performed their calculations in such a way that the small-strain modulus reduction and damping behavior in the NL and EL models is practically identical. They found that the divergence of predicted amplification levels is least pronounced between EL and NL models, whereas the divergence between LIE and NL is more pronounced and shows clear dependency on various parameters such as the peak ground acceleration of rock outcrop and the VS30.
This study extends the work by Assimaki and Li (2012) to develop a predictive model for the relative differences between amplification levels estimated by EL and NL site response analyses. Our intent is to provide guidelines for a priori identification of conditions for which NL methods should be considered in lieu of EL for seismic site response analysis.
SITE RESPONSE SIMULATIONS
Assimaki and Li (2012) performed site response analyses for 24 strong motion accelerograph sites (23 sites in California and one in Kobe, Japan) used in previous site response calibration work by Baturay and Stewart (2003) (http://www.cee.ucla.edu/faculty/stewart/research). Eight sites are in National Earthquake Hazards Reduction Program (NEHRP) site class C (Building Seismic Safety Council (BSSC) 2004), 11 are class D, and five are class E. The VS30 values for these sites vary from 142 m/sec to 692
m/sec. Broadband ground motion synthetics were computed on the rock outcrop for multiple rupture scenarios of a strike-slip fault using a crustal model extracted from the Southern California Earthquake Center Community Velocity Model 4 (SCEC CVM-4) ( http://www.data.scec.org/research-tools/3d-velocity.html), and were evaluated using a dynamic rupture source model by Liu et al. (2006). More details on the ground motion synthetics and the dynamic soil properties at these accelerograph sites can be found in Assimaki and Li (2012), Assimaki et al. (2008), and Anderson (2003). The response spectra of the 510 incident ground motions used for the site response simulations by Assimaki and Li (2012) are shown in Figure 1. The PGA values of incident ground motions range from approximately 0.03 g to 0.87 g with a median of approximately 0.1 g. The examples of response spectra computed on the ground surface by the EL and the aforementioned NL approaches are shown in Figure 2. Two sites with different VS30 values (691.7 m/sec for Lick Observatory in Santa Cruz (LOB) and 258.3 m/sec for La Ciengega in
Los Angeles (LAC)) and two incident motions with different levels of shaking (motion #1 with PGA = 0.07 g and motion #2 with PGA = 0.3 g) were selected for comparison. When the incident motion #1 (weaker motion) is propagated through the station LOB (stiffer site), the differences between spectral accelerations computed by EL and NL methods (SaEL and SaNL, respectively) are negligible. However
Figure 1. Response spectra for 510 incident synthetic motions used by Assimaki and Li (2012).
LOB: VS30 = 691.7 m/sec LAC: VS30 = 258.3 m/sec
Inci
den
t m
ot
ion #1
PG
A
= 0.07 g
Inci
den
t m
ot
ion #2
PG
A
= 0.3 g
PROPOSED MODEL FOR DIFFENCES BETWEEN EQUIVALENT-LINEAR AND NONLINEAR SITE RESPONSES
We computed SaEL/SaNL (also equivalent to the ratio of amplification factors) for all of the 12,240
site response simulation results (510 incident motions × 24 sites) to differentiate between the computed EL and NL responses. This comparison focused only on relative differences between the EL and NL methods and does not consider performance relative to observed ground motions.
We regressed SaEL/SaNL against numerous ground motion and site parameters to test their
predictive power. Parameters that were considered include: (1) ground motion intensity measures such as PGA and Peak Ground Velocity (PGV) of the incident ground motion (PGAin and PGVin, respectively);
(2) site parameters such as VS30 and amplification at the fundamental mode site frequency; and (3)
composite parameters representing intensity measures and site parameters such as estimated shear strain est = PGVin/VS30 (e.g., Idriss 2011) and frequency index (FI). Assimaki and Li (2012) introduced the
frequency index (FI) which is defined as the normalized cross-correlation between the amplitude of the linear transfer function of the site and Fourier amplitude spectrum of the incident motion.
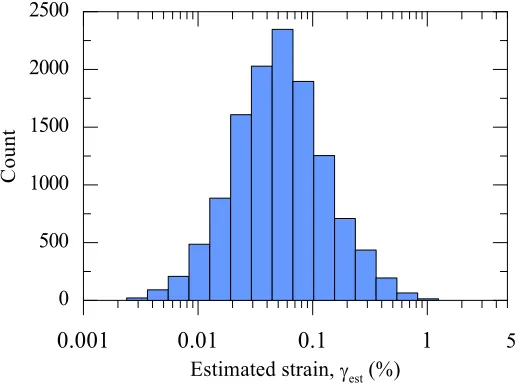
Among the considered parameters, we found that estimated strain (γest) correlates most strongly
with relative differences between SaEL and SaNL. The Assimaki and Li (2012) data set produces the
distribution of γest shown in Figure 3, which appears to be log-normal with median = 0.06 % and a range
of 0.003 to 1.0 %. The relationship between SaEL/SaNL and γ
est can be expressed as:
2
1
1
1
c est NL
EL
c
Sa
Sa
(1)where γest is the estimated strain, c1 and c2 are regression coefficients, and ε is the residual.
Figure 4 shows SaEL/SaNL from simulations against γ
est along with the proposed regression models
from Eq. (1) for nine selected periods. The regression coefficients c1 and c2 are summarized in Table 1.
The proposed models are generally in good agreement with binned mean values of SaEL/SaNL (equally
spaced on log scale of γest). The difference between SaEL
and Sa
NL for PGA (T = 0.00 sec Sa) is negligiblefor the entire estimated strain range. For other short periods (T = 0.10, 0.18, 0.32, and 0.55 sec), SaEL
/Sa
NLFigure 4. Ratio of SaEL to SaNL from site response simulation results and the regression models in terms of
Table 1. Regression coefficients for the relationship between SaEL/SaNL and estimated strain, γ
est (Equation
1) for different periods.
Period (sec) Regression coefficients
c1 c2
0.01 0.0010 2.0000
0.10 0.8587 1.0541
0.18 1.2510 1.0920
0.32 1.5237 1.4465
0.55 0.8214 1.6012
1.00 0.0010 0.3325
1.80 0.0010 0.2795
3.20 0.0010 0.3316
5.00 0.0010 0.4064
decreases abruptly at about γest = 0.1 %. For longer periods (T = 1.00, 1.80, 3.20, and 5.00 sec), the
SaEL
/Sa
NL decreases slightly with γest, and does not become less than 0.8 at large γest ranges (~1 %). Figure
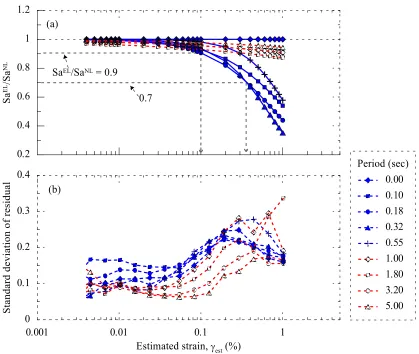
5(a) presents the regression models for all nine selected periods. For relatively short periods (approximately 0.18 to 0.32 sec), SaEL
/Sa
NL decreases continuously as γest increases, and becomes 0.9
(SaEL is smaller than SaNL by 10%) at γ
est = 0.1 % and 0.7 at γest = 0.36 %. Standard deviations of residuals
, denoted σres, are shown in Figure 5(b) for different periods. The standard deviations of residual remain
small (σres < 0.2 for T ≤ 0.55 sec and σres < 0.15 for T ≥ 1.00 sec) for γest < 0.1 % in spite of large amount
of data. At γest > 0.1 %, σres increases to approximately 0.3.
The regression models for other parameters, using the same functional form as employed for γest
(Equation 1) are shown in Figure 6. The significant differences between SaEL
and Sa
NL (SaEL/ Sa
NL ~ 0.7)occur at large PGAin (at about 0.7 g) and PGVin (at about 1 m/s). The dependency of SaEL
/ Sa
NL on PGAinand PGVin is not as clear as that on estimated strain. SaEL
/ Sa
NL does not show clear dependency on otherparameters such as VS30, Amp, and FI.
DISCUSSION
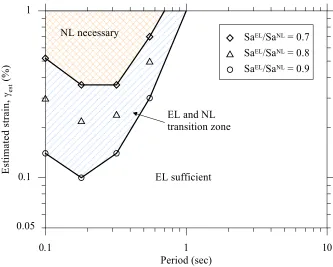
To more clearly identify the conditions for which NL analysis results were found to be distinct from EL, we synthesize in Figure 7 the γest values at which SaEL/SaNL from predictive models are 0.7, 0.8,
and 0.9, as a function of spectral period. EL and NL results are similar for all periods when γest is smaller
than 0.1 % (marked as ‘EL sufficient’). An EL method is also sufficient for long periods (T > 1.0 sec) regardless of level of γest. The transition zone between EL and NL methods is proposed in terms of γest for
short periods (T < 1.0 sec), where it is recommended equal weights be given to both methods. For T ~ 0.2 sec, the transition zone between EL and NL methods is defined at γest = 0.1 – 0.4 %. When γest exceeds 0.4
%, the differences between SaEL and SaNL become significant. Therefore, a greater weight for site
This recommendation is comparable with that by Kaklamanos et al. (2013) who proposed a threshold for EL and NL methods based on the comparison between observed recordings and results of site response analyses at KiK-net stations in Japan. They proposed the transition zone for EL and NL methods at maximum shear strain computed from site response analysis = 0.1 – 0.4 % for short periods (T ≤ 0.6 sec) below which an EL method is sufficient and above which an NL method is necessary. They also proposed that an EL method is sufficient for T > 0.6 sec at any level of maximum shear strain. The threshold recommended by this study is also consistent with the results of site response analyses conducted by Kim and Hashash (2013) for KiK-net stations subject to the 2011, MW9.0, Tohoku-oki
earthquake and other smaller earthquakes in Japan. They reported that the differences between SaEL and SaNL are significant for stations with the maximum shear strains computed from site response analysis
greater than 0.3 %.
Figure 5. (a) Predictive models for the ratio of spectral accelerations computed by EL (SaEL) to those by
NL (SaNL) and (b) standard deviations of residual of predictive models for SaEL/ SaNL with respect to the
Figure 6. Predictive models of SaEL/ SaNL for : (a) PGA
in; (b) PGVin; (c)VS30; (d) Amp; and (e) FI.
CONCLUSIONS
This paper extended the study by Assimaki and Li (2012) to investigate the relative differences between equivalent-linear and nonlinear site response analysis approaches. Among various ground motion and site parameters, we found that the γest, which can be estimated by PGVin/VS30, is the best indicator for
divergent ground motion estimates from the two methods of analysis, as measured by SaEL
/Sa
NL.There is no significant difference between SaEL and SaNL at T = 0.00 sec. For longer periods (T =
1.00 sec to 5.00 sec), SaEL/SaNL slightly decreases as γ
est becomes larger. For shorter periods (T = 0.10 sec
to 0.55 sec), SaEL/SaNL abruptly decreases at large strains, and becomes 0.9 at γ
est ~ 0.1 % and 0.7 at γest ~
0.36 %. Therefore, we propose γest = 0.1 % as a threshold below which soil nonlinearity is equally
captured by both EL and NL methods. At γest ≥ 0.1 %, the SaEL is smaller than the SaNL by 10 – 30 % at
periods between 0.10 and 1.00 sec. Thus, the EL methods cannot be solely relied on at γest ≥ 0.1 %, and it
is recommended that NL method be integrated into site response analysis. At γest ≥ 0.4 %, we recommend
Figure 7. Guideline for a threshold between equivalent-linear (EL) and nonlinear (NL) site response analysis in terms of estimated strain, γest, and period. The γest values at which SaEL/SaNL of predictive
models = 0.7, 0.8, and 0.9 are presented. (Framework of the figure after Kaklamanos (2013))
ACKNOWLEDGEMENT
This study was sponsored by the Pacific Earthquake Engineering Research Center (PEER) as part of NGA-East, a project funded by the U.S. Nuclear Regulatory Commission (NRC), the U.S. Department of Energy (DOE) and the Electric Power Research Institute (EPRI), with the participation of the U.S. Geological Survey (USGS). Any opinions, findings, and conclusions or recommendations expressed in this material are those of the authors and do not necessarily reflect those of the organizations listed above.
REFERENCES
Anderson, D. G. (2003). Laboratory testing of nonlinear soil properties: I & II, Technical report, CH2M HILL, Lifelines Research Program, Pacific Earthquake Engineering Research Center, University of California at Berkeley,: 34 pages.
Assimaki, D. and W. Li (2012). "Site- and ground motion-dependent nonlinear effects in seismological model predictions." Soil Dynamics and Earthquake Engineering 32(1): 143-151.
Assimaki, D., W. Li, J. Steidl and J. Schmedes (2008). "Quantifying nonlinearity susceptibility via site-response modeling uncertainty at three sites in the Los Angeles basin." Bulletin of the Seismological Society of America 98(5): 2364-2390.
Baturay, M. B. and J. P. Stewart (2003). "Uncertainty and bias in ground-motion estimates from ground response analyses." Bulletin of the Seismological Society of America 93(5): 2025-2042.
Building Seismic Safety Council (BSSC) (2004). NEHRP recommended provisions and commentary for seismic regulations for new buildings and other structures (FEMA 450), 2003 edition. Washington, D.C., National Institute of Building Sciences.
Idriss, I. M. (2011). Use of Vs30 to represent local site conditions. 4th LASPEI/IAEE International Symposium Effects of Surface Geology on Strong Ground Motions. Santa Barbara, California. Kaklamanos, J., B. A. Bradley, E. M. Thompson and L. G. Baise (2013). "Critical parameters affecting
bias and variability in site response analyses using KiK-net downhole array data." Bulletin of the Seismological Society of America 103(3).
Kim, B. and Y. M. A. Hashash (2013). "Site response analysis using downhole array recordings during the March 2011 Tohoku-oki earthquake and the effect of long-duration ground motions." Earthquake Spectra 29(S1): page S1-S18.
Liu, P., R. J. Archuleta and S. H. Hartzell (2006). "Prediction of broadband ground-motion time histories: Hybrid low/high-frequency method with correlated random source parameters." Bulletin of the Seismological Society of America 96(6): 2118-2130.
Matasovic, N. and Y. Hashash (2012). NCHRP428: Practices and procedures for site-specific evaluations of earthquake ground motions (A synthesis of highway practice). Washington, D.C., National Cooperative Highway Research Program, Transportation Research Board: 78 pages.