1
Why You Should Prefer Low Volatility ETFs
Gil Cohen *
Abstract
Low volatility ETFs have become popular in recent year because investors are starting to
understand the advantages involved in investing in those ETFs compared to traditional
index investment. In this research I have examined the performance of six popular low
volatility ETFs, four of them invest in U.S stocks and the other two invest in other
developed and emerging markets. Results have pointed out that not only five of the low
volatility ETFs have exposed their investors to lower risk, four of them have also produced
higher returns. The advantage of investing in low volatility ETFs is prominent in the U.S
stock market. All three sizes of stocks categories (Large, Mid and Small Capitalization) low
volatility ETFs have outperformed their indexes bench marks in terms of risk and returns.
For the non U.S stock investing, while no advantage have been found for investing in low
volatility ETFs for developed countries, significant lower risk was found for emerging
markets.
Dr. Gil Cohen, Carmel Academic Center Business School, Haifa, Israel Shar Palmer 4 Haifa, Israel
.
[email protected]Keywords: Low volatility, ETFs, Anomaly
2
1.
Introduction
In recent years low volatility stocks have become more and more popular among investor
who seeks steady growth with as little as possible volatility. Achieving those goals along
with a substantial diversification is possible throughout investing in the fast growing
industry of low volatility ETFs. In addition to diversification, low volatility ETFs should
offer lower risk than index investing strategy. These merits of low volatility ETFs are most
welcome by investors, however, most of them associate low volatility stocks with low
returns and for that reason they rather follow the major indexes. The perception that a
portfolio that contains lower risk can achieve higher return than the index bench mark
counter to the fundamental economic principle that risk is compensated with higher
expected return and therefore ignored by some investors. Past researches have tried to
explain why low volatility and low beta stocks have offered high average returns associated
with lower risk than high volatility and high beta stocks. Ang et al. (2006, 2009) find that
high volatility stocks have had “abysmally low returns” in U.S. samples and in international
markets. Blitz and Vliet (2007) provide an analysis of the volatility anomaly across regions.
Baker et al. (2011) have proposed explanation to the low volatility that combines the
average investor's preference for risk and the typical institutional investor’s mandate to
maximize the ratio of excess returns and tracking error relative to a fixed benchmark
without resorting to leverage. No extensive research has been conducted on low volatility
ETFs since they started to develop in 2011and the number of such ETFs is growing ever
since, insinuating that investors are realizing their benefits.
In the following research I examined the performance and risk of six major low volatility
ETFs. Those it ETFs were chosen because they represent investment in varies segments of
3
leading this segment in market value1. The chosen ETFs are: USMV (MSCI minimum
volatility USA), SPLV (S&P low volatility), XMLV (S&P Mid Cap low volatility), XSLV
(S&P Small Cap low volatility), EFAV (MSCI min volatility EAFE) and EEMV (MSCI
min volatility emerging markets). We start our analysis by calculating average monthly
returns and standard deviations of our six low volatility ETFs and compare them to their
bench marks. Than we apply the "market model" in order to examined "alphas" and "Betas"
of our low volatility ETFS.
2.
Results
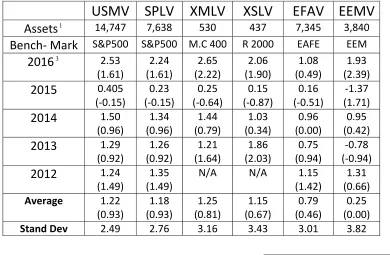
Table 1 summarizes the average monthly return for each ETF and its Bench mark2.
Table 1: Average Monthly Return of examined ETFs and their Benchmarks
USMV
SPLV
XMLV
XSLV
EFAV
EEMV
Assets
1 14,747 7,638 530 437 7,345 3,840Bench- Mark
S&P500 S&P500 M.C 400 R 2000 EAFE EEM2016
3 2.53(1.61) 2.24 (1.61) 2.65 (2.22) 2.06 (1.90) 1.08 (0.49) 1.93 (2.39)
2015
0.405(-0.15) 0.23 (-0.15) 0.25 (-0.64) 0.15 (-0.87) 0.16 (-0.51) -1.37 (1.71)
2014
1.50(0.96) 1.34 (0.96) 1.44 (0.79) 1.03 (0.34) 0.96 (0.00) 0.95 (0.42)
2013
1.29 (0.92) 1.26 (0.92) 1.21 (1.64) 1.86 (2.03) 0.75 (0.94) -0.78 (-0.94)2012
1.24(1.49)
1.35 (1.49)
N/A N/A 1.15 (1.42)
1.31 (0.66)
Average 1.22 (0.93) 1.18 (0.93) 1.25 (0.81) 1.15 (0.67) 0.79 (0.46) 0.25 (0.00)
Stand Dev 2.49 2.76 3.16 3.43 3.01 3.82
1 More than 400 million dollar each.
4
(3.07) (3.07) (3.44) (4.18) (3.89) (4.73)
Max 5.98 (8.29)
6.87 (8.29)
7.64 (8.31)
9.34 (7.75)
7.23 (7.82)
9.22 (12.96)
Min -4.53
(-6.26)
-5.04 (-6.26)
-5.80 (-5.78)
-5.69 (-8.84)
-7.48 (-11.14)
-9.32 (-10.70)
Average/Stand Dev
0.49 (0.30)
0.42 (0.30)
0.39 (0.23)
0.33 (0.16)
0.26 (0.12)
0.06 (0.00) Notes: 1. Assets in Millions of U.S dollars as for 1.7.16. 2. M.C 400=Mid Cup 400 Index. R 2000= Russell 200 Small Cup Index. EAFE=MSCI EAFE Index composed of large-and mid-capitalization developed market equities, excluding the U.S. and Canada. EEM= MSCI emerging markets Index. 3. Average monthly returns January until Jun 2016. 4. The average monthly return of the bench mark is shown in the brackets.
Table 1 results are quite astonishing, all examine ETFs have produced a higher average
monthly return for the entire sample, along with a smaller risk. That means that any
investor that wants to invest in indexes of the U.S capital market, large, Middle or
Small market capitalization, is better off if he or she invest in their low volatility ETFs
counterparts. Moreover, similar results have been demonstrated for large non U.S and
Canada stocks or in emerging markets stocks. For large cup U.S stocks, the only year
that the S&P500 has outperformed the USMV and SPLV ETFs was 2012 while in all
other examined years the opposite have occurred with much larger average monthly
return differences. XMLV and XSLV have outperformed their bench marks Mid Cup
400 and Russell 200 indexes, for the years 2014-2016, failing to do so at 2013. Less
impressive results have been found for the Non U.S stocks ETFs, on average as
mentioned above investors are better off investing in the low volatility ETFs rather than
investing in the Indexes however the excess return is unstable along the examined
years.
5
)
(
R
.Rf
Rf
R
ETF−
=
α
+
β
BM−
(1)Where: RETF= weekly return of the low volatility ETF, RB.M=weekly returns on the
Bench Mark index, Rf = risk free rate.
Table 2: Large U.S Stocks Low Volatility ETFS Regressions Results
ETF Year
α
β
F R2 adjR2 NUSMV 2012-2016 0.12* (3.27) 0.72* (33.49)
1122 0.82 0.82 234
2016 0.35*
(2.70)
0.70* (10.88)
118 0.83 0.82 26
2015 0.11
(1.31)
0.71* (16.27)
265 0.84 0.83 52
2014 0.14*
(2.61)
0.75* (22.09)
488 0.90 0.90 52
2013 0.00
(0.026)
0.83* (12.28)
150 0.75 0.74 52
2012 0.08
(1.08)
0.67* (16.84)
284 0.83 0.83 52
SPLV 2012-2016 0.18* (2.45) 0.71* (25.12)
631 0.73 0.73 234
2016 0.36*
(2.18)
0.70* (8.54)
73 0.75 0.74 26
2015 0.08
(0.82)
0.74* (13.95)
194 0.79 0.79 52
2014 0.17*
(2.134)
0.71* (13.89)
193 0.79 0.79 52
2013 -0.03
(-0.27)
0.84* (9.13)
84 0.62 0.61 52
2012 0.09
(1.06)
0.60* (11.88)
141 0.74 0.73 52
Notes: 1. USMV= MSCI minimum volatility USA, SPLV= S&P 500 low volatility.
2 . *=statistically significant at 95% confidence level. 3. The T statistics appears in the
brackets.
Table 2 show that for the entire examined period (2012-2016) both large cap low
volatility ETFs (USMV and SPLV) have achieved a positive statistically significant
weekly abnormal return (0.12 and 0.18 respectively). Both ETFs have achieved those
6
S&P5003. Analyzing the results year by year demonstrates that for both USMV and
SPLV a positive significant abnormal return was achieved at 2014 and 2016 with a
lower consistent significant lower risk for all the tested years. These results are
consistent with the results summarized in Table 1 and have proven that an abnormal
return measured by the well-known market model exists. Table 3 summarizes
regressions results for Mid Cap and Small Cap U.S stocks low volatilities ETFs
(XMLV and XSLV).
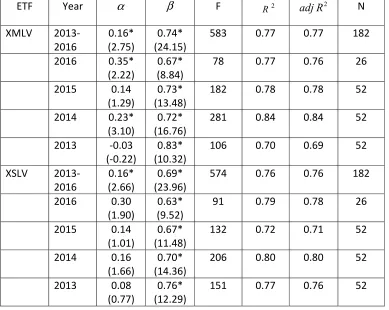
Table 3: Mid Cap and Small Cap U.S Stocks Low Volatility ETFS Regressions
Results
ETF Year
α
β
F R2 adjR2 NXMLV 2013-2016 0.16* (2.75) 0.74* (24.15)
583 0.77 0.77 182
2016 0.35*
(2.22)
0.67* (8.84)
78 0.77 0.76 26
2015 0.14
(1.29)
0.73* (13.48)
182 0.78 0.78 52
2014 0.23*
(3.10)
0.72* (16.76)
281 0.84 0.84 52
2013 -0.03
(-0.22)
0.83* (10.32)
106 0.70 0.69 52
XSLV 2013-2016 0.16* (2.66) 0.69* (23.96)
574 0.76 0.76 182
2016 0.30
(1.90)
0.63* (9.52)
91 0.79 0.78 26
2015 0.14
(1.01)
0.67* (11.48)
132 0.72 0.71 52
2014 0.16
(1.66)
0.70* (14.36)
206 0.80 0.80 52
2013 0.08
(0.77)
0.76* (12.29)
151 0.77 0.76 52
Notes: 1. XMLV= S&P Mid Cap low volatility, XSLV= S&P Small Cap low volatility.
2 . *=statistically significant at 95% confidence level. 3. The T statistics appears in the
brackets.
7
Table 3 shows that for both Mid and Small Cap stocks, low volatility ETFs have
gained better returns for the entire sample with lower risk (26 and 31 percent less risk
than their bench marks), making does ETFS superior to the indexes they follow. The
XMLV has significantly outperformed its bench mark Mid Cap400 index at 2014 and
2016; however, the associated risk was much lower than the index for all years of the
ETF existence. The XSLV has outperformed its bench mark Russel 2000 index for, as
mentioned before, the entire period of time and nearly significant outperformance at
2016. Again the XSLV has offered its investors much lower risk for each of its
existence years. Table 4 summarizes regressions results for EAFE4 and EEM 5stocks
low volatilities ETFs (EFAV and EEMV).
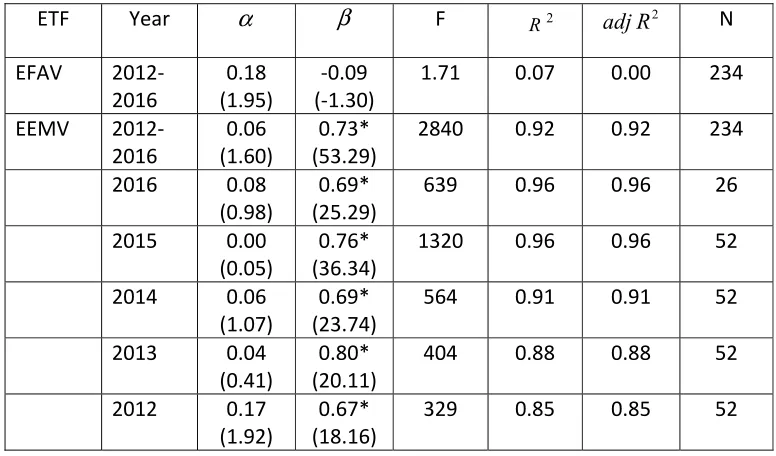
Table 4: Non U.S EAFE and Emerging Markets Stocks Low Volatility ETFS
Regressions Results
ETF Year
α
β F R2 adjR2 NEFAV 2012-2016
0.18 (1.95)
-0.09 (-1.30)
1.71 0.07 0.00 234
EEMV 2012-2016
0.06 (1.60)
0.73* (53.29)
2840 0.92 0.92 234
2016 0.08
(0.98)
0.69* (25.29)
639 0.96 0.96 26
2015 0.00
(0.05)
0.76* (36.34)
1320 0.96 0.96 52
2014 0.06
(1.07)
0.69* (23.74)
564 0.91 0.91 52
2013 0.04
(0.41)
0.80* (20.11)
404 0.88 0.88 52
2012 0.17
(1.92)
0.67* (18.16)
329 0.85 0.85 52
Notes: 1. EFAV= MSCI minimum volatility EAFE, EEMV= MSCI minimum volatility
emerging markets. 2 . *=statistically significant at 95% confidence level. 3. The
T statistics appears in the brackets.
8
Table 4 shows that there is no return or risk advantage investing in low volatility ETF
(EFAV) over investing in MSCI Non U.S and Canada developed countries index
(EAFE). This result was true for the entire examined period and also for all specific
years6. On the other hand investing in low volatility EEMV ETF has proven fertile to
investors since it produced a significant averaging 27% less risk than investing in MSCI
emerging market index. No statistically significant abnormal return has been found
although it was near significance at 2012.
3.
Summary and Conclusions
Low volatility ETFs have become popular in recent year because investors are starting to
understand the advantages involved in investing in those ETFs compared to traditional
index investment. The industry of low volatility ETFs have started to emerge mostly at
2011 and is expanding ever since. In this research I have examined the performance of six
popular low volatility ETFs, four of them invest in U.S stocks and the other two invest in
other developed and emerging markets. First I have documented monthly average returns
and standard deviations of those six ETFs and compared them to their Bench marks return.
All six low volatility ETFs have proven better return to risk ratio than their bench marks.
Second, I have used the market model in order to measure abnormal return and risk. Results
have pointed out that not only five of the low volatility ETFs have exposed their investors
to lower risk, four of them have also produced higher returns. The advantage of investing in
low volatility ETFs is prominent in the U.S stock market. All three sizes of stocks
categories (Large, Mid and Small Capitalization) low volatility ETFs have outperformed
their indexes bench marks in terms of risk and returns. For the non U.S stock investing,
9
while no advantage have been found for investing in low volatility ETFs for developed
10
References
Ang, Andrew, R. Hodrick, Y. Xing, X. Zhang (2006). “The Cross-Section of Volatility and Expected Returns.” Journal of Finance, 61, pp. 259-299.
Ang A, R. Hodrick, Y. Xing, X. Zhang (2009), “High Idiosyncratic Volatility and Low Returns: International and Further U.S. Evidence”. Journal of Financial Economics, 91, pp. 1-23.
Baker, M. B Bradley and J. Wurgler (2011) ," Benchmarks as Limits to Arbitrage: Understanding the Low-Volatility Anomaly". Financial Analysis Journal, 67,1.