Lungs
Nodule
Detection
using
Semantic
Segmentation
and
Classification
with
Optimal
Features
Talha Meraj1 · Arslan Hassan2 ·
Saliha Zahoor3 · Hafiz Tayyab Rauf4 ·
M.IkramUllah Lali 5 · liaqat Ali6 · Syed
Ahmad ChanBukhari*7
Abstract Lungcancerisa deadlydiseaseifnot diagnosedinitsearlystages. However, early detection of lung cancer is a challenging task due to the shape and size of its nodules. Radiologists need support from automated toolsfor precise opinion. Automated detectionof the affected lungsnodule is difficult because of the shape similarityamong healthy tissues.Over the years,several expert systems have beendeveloped thathelp radiologiststo diagnose lung cancer. In this article, we propose a framework to precisely detectlungscancerby classifyingitbetweenbenign andmalignant nodules.
Talha Meraj1
Department of Computer Science, University of Gujrat, Gujrat, Pakistan. E-mail: [email protected]
Arslan Hassan2
Department of Computer Science, University of Gujrat, Gujrat, Pakistan. E-mail: [email protected]
Saliha Zahoor3
Department of Computer Science, University of Gujrat, Gujrat, Pakistan. E-mail: [email protected]
Hafiz Tayyab Rauf4
Department of Computer Science, University of Gujrat, Gujrat, Pakistan. E-mail: [email protected]
M.IkramUllah Lali5
Department of Computer Science, University of Gujrat, Gujrat, Pakistan. E-mail: [email protected]
liaqat Ali6
School of Information and Communication Engineering, University of Electronic Science and Technology of China (UESTC), Chengdu 611731, China.
E-mail: engr [email protected]
Syed Ahmad Chan Bukhari*7( )
Division of Computer Science, Mathematics and Science (Healthcare Informatics), College of Professional Studies, St. John’s University, New York.
Corresponding should be addressed to Syed Ahmad Chan Bukhari ([email protected])
The framework is tested using the subset of the publicly available at the Lung Image Database Consortium image collection (LIDC-IDRI). Multiple techniques including filtering and noise removing are applied for pre-processing. Subsequently, the OTSU and the semantic segmentation are used to accurately detect the unhealthy lungs nodules. In total, 13 nodules features were extracted using Principal Components Analysis (PCA) algorithm. Four optimal features are selected based on the classification performance. In the classification phase, 9 different classifiers are used along with two types of validation schemes i.e. train test holdout validation with 70-30 data split and 10 fold cross-validation. Our experiments show that the proposed system provides 99.23% accuracy using logic boost classifier.
Keywords Computer-aided detection (CAD) system · Computerized Tomography (CT) scan·acquisition·Segmentation·Classification·Principal Components Analysis (PCA)
1 Introduction
1.1 Problem statement and contributions
Precise segmentation of nodules from the lobes region is a challenging task. In the lobes region, there are some vessels & trachea which is hard to differentiate. There are many noisy and less improved features used in existing CAD systems which cause a compromised accuracy. In this article, we introduce a novel technique to accurately segment nodules from the lobes using semantic seg-mentation. As a result, accurate size and location calculation of the geometric features of the lesion area are made possible. Additionally, we propose a new framework for nodules extraction and classification using CT scans. Our other significant contributions are:
1. The dataset design from LIDC includes high intensity based images. We performed the pre-processing for OTSU segmentation. The proposed meth-ods of segmentation are OTSU and Semantic Segmentation using CNN that are more helpful for better results of segmentation.
2. Optimal features have been used to classify the malignant and benign nodules using size measurement of nodules and the other texture, statistical features of nodules. In proposed methodology, segmentation & classification of nodules is improved.
3. Using the semantic segmentation the accuracy of classification is improved in term of recall, reduction of false positive, miss-classification and the accuracy which is increased upto 99.23% using 10 cross fold with dataset of 110 images.
The rest article is divided into 4 sections, Section 2 explains the literature review and Section 3 explains the proposed methodology whereas Section 4 & 5 exhibits the results and concludes the research.
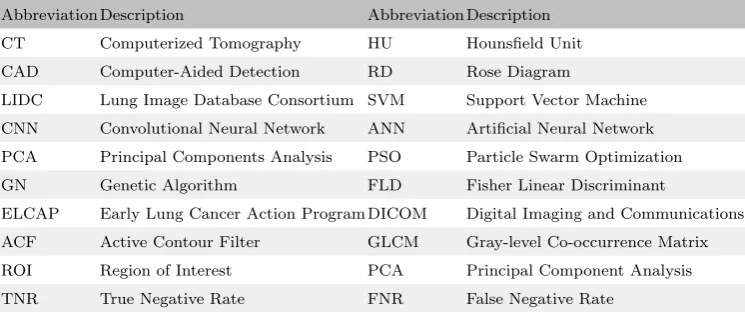
Abbreviation Description Abbreviation Description
CT Computerized Tomography HU Hounsfield Unit
CAD Computer-Aided Detection RD Rose Diagram
LIDC Lung Image Database Consortium SVM Support Vector Machine
CNN Convolutional Neural Network ANN Artificial Neural Network
PCA Principal Components Analysis PSO Particle Swarm Optimization
GN Genetic Algorithm FLD Fisher Linear Discriminant
ELCAP Early Lung Cancer Action Program DICOM Digital Imaging and Communications
ACF Active Contour Filter GLCM Gray-level Co-occurrence Matrix
ROI Region of Interest PCA Principal Component Analysis
TNR True Negative Rate FNR False Negative Rate
2 Literature Review
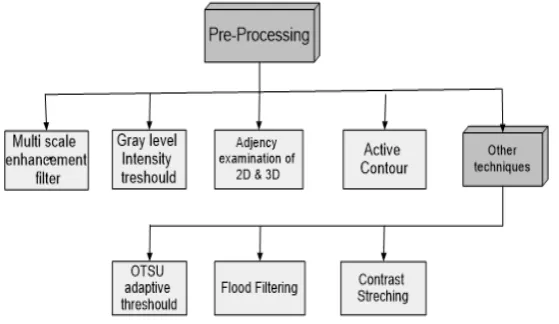
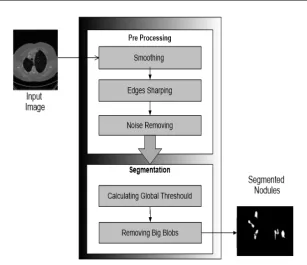
In the design of a CAD system, the LUNG CT scan images are taken into digital form. Different datasets of the LUNG CT scans are publicly available which are used in training and testing. Some publicly available datasets are LIDC [26], TIME1, TIME2, ANOD09 and ELCAP [10].In figure 1 different preprocessing techniques are presented to enhance the quality of image.
Fig. 1: Pre-processing techniques
2.1 Preprocessing
The first important step is image pre-processing where several techniques are used to enhance the image quality.1. There are different techniques like multi-scale enhancement filters of point and line to the volumetric data [22]. The grey level intensity threshold [17], adjacency examination, labeling & 3D pre-processing adjacency examination in 26 directions can be used [7].
Several nodes which are connected with each other are detected using active contour filter (ACF) [31].The OTSU adaptive threshold techniques [29] are applied to get initial lung mask after that use of 3D flood filling method produces an initial lung lobe mask. The contrast stretching method (normalization) can be used to make the objects clearer [19].
2.1.1 Preprocessing
2.2 Segmentation
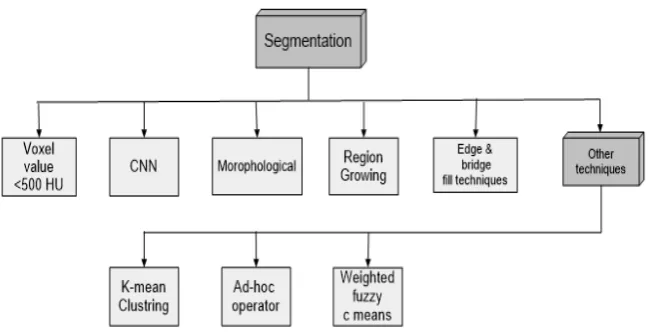
The segmentation of lung cancer can be done using K-mean clustering, Fuzzy C-Mean clustering, Ad-hoc operator, and other clustering methods. K-mean gives the same results in a short period of time as compared to other [10,19]. Threshold base technique is used to segment the part of interest in the images. It uses the values of HU Lung CT scan(ranges from -2000 HU to +2000 HU ). The lung in the body is a low-density area. They used an optimum value of HU (-500 HU) to segment the lungs from the other parts of CT scan image [3,27]. The CNN has been used with some configuration of layers to segment the lobes of lungs [15].The location-based category of nodules using hybrid features can be used [22]. Imaging of standard size was down sampled to get the ROI patches for training and testing [21].The intensity threshold has been used for wall attached nodules and active contour refinement was done using morphological operations [19]. The grey level co-occurrence matrix of the image has been used to get the object of interest [17]. Automatic morphological region-grow segmentation was done for well-circumscribed nodule. Initial mask of lungs was taken and then inverted mask was used to produce the lung lobes. The morphological operations have been applied to remove the vessel cavities. Then, juxta pleural nodule segmentation was done using edge bridge, fill technique, 3D shape, and edge analysis to differentiate malignant nodules from benign nodules [20]. Clusters of highlighted voxels > 3mm was treated as nodule candidate [16]. Different Segmentation Techniques are shown in Figure2.
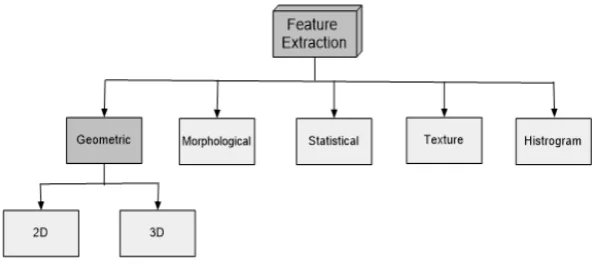
2.3 Features Extraction
The different features of lung nodules like geometric, morphological, statistical, texture, histogram have been extracted as shown in3. The 2D features includes geometric features (area, diameter, perimeter, circulatory), 2D intensity based statistical features (minimum value inside, mean inside, mean outside, variance inside, skewness inside, kurtosis inside, Elgen values), 3D geometric features (volume, compactness, bounding box dimension, principal axis lengths, elonga-tion),and 3D intensity based statistical features(minimum values inside, mean inside, mean outside, variance inside, skewness inside, kurtosis inside) have been extracted[3].The morphological features (volume, minimum axis length, maximum axis length, MinA/MaxA, Equivalent radius, Sphericity, compact-ness) Outer Surface Statistical and Histogram Features (Mean, Maximum Pixel Value, Minimum Pixel Value, Most Frequent Pixel Value, Variance, Standard Deviation, Skewness, Kurtosis) Outer Surface Texture Surface (Contrast, En-ergy, Entropy, Homogeneity, Moment) can be calculated to extract the property of the Candidate Nodule [7]. Three features were used to select the critical point pairs that are boundary segment concave degree, relative boundary distance, and relative position information [29]. The circularity, extent, eccentricity, mean intensity, maximum intensity, area difference, entropy, weighted centroid difference, mean intensity difference, Sphericity, contrast, standard deviation, skewness can be used for proper detection of Nodules [17,19,20].The log edge detection in ribs CT scan images can also be used [6].In figure 3 different features are categorized.
2.4 Classification Algorithms
There are many algorithms like SVM [3,5,7,13,19,27,34], CNN [15,21,31] PSO [7], ANN [17], 2D and 3D CNN that are used to classify the cancerous and non-cancerous nodules [16]. For best classification the combined classifiers of
Property Description
Format Digital Imaging and Communications in Medicine
Size the resolution of the images is 512 x 512
Dataset Lung Image Database Consortium (LIDC)
Gray Level 16-bit Gray Scale Level
No of images Dataset contains 110 images
Image type Computed Tomography (CT) Scan
Table 2: Dataset Properties
linear, quadratic, Parzen and ANN has been used [11]. Fisher linear discriminant [FLD], K-means and GA like algorithms can also be used [10]. In the figure different types of classifiers are presented4.
Fig. 4: Different types of classifiers.
3 Methodology
In the proposed methodology, publically available LIDC dataset is used. The properties of dataset are presented in table2. LIDC dataset contains DICOM format reports of patients. By exploring DICOM format a new dataset is prepared according to associated ground truth values. Our new dataset consists of 110 CT scan images, containing 131 candidate nodules. We use two different methods of segmentation CNN and OTSU with comparative analysis.
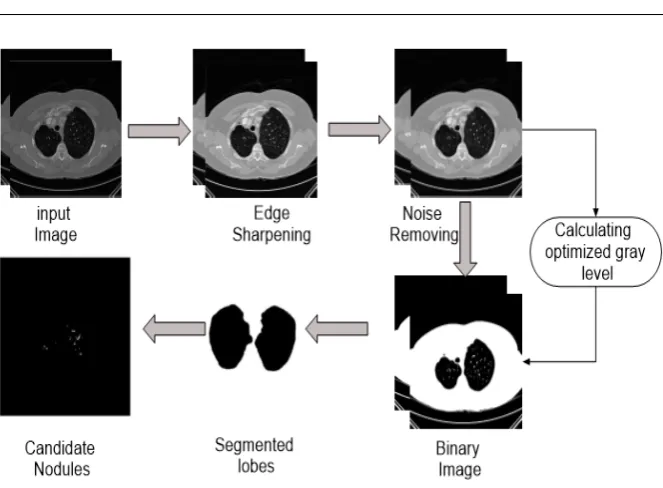
Fig. 5: Candidate Nodule Segmentation.
remove the noise from images different kind of filters like wiener2 filter with more reliable and optimistic values is used. The wiener2 filter is a linear low pass-filter and uses to remove noise in 2D filtration.It uses the variance and local mean around every pixel in the image [23]. Results after filtration are shown in figure5.
Equation (1) is used to calculate the Mean.
µ= 1 N M
X
n1,n2∈η
α(n1, n2) (1)
The Variance is calculated by using Equation (2).
α2= 1 N M
X
n1,n2∈η
α2(n1, n2)−µ2 (2)
The pixel wise filtering is done by following equation.
b(n1, n2) =µ+
α2−v2
α2 (a(n1, n2)−µ) (3)
V2represents the noise variance,a2 is the variance,µis the Mean andη is the
Fig. 6: Block Diagram of OTSU segmentation
3.0.1 Segmentation using OTSU
In the next phase, Otsu’s thresholding method is used for the segmentation. It is a non-linear method that converts the gray level image into the logical image. In this methodology, the gray threshold base function is used, which calculates the global threshold of the image. It also converts the multi-gray level image into a binary image. The binary image after gray-threshold is shown in figure 5. The image also contains an unnecessary part. To remove unnecessary parts, big blobs are removed from the image and the area of interest is segmented. Later on, the candidate nodules from the binary image are extracted. All the steps with a sequence are shown in figure5. The block diagram of the OTSU preprocessing and segmentation is shown in figure6
3.1 Segmentation using CNN
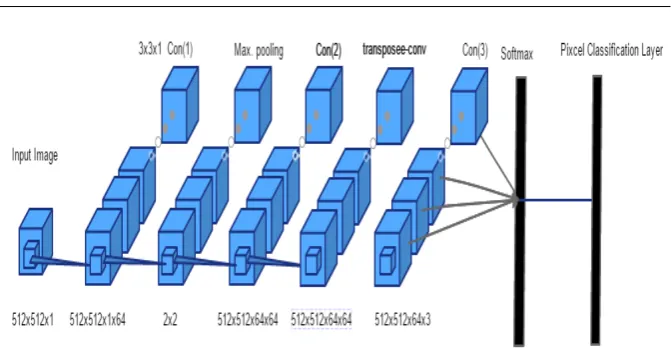
Fig. 7: Different layers of the architecture of the CNN use for the semantic segmentation of the nodules.
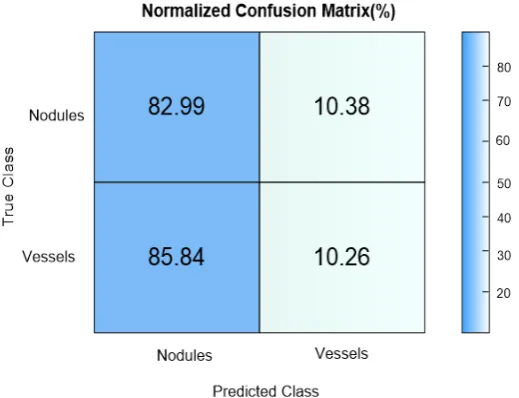
and 3D images. In the proposed methodology, a CNN model for the semantic segmentation of the Candidate Nodule is proposed. The basic structures of the CNN are based on the size of the Input images. The layered structure of the CNN architecture is shown in figure7. An input image of size 512x512x1 with ’Zero-center’ normalization is given to the input layer of the CNN. In the next layer which is the first convolution layer, it gets images from input layer and performs 64 filters with a filter of size 3x3x1 along with stride [1 1] and padding [1 1 1 1] on the objected image. The activation function of ReLU performed after convolution-1 layer. Later, Max pooling of size 2x2 with stride [1 1] and padding[0 0 0 0] is performed. In the second activation layer again 64 filters with a filter size of 3x3x64 convolutions with the same stride and padding are performed. Next layer is the transposed layer which uses the 4x4x64 transposed convolutions with 64 filter size. After it again Convolutional layer with 1x1x64 convolutions was performed. After three convolution layers, two fully connected layers softmax and ”class output” (pixel classification layer) is performed. The softmax layer calculates the probability of the predicted classes and the ”class output” layer classify the Nodules and vessels into two classes. The normalized confusion matrix of the CNN model is also shown in figure8.
3.1.1 Training
labeled the target objects based on their Geometry and other properties of nodules and the vessels. If the input of a layer of the architecture is Y and the output is the Z, then any layer can be calculated byZ =max(0, ωY +B), where ω is the weight of the currently calculating layer and B is the bias parameter. The training process continued until the results achieved according to the predetermined values. The model is trained with the batch size of 20 and the epoch of 100. The evaluation with the trained model is performed on the testing data.
Fig. 8: Normalized confusion matrix of the CNN model.
3.1.2 Post-processing
For more clear and sharped results, the post-processing is done after getting the results of class Nodules from the CNN model. In post-processing, different morphological operations are done on the output results like Erosion and dilation.
3.2 Feature Extraction
(a) Sample Labeled image on binary level.
(b) Zoomed image.
Fig. 9: The image is labeled on the binary level and differentiated between Nodules and Vessels (Sky blue color for Nodules and Orange Color for Vessels.)
3.2.1 Mean
The Mean of intensity values of a specific region is the average of all the pixel’s intensity values. It can be calculated by adding all the values and dividing it by the number of pixels. Following is the mathematical expression to calculate it.
M ean=
Pn
i=1Xi
n
3.2.2 Homogeneity
This feature calculates the distribution of the elements in Gray-level co-occurrence matrix(GLCM) to Gray-level co-co-occurrence matrix diagonal. It is the local information which shows the regularity of a calculated region. Following formula is used to calculate the homogeneity.
Homogeneity=X
i,j
p(i, j) 1 +|i−j|
3.2.3 Skewness
It is used to calculate the irregularity of the data around the mean of sample. skewness can be calculated as following.
Skewness=
Pn
i=1(Xi−X)
(n−1)3
Fig. 10: Results of the segmentation by using CNN.
3.2.4 Correlation
Correlation is the measurement of how much a pixel is correlated to it’s neighbor in all over the image.
Correlation=X
i,j
(i−µi)(j−µj)p(i, j) σiσj
It ranges from -1 to 1 and for a constant image correlation is N*N.
3.2.5 Standard deviation
It is a statistical parameter which is used to calculate the difference between the gray level and the Mean. It can be expressed by the following equation.
Standarddeviation=σ=
v u u t
1 M
M
X
i=1 N
X
j=1
(p(i, j)−µ)2
3.2.6 Circularity
Circularity shows the roundness of the nodule, it is a geometric feature. If the shape is more near to the circle it is 1, the thinner the shape the more low value of circularity an object has. It is a close relationship between the perimeter and the Area of the circle. It is calculated by using the following equation.
C= 4πA P2
3.2.7 Energy
Energy feature is used to calculate the uniformity in the image. This is also known as Uniformity of the image or the angular second moment. It ranges from 0 to 1. where 1 stands for the constant energy of an image.
Energy=X
i,j
p(i, j)2
3.2.8 Size
Size is a very basic and important feature of the nodule, more important is to measure the size accurately. In the proposed methodology, the diameter of the tumor is measured by using the convex hull as shown in figure11. It calculates the diameter of Nodules from every perspective and calculates the maximum diameter precisely [4].
3.2.9 Inertia
It is a 3D texture feature of the image. It calculates values of intensity contrast with the neighbor in a candidate. It can be calculated by using the following equation. Inertia= G−1 X I=0 G−1 X j=0
(i−j)2p(i.j)
3.2.10 Extent
The extent feature is used to calculate how much a nodule is branched.It is also a geometric feature and it is the ratio of the Area of the object and the area of the bounding box. The bounding box shows the area of a possible small rectangle which can enclose the object completely. It’s mathematical expression is following.
E= Area of object Area of enclosing Box
3.2.11 Entropy
It describes the randomness and it can be used to show the texture of the image. Entropy shows the randomness in the Voxels in candidate Nodule. It can be calculated as follows.
Entropy(H) =− G−1 X I=0 G−1 X j=0
(a) Sample image (b) Segmented tumor
Fig. 11: Figure contains the visual representation of the size measurement using a convex hull. Figure (a) contains the sample image and figure (b) contain the segmented Nodule
3.2.12 Eccentricity
Eccentricity is measurement stretching of the object; it is a ratio between the major and minor axis of objects. Eccentricity can be calculated by using following equation [20]
Eccentricity= max{
Pm
x=1f b(x,:)}
maxnPn
y=1f b(y,:)
o
3.2.13 Variance
Within the candidate object Variance is the variation of intensities in between the pixels. The mathematical expression to calculate the variance is following.
V ariance(σ2) =
PG−1
i=0 µ(i)−µ2
2
3D Texture Features 2D Texture Features Geometric Statistical
Correlation Mean Size in mm Homogeneity
Inertia Skewness Circularity Standard Deviation
Entropy Variance Eccentricity Energy
Extent
Table 3: Table contain different category of features
Fig. 13: Figure contain different extracted and selected features and the names of classifier which used to classify the candidate objects.
3.3 Feature Selection
By using Principal Component Analysis (PCA), 13 different features were extracted in the feature extraction phase. However, we choose four features such as Variance, Entropy, Mean and the Size in mm. Size is one of the key features which is precisely measured using the Convex hull.
3.4 Classification
10-Cross fold 70% Training and 30% Testing on Dataset
Classifiers Accuracy % Loss % Accuracy %
Miss-Classification RateRecall
False
Positive Rate
True
Negative Rate
Logit Boost 99.23 0.77 97.5 2.5 96.875 0 100
Bagged 99.23 0.77 97.5 2.5 96.875 0 100
Robust Boost 99.23 0.77 97.5 2.5 96.875 0 100
SVM(Binary) 98.47 1.53 95 5 93.125 11.11 88.99
Gentle Boost 97.70 2.3 97.5 2.5 96.875 0 100
Fine KNN 97.70 2.3 92.5 7.5 93.75 12.5 87.5
SVM(Gaussian Kernel) 96.64 3.36 92.5 7.5 93.75 12.5 87.5
Medium KNN 96.18 3.82 87.5 12.5 93.75 16.67 83.3
Subspace 91.60 8.4 85 15 87.87 28.57 71.4
Table 4: Nine different classifiers with their result details.
Work Year Accuracy Sensitivity Specificity Classifier
[2] 2015 96.6 96.7 96.3 SVM
[9] 2017 70.5 77.7 69.5 Simple Rule Based Classifier
[14] 2017 88.0 84.6 NA Non-linear [18] 2018 98.9 98.4 98.7 Random Forest
[32] 2019 97.2 96.0 97.3 LdcNet-FL
[28] 2019 93.25 93.12 91.37 RGBPCANet Proposed Framework 2019 99.23 96.88 100 Logit-Boost
Table 5: The comparison of different Classifier’s results.
used for the validation of the predictive models. In Ten-fold cross-validation technique, the dataset is divided into ten subsets in which each subset contain both cancerous and non-cancerous nodules. Multiple classifiers are used for the classification purpose, every classifier has its own optimized way of work, the SVM classifier is most popular classifier. It is used for 2D classification and can also be used for multi-dimensional classification with the help of Kernel Customization, Like Gaussian kernel and Polynomial kernel [12].
Bagging and boosting methods are widely used for classification, bootstrap-ping is used in bagging whereas the Boosting is based on sample re-weighting method. Boosting technique is originally designed for the classification prob-lems, by using this technique a more robust ensemble is produced by combining the outputs of many weak classifiers. Logitboost uses booting algorithms in which binomial deviance is minimized, it provides best average accuracy even for poor separable classes[25]. Boosting is defined by Freund and Schapire(1997) as a “general problem of creating a very accurate prediction rule by combining rough and moderately inaccurate rules of thumb”[24].
(a) Confusion Matrix of decision tree
using Robust Boost ensemble. (b) Confusion Matrix of Bagged.
(c) Confusion Matrix of Logit Boost.
Fig. 14: Confusion matrix of top three classifiers which gives the maximum accuracy.
bagging training set constructed by making a duplicate of the original set used for training[8]. In the proposed methodology, SVM(Binary) and SVM(Gaussian kernel) are used which gives an accuracy of 95% and 92.5% respectively. The results are presented in term of False Negative Rate (FNR), True Negative Rate (TNR), Accuracy, Miss-classification, and recall. Further details of classifiers
shown in Table4.
3.5 Results
The proposed methodology shows better performance in comparison to the previous approaches. Previous methodologies rely on multiple features yet miss the key feature e.g., size of nodules to detect the lungs nodules at their early stage and further to classify them into malignant and benign nodules. We use the size measurement of nodules which is an important factor for radiologists to classify the malignant and the benign nodules. Additionally, we use geometric, statistical, 2D and 3D textures features which gives us the improved results.
displayed in3. All classifiers have a range of accuracies from 90.11% to 99.23%. The maximum accuracy using (70% as training and 30% as testing) is 97.5% with a true negative rate of 100% and the false positive rate is 0, its confusion matrix is shown in figure 14c. The accuracy of 10-fold Cross-validation is 99.23% with a loss of 0.77% using Logit Boost. Classification with decision tree with bagged ensemble also gives a good result which is 99.90% in terms of accuracy using 10-cross fold. The same classifier provides 97.5% using 70% of dataset as training and 30% as testing, its confusion matrix is shown in figure 14b.
From experiments, we have achieved 99.23% accuracy which is significantly better than the previously reported score as 96.6% [2],70.5%[9],88.0%[14],98.9% [18],97.2%[32],93.25% [28]. The resultant sensitivity rate is 96.875% of different classifiers which is also dominant in terms of sensitivity because the sensitivity is much better than others.In previous methodologies sensitivity rate is less then our results. Whereas the sensitivity of other methodologies are 96.6% [2], 77.7% [9], 84.6% [14], 98.4% [18], 96.0% [32], 93.12% [28].
4 Conclusion
In this study, an efficient approach is proposed to detect the malignant and the benign nodules. We use semantic segmentation based upon convolutional neural network for the identification of vessels and candidate nodules from the lungs region. Our approach has shown better performance by comparing with the previous approaches mentioned in the background section and results section with the reduction of false positives. Our methodology provides 99.23% accuracy score using 10 fold cross-validation with a loss of 0.77%. The proposed method would potentially be helpful to radiologists in the classification of malignant and benign nodules.
Compliance with Ethical Standards
Conflict of InterestThe authors declare that they have no conflict of interest.
Ethical approval This article does not contain any studies with human participants or animals performed by any of the authors.
Informed consentInformed consent was obtained from all individual partici-pants included in the study.
References
2. Akram S, Javed MY, Qamar U, Khanum A, Hassan A (2015) Artificial neu-ral network based classification of lungs nodule using hybrid features from computerized tomographic images. Applied Mathematics & Information Sciences 9(1):183
3. Akram S, Javed MY, Akram MU, Qamar U, Hassan A (2016) Pulmonary nodules detection and classification using hybrid features from computerized tomographic images. Journal of Medical Imaging and Health Informatics 6(1):252–259
4. Bankier AA, MacMahon H, Goo JM, Rubin GD, Schaefer-Prokop CM, Naidich DP (2017) Recommendations for measuring pulmonary nodules at ct: a statement from the fleischner society. Radiology 285(2):584–600 5. de Carvalho Filho AO, Silva AC, de Paiva AC, Nunes RA, Gattass M
(2017) Lung-nodule classification based on computed tomography using taxonomic diversity indexes and an svm. Journal of Signal Processing Systems 87(2):179–196
6. Chen S, Yao L, Chen B (2016) A parameterized logarithmic image process-ing method with laplacian of gaussian filterprocess-ing for lung nodule enhance-ment in chest radiographs. Medical & biological engineering & computing 54(11):1793–1806
7. Demir ¨O, Yılmaz C¸ amurcu A (2015) Computer-aided detection of lung nodules using outer surface features. Bio-medical materials and engineering 26(s1):S1213–S1222
8. Dietterich TG (2000) An experimental comparison of three methods for con-structing ensembles of decision trees: Bagging, boosting, and randomization. Machine learning 40(2):139–157
9. El-Regaily SA, Salem MAM, Aziz MHA, Roushdy MI (2017) Lung nodule segmentation and detection in computed tomography. In: 2017 Eighth In-ternational Conference on Intelligent Computing and Information Systems (ICICIS), IEEE, pp 72–78
10. El-Regaily SA, Salem MA, Abdel Aziz MH, Roushdy MI (2018) Survey of computer aided detection systems for lung cancer in computed tomography. Current Medical Imaging Reviews 14(1):3–18
11. Elsayed O, Mahar K, Kholief M, Khater HA (2015) Automatic detection of the pulmonary nodules from ct images. In: SAI Intelligent Systems Conference (IntelliSys), 2015, IEEE, pp 742–746
12. Foody GM, Mathur A (2004) A relative evaluation of multiclass image classification by support vector machines. IEEE Transactions on geoscience and remote sensing 42(6):1335–1343
13. Froz BR, de Carvalho Filho AO, Silva AC, de Paiva AC, Nunes RA, Gattass M (2017) Lung nodule classification using artificial crawlers, directional texture and support vector machine. Expert Systems with Applications 69:176–188
Interna-tional Society for Optics and Photonics, vol 10134, p 1013425
15. Hoo-Chang S, Roth HR, Gao M, Lu L, Xu Z, Nogues I, Yao J, Mollura D, Summers RM (2016) Deep convolutional neural networks for computer-aided detection: Cnn architectures, dataset characteristics and transfer learning. IEEE transactions on medical imaging 35(5):1285
16. Huang X, Shan J, Vaidya V (2017) Lung nodule detection in ct using 3d convolutional neural networks. In: Biomedical Imaging (ISBI 2017), 2017 IEEE 14th International Symposium on, IEEE, pp 379–383
17. Hussain MA, Ansari TM, Gawas PS, Chowdhury NN (2015) Lung cancer detection using artificial neural network & fuzzy clustering. International Journal of Advanced Research in Computer and Communication Engineer-ing 4(3)
18. Jaffar MA, Zia MS, Hussain M, Siddiqui AB, Akram S, Jamil U (2018) An ensemble shape gradient features descriptor based nodule detection paradigm: a novel model to augment complex diagnostic decisions assistance. Multimedia Tools and Applications pp 1–27
19. Javaid M, Javid M, Rehman MZU, Shah SIA (2016) A novel approach to cad system for the detection of lung nodules in ct images. Computer methods and programs in biomedicine 135:125–139
20. Krishnamurthy S, Narasimhan G, Rengasamy U (2016) Three-dimensional lung nodule segmentation and shape variance analysis to detect lung cancer with reduced false positives. Proceedings of the Institution of Mechanical Engineers, Part H: Journal of Engineering in Medicine 230(1):58–70 21. Li W, Cao P, Zhao D, Wang J (2016) Pulmonary nodule classification
with deep convolutional neural networks on computed tomography images. Computational and mathematical methods in medicine 2016
22. Lu L, Tan Y, Schwartz LH, Zhao B (2015) Hybrid detection of lung nodules on ct scan images. Medical physics 42(9):5042–5054
23. Mathew ST, Nachamai M (2016) Methodical in methodical investigation of filtering algorithms for human brain mri. International Journal of Control Theory and Applications
24. Parvin H, MirnabiBaboli M, Alinejad-Rokny H (2015) Proposing a clas-sifier ensemble framework based on clasclas-sifier selection and decision tree. Engineering Applications of Artificial Intelligence 37:34–42
25. Ram´ırez J, G´orriz JM, Ortiz A, Padilla P, Mart´ınez-Murcia FJ, Initiative ADN, et al. (2016) Ensemble tree learning techniques for magnetic res-onance image analysis. In: Innovation in Medicine and Healthcare 2015, Springer, pp 395–404
26. Setio AA, Jacobs C, Gelderblom J, Ginneken B (2015) Automatic detection of large pulmonary solid nodules in thoracic ct images. Medical physics 42(10):5642–5653
27. Shaukat F, Raja G, Gooya A, Frangi AF (2017) Fully automatic detection of lung nodules in ct images using a hybrid feature set. Medical physics 44(7):3615–3629
intensity, shape and texture features. Journal of Ambient Intelligence and Humanized Computing pp 1–15
29. Shen S, Bui AA, Cong J, Hsu W (2015) An automated lung segmentation approach using bidirectional chain codes to improve nodule detection accuracy. Computers in biology and medicine 57:139–149
30. Siegel RL, Miller KD, Jemal A (2019) Cancer statistics, 2019. CA: a cancer journal for clinicians 69(1):7–34
31. Teramoto A, Fujita H, Yamamuro O, Tamaki T (2016) Automated de-tection of pulmonary nodules in pet/ct images: Ensemble false-positive reduction using a convolutional neural network technique. Medical physics 43(6Part1):2821–2827
32. Tran GS, Nghiem TP, Nguyen VT, Luong CM, Burie JC (2019) Improving accuracy of lung nodule classification using deep learning with focal loss. Journal of Healthcare Engineering 2019
33. Valente IRS, Cortez PC, Neto EC, Soares JM, de Albuquerque VHC, Tavares JMR (2016) Automatic 3d pulmonary nodule detection in ct images: a survey. Computer methods and programs in biomedicine 124:91– 107