Impact Factor: 5.515
Literature Review on Lung Nodule
Segmentation for Detection of
Cancerous Nodules
Anandhu Sanu
1, Dr. Anjana S Chandran
21Scholar, SCMS, Cochin, Kerala, India, [email protected]
2
Assistant Professor, SCMS, Cochin, Kerala, India, [email protected]
Abstract
According to the World Health Organization Cancer is the second leading cause of death globally, and is responsible for an estimated 9.6 million deaths in 2018. Globally, about 1 in 6 deaths is due to cancer. Approximately 70% of deaths from cancer occur in low- and middle-income countries. The most common cancer are Lung, Breast, Colorectal, Prostate, Skin cancer and Stomach. Where lung and breast cancer cases are the most reported among the all. Officially around 2.09 million cases were recorded in the year of 2018 where the most common deaths are recorded in the case of lung cancer which is estimated to be 1.76 million deaths. Cancer arises from the transformation of normal cells into tumour cells in a multistage process that generally progresses from a pre-cancerous lesion to a malignant tumour. Between 30–50% of cancers can currently be prevented by avoiding risk factors and implementing existing evidence-based prevention strategies. The cancer burden can also be reduced through early detection of cancer and management of patients who develop cancer. Many cancers have a high chance of cure if diagnosed early and treated adequately. This paper focuses on briefing the techniques used by different authors for the early detection of lung cancer to decrease the death rate caused from lung cancer.
Keywords: Literature review, cancer, lung cancer, detection, CT scan.
1. Introduction
1.1 Lung cancer
Lung cancer, also known as lung carcinoma, is a malignant lung tumor characterized by uncontrolled cell growth in tissues of the lung. This growth can spread beyond the lung by the process of metastasis into nearby tissue or other parts of the body. Most cancers that start in the lung, known as primary lung cancers, are carcinomas. The two main types are small-cell lung carcinoma (SCLC) and non-small-cell lung carcinoma (NSCLC). The most common symptoms are coughing (including coughing up blood), weight loss, shortness of breath, and chest pains. The vast majority (85%) of cases of lung cancer are due to long-term tobacco smoking. About 10–15% of cases occur in people who have never smoked. These cases are often caused by a combination of genetic factors and exposure to radon gas, asbestos, second-hand smoke, or other forms of air pollution. Lung cancer may be seen on chest radio-graphs and computed tomography (CT) scans. The diagnosis is confirmed by biopsy which is usually performed by bronchoscopy or CT-guidance.
1.2 Detection
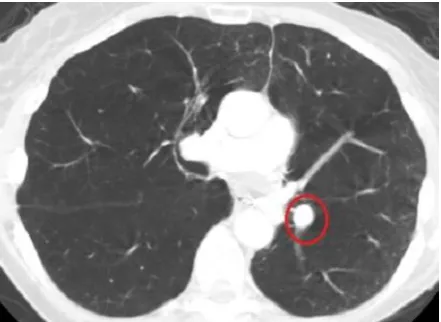
Impact Factor: 5.515 features of the nodule can be used to determine the severity of lung cancer. One such is the size of the nodule. If the size is large, there is a higher risk factor for this to be malignant. Finding the nodule size using naked eye is not practical so we need to have certain methods and implementations to find the size of the nodules in detection of lung cancer. The figure (a) shown below is an example of lung nodule. One of such method is image processing which has been used by many authors. In the later chapters this paper sums up such methods and implementation done by different authors.
Fig (a) : CT scan showing lung nodule.
2. Literature Review
In this section different approaches of segmentation by many researchers are discussed for lung cancer detection using CT scan images of the lung.
Giger et.al. (1990) have been proposed a difference image technique by using image processing techniques to create a nodule enhanced and a nodule suppressed image. They found that the proposed method eliminates everything remaining the shadow of nodule-like objects. They used less powerful methods for classification by using various geometry features to leave out false findings.
Yoshida et.al. (1995) have been proposed a combination of two enhancers such as a difference image algorithm and wavelet transform sensitive to subtle nodules. The proposed method integrated overlapping and lesion models were used in combination. It was observed that the proposed model obtained better result in compared to single algorithm without any incorporation of false positive reduction technique.
Xu et.al. (1997) proposed another difference image algorithm. For false positive reduction, they created a hybrid system with the help of an artificial neural network (ANN) and a rule-based technique.
Penedo et.al. (1998) have been proposed a neural network based method for nodule enhancement by using another ANN to select only true findings and the results were presented on a moderatesized, private database extended by simulated nodules.
Mao et.al. (1998) has evaluated the nodule enhancing capabilities of fragmentary window filtering. The authors were presented preliminary results on a few generated radiographs.
Schilham et.al. (2006) have been proposed to use a k-nearest neighbor (k-NN) classifier by using the images from the JSRT database for searching the Gaussian scale space maxima in multi-scale to detect different sized lung nodules. It was also observed that the proposed method performed better only at higher false positive rates.
Pereira et.al. (2007) has been proposed a sliding band filter based on the convergence of radial gradients to detect the lung nodule by using the JSRT database without a false positive reduction step.
Impact Factor: 5.515 detection of nodule candidate, the feature extraction and classification and three dimensional visualization was done. The accuracy of the CAD system was 95% which indicate good performance.
S.L.A. Lee et.al. (2008) have been proposed a random forest based classifier to detect all the nodules in the images and recorded a low false detection rate. The proposed method includes three stages such as image acquisition, background removal and nodule detection for identification of lung nodules by using images from the LIDC lung databases. The performance of the system was observed on some images containing nodules and some images containing no-nodules that were normally selected from database images.
M. Arfan Jaffar et.al. (2008) have presented a method for lung segmentation based on Genetic Algorithm (GA) and morphological image processing techniques. GA was applied on the normalized histogram to determine the threshold to separate out background and object. When background was removed the morphological operation was performed in three operations i.e. to filter noise, to smooth the image and to detect edges.
Sundararajan et.al. (2010) have been proposed support vector machine for the detection of pneumoconiosis by using various textural features for disjoint segments of the lung and focused on a subset of lung disorders. S.K. Vijai Anand et.al. (2010) have proposed a system which was predicted lung tumor from CT images with the help of image processing techniques coupled with neural network classification, to recognize whether benign or malignant. Then optimal thresholding was applied for noise removal to segregate lung regions. To segment the lung nodules region growing method was used. After that, back propagation neural network was used to classify as cancerous or non-cancerous.
M. Gomathi & P. Thangaraj et.al. (2010) have been proposed a support vector machine based (CAD) system for automatically detection of the lung cancer nodules with reduction in false positive rates. They used various image processing techniques to obtain the lung regions from CT scan images such as the segmentation was carried to apply fuzzy possibility C Mean (FPCM) clustering algorithm.
Le (2011) has been proposed a complex system for the detection of various lung disorders and image processing techniques were used for the detection of lung nodule but they were not used false positive reduction step.
Sharma et.al. (2011) used lung CT images extracted from NIH/NCI Lung Database Consortium and proposed an automatic computer aided diagnosing system for detection of lung cancer by analyzing these lung CT images. The authors of the paper have used several steps for the detection of lung cancer. Firstly, they extracted the lung region from the computer tomography image using various image processing techniques such as bit image slicing, erosion and wiener filter. In the first step the bit image slicing technique was used to convert the CT Advanced Computational Intelligence: An International Journal (ACII), Vol.3, No.1, January 2016 2 images into a binary image then after extraction the region growing segmentation algorithm was used for segmenting the extracted lung regions. After segmentation of lung region they used rule based model to classify the cancer nodules. Finally, a set of diagnosis rules were generated from the extracted features and with the help of diagnostics indicator. It was observed that the proposed method achieved the overall accuracy of 80%.
Chaudhary et.al. (2012) aim has to get more accurate results using the various enhancement and segmentation techniques. The image processing procedures that is, image pre-processing; segmentation and feature extraction were done. In image enhancement, image are compared with Gabor filter, auto enhancement and fast Fourier transform techniques. In the segmentation stage the Watershed and thresholding segmentation were used and comparison has been made.
Anam Tariq et.al. (2013) has developed a computerized system, that was detected the lung nodules with the help of CT scan images. The computerized system consists of two stages, first one is lung segmentation and enhancement and second one is feature extraction and classification. For removing background and extracts the nodules from an image, the threshold segmentation technique was applied. When extraction and segmentation were completed, then a feature vector was used to -calculate the abnormal region. After that the regions were classified using neuro fuzzy classifier. This system gives the facility to detect the smallest nodules which lead to early diagnosis of lung cancer
Impact Factor: 5.515 cancer recognition was presented by fuzzy inference system. The authors also compare the diagnosis performance of the proposed method with the artificial neural network.
Fan Zhang et.al. (2013) have been proposed Support Vector Machine (SVM) based classifier by using feature based imaging classification method to classify the lung nodules in Low Dose Computed Tomography (LDCT) slides into four categories that is, well circumscribed, vascularized, juxta-pleural and pleural-tail. The proposed support vector machine based method was trained with the help of polynomial kernel by C-SVC and the probability estimates upon the different types were predicted with the obtained SVM model which was used to classify the feature descriptors into four categories.
Ghayoumi H, Siamak J et.al. (2013) have been proposed an image analysis approach for automated detection, segmentation and classification of abnormal cancer cells from normal cells was introduced. Gaussian smoothing was used for detection and segmentation. At last Fast Fourier Transforms (FFT) was used for extracted the position of the objected cells
Sunil Kumar et.al.(2014) have proposed Computer aided diagnosis (CAD) that was detected the lung cancer at early stage by using various image processing techniques with the help of CT scan images. In pre-processing step noise was removed and converted the image into gray scale. Histogram thresholding was used for thresholding purpose. Finally, region growing algorithm was used for classification purpose.
Amjed S. Eslam b Jaber et.al. (2014) have been proposed an automatic computer aided diagnosis (CAD) system that includes three steps such as thresholding the CT image by segmentation, labelling the founded regions and regions are extracted for further analysis for the detection of lung cancer using CT scan images. .
3. Common Techniques Used In Detection
This section focuses on the most common methods and techniques used by different authors for the detection of cancerous lung nodules.
3.1 Image Processing
Image processing is a method to perform some operations on an image, in order to get an enhanced image or to extract some useful information from it. It is a type of signal processing in which input is an image and output may be image or characteristics/features associated with that image.
Image processing basically includes the following three steps: I. Importing the image via image acquisition tools; II. Analysing and manipulating the image;
III. Output in which result can be altered image or report that is based on image analysis.
3.2 K-Nearest Neighbours (KNN)
k-Nearest-Neighbour (KNN) is a non-parametric instance-based learning method. In this case, training is not required. The first work on KNN was submitted by Fix & Hodges in 1951 for the United States Air-force. The algorithm begins by storing all the input feature vectors and outputs from our training set. For each unlabelled input feature vector, we find the k nearest neighbours from our training set. The notion of nearest uses Euclidean distance in the m-dimensional feature space. For two input vectors x and w, their distance is defined by:
3.3 Difference Image Technique
Image differencing is an image processing technique used to determine changes between images. The difference between two images is calculated by finding the difference between each pixel in each image, and generating an image based on the result. For this technique to work, the two images must first be aligned so that corresponding points coincide, and their photometric values must be made compatible, either by careful calibration, or by post-processing (using color mapping). The complexity of the pre-processing needed before differencing varies with the type of image.
Impact Factor: 5.515 3.4 Wavelet Transform
A wavelet is a wave-like oscillation with an amplitude that begins at zero, increases, and then decreases back to zero. It can typically be visualized as a "brief oscillation" like one recorded by a seismograph or heart monitor. Generally, wavelets are intentionally crafted to have specific properties that make them useful for signal processing. Using a "reverse, shift, multiply and integrate" technique called convolution, wavelets can be combined with known portions of a damaged signal to extract information from the unknown portions. A wavelet series is a representation of a square-integrable (real- or complex-valued) function by a certain orthonormal series generated by a wavelet.
The integral wavelet transform is the integral transform defined as
The wavelet coefficients c(j k)are then given by
3.5 Artificial neural network
Artificial neural networks (ANN) or connectionist systems are computing systems inspired by the biological neural networks that constitute animal brains. The neural network itself is not an algorithm, but rather a framework for many different machine learning algorithms to work together and process complex data inputs. Such systems "learn" to perform tasks by considering examples, generally without being programmed with any task-specific rules. An ANN is based on a collection of connected units or nodes called artificial neurons, which loosely model the neurons in a biological brain. Each connection, like the synapses in a biological brain, can transmit a signal from one artificial neuron to another. An artificial neuron that receives a signal can process it and then signal additional artificial neurons connected to it.
In common ANN implementations, the signal at a connection between artificial neurons is a real number, and the output of each artificial neuron is computed by some non-linear function of the sum of its inputs. The connections between artificial neurons are called 'edges'. Artificial neurons and edges typically have a weight that adjusts as learning proceeds. The weight increases or decreases the strength of the signal at a connection. Artificial neurons may have a threshold such that the signal is only sent if the aggregate signal crosses that threshold. Typically, artificial neurons are aggregated into layers. Different layers may perform different kinds of transformations on their inputs. Signals travel from the first layer (the input layer), to the last layer (the output layer), possibly after traversing the layers multiple times.
3.6 Fragmentary Window Filtering
The authors designed a fragmentary window filtering (FWF) algorithm for detecting lung nodule patterns, which generally appear as circular areas of high opacity on the chest radiograph. The FWF algorithm helps differentiate circular patterns from overlapping radiographic background. A multiscale analysis was performed to locate multiscale nodules. Receiver operating characteristic analysis was performed by using a lung nodule that was extracted from a chest radiograph. The nodule underwent scalings and subsequent superimposition onto 140 normal regions of interest from six chest radiographs.
3.7 Computer-Aided Detection
Impact Factor: 5.515 ultrasound diagnostics yield a great deal of information that the radiologist or other medical professional has to analyze and evaluate comprehensively in a short time. CAD systems process digital images for typical appearances and to highlight conspicuous sections, such as possible diseases, in order to offer input to support a decision taken by the professional.
CAD also has potential future applications in digital pathology with the advent of whole-slide imaging and machine learning algorithms. So far its application has been limited to quantifying immunostaining but is also being investigated for the standard H&E stain.
CAD is an interdisciplinary technology combining elements of artificial intelligence and computer vision with radiological and pathology image processing. A typical application is the detection of a tumor. For instance, some hospitals use CAD to support preventive medical check-ups in mammography (diagnosis of breast cancer), the detection of polyps in the colon, and lung cancer.
3.8 Watershed Transform
In grey scale mathematical morphology the watershed transform, originally proposed by Digabel and Lantu´ejoul and later improved by Beucher and Lantu´ejoul, is a widely used method for image segmentation. The watershed transform can be classified as a region-based segmentation approach. The intuitive idea underlying this method comes from geography: it is that of a landscape or topographic relief which is flooded by water, watersheds being the divide lines of the domains of attraction of rain falling over the region. An alternative approach is to imagine the landscape being immersed in a lake, with holes pierced in local minima. Basins (also called ‘catchment basins’) will fill up with water starting at these local minima, and, at points where water coming from different basins would meet, dams are built. When the water level has reached the highest peak in the landscape, the process is stopped. As a result, the landscape is partitioned into regions or basins separated by dams, called watershed lines or simply watersheds. When simulating this process for image segmentation, two approaches may be used: either one first finds basins, then watersheds by taking a set complement; or one computes a complete partition of the image into basins, and subsequently finds the watersheds by boundary detection. To be more explicit, we will use the expression ‘watershed transform’ to denote a labelling of the image, such that all points of a given catchment basin have the same unique label, and a special label, distinct from all the labels of the catchment basins, is assigned to all points of the watersheds.
3.9 Support Vector Machine
Support-vector machines (SVMs, also support-vector networks) are supervised learning models with associated learning algorithms that analyze data used for classification and regression analysis. Given a set of training examples, each marked as belonging to one or the other of two categories, an SVM training algorithm builds a model that assigns new examples to one category or the other, making it a non-probabilistic binary linear classifier (although methods such as Platt scaling exist to use SVM in a probabilistic classification setting). A SVM model is a representation of the examples as points in space, mapped so that the examples of the separate categories are divided by a clear gap that is as wide as possible. New examples are then mapped into that same space and predicted to belong to a category based on which side of the gap they fall.
In addition to performing linear classification, SVMs can efficiently perform a non-linear classification using what is called the kernel trick, implicitly mapping their inputs into high-dimensional feature spaces.
When data is unlabelled, supervised learning is not possible, and an unsupervised learning approach is required, which attempts to find natural clustering of the data to groups, and then map new data to these formed groups.
Impact Factor: 5.515
4. Conclusion
The overall objective is to study the various different techniques and methods available for the segmentation of lung nodules for the detection of lung cancer.
Segmentation of lung nodules have been widely acknowledged as an important step in medical image analysis and in treatment of lung cancer. To find reliable method for nodule detection is an important problem in the field of medicine. This paper focuses on briefing up of many different methods proposed by different authors for the segmentation of lung nodules for the early detection and diagnosis of lung cancer which could help in decreasing the mortality rate caused by the deadly lung cancer.
We analyzed all the methods and found that different methods gave different levels of accuracy. The CAD and the Watershed Transform gave the highest levels of accuracy but when CAD was used by JIA Tong el.al in 2007 overall accuracy level of the system was 95% and when it was used by Sharma et.al in 2011 the overall accuracy of the system was measured as 80% whereas Watershed Transform gave an overall accuracy of 95% with highest specificity and sensitivity.
References
[1]Tariq, A., Akram, M. U., & Javed, M. Y. (2013, April). Lung nodule detection in CT images using neuro fuzzy classifier. In Computational Intelligence in Medical Imaging (CIMI), 2013 IEEE Fourth International Workshop on (pp. 49-53). IEEE.
[2] Chaudhary, A., & Singh, S. S. (2012, September). Lung cancer detection on CT images by using image processing. In Computing Sciences (ICCS), 2012 International Conference on (pp. 142-146). IEEE.
[3] NationalCancer Institute, "The cancer imaging archive, "https:llwiki.cancerimagingarchive.net/display/Public/LlDC-lDRI,September 2011.
[4]Hashemi, A., Pilevar, A. H., & Rafeh, R. (2013). Mass Detection in Lung CT Images Using Region Growing Segmentation and Decision Making Based on Fuzzy Inference System and Artificial Neural Network. International Journal of Image, Graphics and Signal Processing(IJIGSP), 5(6), 16.
[5]Anand, S. V. (2010, October). Segmentation coupled textural feature classification for lung tumour prediction. In Communication Control and Computing Technologies (ICCCCT), 2010 IEEE International Conference on(pp. 518-524). IEEE.
[6]Lee, S. L. A., Kouzani, A. Z., & Hu, E. J. (2008, November). A random forest for lung nodule identification. In TENCON 2008-2008 IEEE Region 10 Conference (pp. 1-5). IEEE.
[7]Zhang, F., Song, Y., Cai, W., Zhou, Y., Shan, S., & Feng, D. (2013, November). Context curves for classification of lung nodule images. In Digital Image Computing: Techniques andApplications (DICTA), 2013 International Conference on (pp. 1-7). IEEE.
[8] Sivakumar, S., & Chandrasekar, C. (2013). Lung nodule detection using fuzzy clustering and support vector machines. International Journal of Engineering and Technology, 5(1), 179-185.
[9]Jaffar, M. A., Hussain, A., Nazir, M., Mirza, A. M., & Chaudhry, A. (2008, December). GA and morphology based automated segmentation of lungs from Ct scan images. In Computational Intelligence for Modelling Control & Automation, 2008 International Conference on (pp. 265-270). IEEE.
[10]Madero Orozco, H., Vergara Villegas, O. O., De Jesus Ochoa Dominguez, H., & Cruz Sanchez, V.G. (2013, November). Lung Nodule Classification in CT Thorax Images Using Support Vector Advanced Computational Intelligence: An International Journal (ACII), Vol.3, No.1, January 2016
[11]PATIL, D. S., & Kuchanur, M. B. (2012). Lung cancer classification using imageprocessing. International Journal of Engineering and Innovative Technology (IJEIT) Volume, 2.