ICA for Watermarking Digital Images
St´ephane Bounkong [email protected]
Bor´emi Toch [email protected]
David Saad [email protected]
David Lowe [email protected]
Neural Computing Research Group Aston University
Birmingham, B4 7ET, United Kingdom
Editors: Te-Won Lee, Jean-Franc¸ois Cardoso, Erkki Oja and Shun-Ichi Amari
Abstract
We present a domain-independent ICA-based approach to watermarking. This approach can be used on images, music or video to embed either a robust or fragile watermark. In the case of robust watermarking, the method shows high information rate and robustness against malicious and non-malicious attacks, while keeping a low induced distortion. The fragile watermarking scheme, on the other hand, shows high sensitivity to tampering attempts while keeping the requirement for high information rate and low distortion. The improved performance is achieved by employing a set of statistically independent sources (the independent components) as the feature space and principled statistical decoding methods. The performance of the suggested method is compared to other state of the art approaches. The paper focuses on applying the method to digitized images although the same approach can be used for other media, such as music or video.
Keywords: Steganography, Watermarking, Information-Hiding, Authentication, ICA
1. Introduction
Modern society increasingly relies on digitized information that can be easily accessed, copied and transmitted. The need for secure authentication and watermarking techniques stimulated research in information hiding over the past three decades. Information hiding, or steganography, has a broad range of applications from copyright protection and transaction tracking, to broadcast monitoring, data integrity, authentication and fingerprinting (Cox et al., 2002). Some applications of steganog-raphy, especially in the area of fingerprinting are an essential component in the sale of copyright protected electronic goods, such as software, music and picture files, both off and on-line. Fragile watermarking, on the other hand, plays an important role in authenticating images and audio sig-nals, offering an alternative to traditional methods that often require the transmission of additional metadata; this may be easily identified and removed.
For authentication purposes, in addition to being imperceptible, the watermark has to be sensi-tive to the slightest modification. This is termed fragile watermarking and allows the detection of tampering attempts. In some cases, the watermark is required to be sensitive only to some attacks while not being affected by others, such as common processing techniques (semi-fragile watermark-ing).
Current state of the art watermarking methods mostly operate in a feature space, such as the Fourier domain, rather than on the raw data. The allowed level of distortion due to watermarking, based either on conventional measures or on a perceptual model, is limited to a predefined threshold. The embedding process typically relies on modulation or quantization methods, whereas decoding often relies on correlation detection or mapping to the nearest discrete value.
Most modern watermarking techniques have emerged in the last decade. Researchers in this field come from different backgrounds and typically bring with them the knowledge from their previous field; this is reflected in the watermarking techniques devised so far, both in the methods suggested for the watermark embedding process and the feature space chosen for this purpose. The plethora of watermarking methods available and the narrow suitability of each to specific domains make it diffi-cult to provide a principled comprehensive theoretical approach to watermarking; such an approach is a prerequisite to any optimization scheme aimed at maximizing the information embedding rate and the robustness against various attacks, and minimizing the information degradation.
In this paper, we propose a novel approach to watermarking which is independent of the appli-cation domain and is supported by existing results from information theory of watermarking. It is based on embedding the message in a set of statistically independent sources obtained in our case by independent component analysis (ICA) (Hyv¨arinen et al., 2001). These sources constitute the spanning of a feature space, and represent the covertext in conjunction with the corresponding set of constant mixing matrices. The distortion measure and the ICA mixing and demixing matrices may differ greatly from one application domain to another, but the watermarking scheme principle remains the same. Indeed, the demixing process gives a set of independent sources, which share similar characteristics and have little correlation with the original application domain. Different generative models may be used for identifying the set of independent sources; ICA, that we will focus on here, is clearly one of the most principled methods to identify statistically independent sources used as the feature space in the suggested scheme.
Recent information theoretical analyses have provided clear upper bounds to the watermark information capacity for a given distortion based on communication channel with side information. Concrete bounds have also been derived in special cases by Cohen and Lapidoth (2002) and Moulin and O’Sullivan (2003). Unfortunately, the analyses do not provide any information on how to design an optimal system and have been carried out under certain assumptions about both source and watermark distributions. However, an important result of this research is that the upper bound, in the case of parallel channels, is reachable only if the sources are statistically independent. Any selection of statistically dependent sources results in theoretically inferior performance; this motivates the use of ICA as our feature space.
In addition, we replace suboptimal threshold-based decoding methods by maximum a posteriori (MAP) decoding using noise and source models derived from experiments.
of the method used, respectively. Comparative experiments with other watermarking techniques carried out and their results are analyzed in Section 5. Discussion and conclusions are presented in Section 6.
2. Watermarking: General Framework
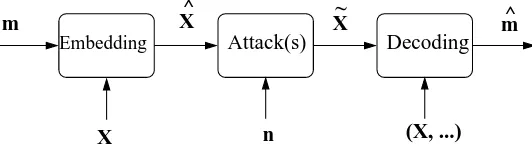
The problem of robust watermarking can be described as a game between Alice, Bob and Mallory. Alice is the legitimate owner of a digital data X. She wants to embed in it some information m to protect her intellectual property rights (IPR) and to be able to prove her ownership (or alternatively to embed fingerprinting information about the data transaction, such as details of the buyer). Mallory is the attacker or forger. He wants to counterfeit the watermarked data ˆX by uprooting the embedded information and/or embedding his own personal data. The induced modification is denoted by n. Bob is the receiver of the digital data ˜X, he wants to be sure of buying the data from an authorized seller (or legitimate owner, Alice). He therefore investigates the presence of a potentially hidden information ˆm from the received data ˜X (alternatively, Alice may want to find the source of an illegal distribution). This general watermarking problem is also described in Figure 1.
Decoding Attack(s)
Embedding
X
X
(X, ...)
m^
X~
^ m
n
Figure 1: A general watermarking scheme where m is the embedded message, X the covertext, ˆX the watermarked covertext, ˜X the attacked covertext and ˆm an estimate of the original message m.
Fragile watermarking follows roughly along the same lines, except for the fact that Alice embeds a watermark that is highly sensitive to tampering attempts. Mallory would like to modify the data to his advantage (e.g., remove information from CCTV footage), while Bob wants to be sure that the received data ˜X has not been tampered with.
2.1 Watermarking Requirements
Generic watermarking can be seen as a constrained communication problem, of channel with side information, where distortions induced by the sender and the attacker are limited. The three main constraints are imperceptibility, robustness and information rate. A formal model presenting the relation between these three constraints is described by Moulin and O’Sullivan (2003) using an information theoretical framework of information hiding. In this paper, we give an intuitive de-scription of these opposing requirements:
Imperceptibility is defined as the similarity between the original covertext and the watermarked version. This can be expressed as d1(X,X)ˆ ≤δ1, with d1being a distortion measure andδ1the desired threshold. Typical distortion measures found in the literature are mean square error, signal-to-noise ratio, etc (Cox et al., 2002). More complicated distortion functions, relying on domain specific perceptual models can also be used. Note that the attacker is also limited by a similar distortion constraint d2(Xˆ,X)˜ ≤δ2, where the distortion measure d2and its threshold δ2 may be different from d1andδ1, although the same distortion measure is typically used. In the latter case, the distortion caused by an attack is usually expected to be higher than that of the watermark itself (δ1≤δ2).
Robustness A watermarking scheme should survive various distortions or attacks. Common at-tacks may be different depending on the nature of the covertext, for example audio or images. Malicious attacks aim at removing the watermark, while non-malicious attacks are due to common transmission and signal processing practices that might harm the embedded signal. Robust schemes should at least survive non-malicious attacks as well as some malicious at-tacks. Generally, these attacks are global to the whole covertext. Robustness is often achieved by embedding globally a watermark with little information content compared to the covertext. Robust watermarking aims at maximizing the rate of correctly identifying the original mes-sage, p(mˆ =m|X)˜ . The message estimate ˆm is obtained by some decoding method.
Fragility In fragile watermarking, one replaces the requirement for robustness by fragility, which is the ability to detect an alteration of the watermark due to tampering attempts. Further-more, it is often needed to localize the distortion. Such a requirement makes it necessary to have a watermark with higher information content than in the robust watermarking frame-work spread over the entire covertext. Our method has different performance with respect to different attacks. Among them, we focus on fragility with respect to replacement attacks, while maintaining some robustness against non-malicious attacks. Fragile watermarking aims at optimizing the two following constraints:
max p(mˆ =m|X˜r),
min p(mˆ =m|kX˜f−Xˆk>δf),
where ˜Xr is the watermarked data attacked by a non-malicious attack against which the
scheme has to be robust, ˜Xf is the watermarked data attacked by another type of attack
typi-cally localized which needs to be detected by the scheme. The parameterδf sets the fragility
of the scheme.
A more formal definition, relying on information theory is given by Moulin and O’Sullivan (2003). We are interested in maximizing the information embedding rate for a given distortion and attack constraints, which is clearly upper bounded by the capacity.
There is no general solution to this problem, as it depends on the final purpose of the system. For instance, if the watermark has to survive attacks that induce high distortion, error-correcting codes can be used to improve robustness, but it may be at the expenses of the information rate. From now on, we will focus on digital image watermarking although most of the topics may also be relevant for other domains, such as music or video.
2.2 Watermarking Feature Spaces
Early watermarking schemes operated directly in the covertext domain. However, such methods have been shown to be quite poor in their robustness properties. Many feature spaces have been studied in recent years for improving the efficiency of watermarking systems; most of these choices are for reasons of convenience and traditional use in the specific domain, such as Fourier and Cosine transforms in images. A theoretical approach to find an optimal feature space in a particular case, based on an information theoretical approach, has recently been suggested by Ramkumar (2000). However, it is yet to be seen if this approach can be of practical use. Research has focused more on the design of practical systems using well known feature spaces. The three main spaces are:
Cosine Transform Domain: is widely used being a good approximation for the Karhunen Lo `eve transform for highly correlated data, such as images. The cosine transform has good variance compaction property (Jain, 1989). Therefore, using this feature space facilitates spreading the watermark across a large part of the image information content. Schemes based on this transformation (Cox et al., 1997) show good robustness against various non-malicious attacks. Window cosine transform (on 8×8 pixel windows) is also used (Koch and Zhao, 1995) in con-junction with JPEG quantization table to be robust against the well-known JPEG compression standard (Wallace, 1992), arguably the most common non-malicious attack.
Fourier Transform Domain: Watermarking schemes based on this feature space are also usually robust against non-malicious attacks for similar reasons. Moreover, some variants of this transformation, such as Fourier-Mellin transform, inherently include properties such as in-variance against affine transformations, thus allowing some watermarking schemes (Ruanaidh and Pun, 1997) to handle geometric attacks, such as rotations. Notice that geometric attacks are so far among the most efficient attacks against general watermarking schemes (Petitcolas and Kuhn, 2002, Stirmark).
Wavelet Transform Domain: Motivated by the upcoming JPEG2000 standard (Committee, 2000), this feature space may play an important role in the near future similar to that of the cosine transform space at present. Watermarking in the wavelet domain has recently been the focus of many research projects in this area (Meerwald, 2001). Moreover, this frequency feature space allows the embedding process to be spatially localized.
2.3 Embedding, Attacks and Decoding
methods. Quantization methods have been widely studied in the coding area for decades, and have recently been used in the context of watermarking. Modulation methods are often paired with a correlation detector and a given decision threshold; they show better performance when the original data is available for decoding. The schemes have been studied against common attacks in the literature, among them: noise, lossy compression, band filtering, cropping and collusion.
2.3.1 EMBEDDING
Embedding a watermark usually follows one of the two following schemes or can be a variant of one of them.
Modulation: Embedding information through modulation is usually carried out using one of the three formulae suggested by Cox et al. (1997):
ˆ
X=X+αm ,Xˆ =X(1+αm) ,Xˆ =Xeαm,
where m is the embedded message, X the original covertext value,αis a pre-defined strength factor, and ˆX is the watermarked value. In this approach, the value ofα, common to all components is chosen heuristically.
Quantization: Another widely used method to embed information is to quantize the original data X, using a quantization function q that provides different quantization values/grids to different embedded message values m. The embedding strength is determined by the minimal distance δ between two adjacent quantization values corresponding to two different m symbols.
Other methods, such as modifying a couple of feature space coefficients, while preserving their absolute difference or some other predefined criteria, may be used to embed data. However, in most cases, these are merely variants of modulation and/or quantization.
2.3.2 ATTACKS
A watermarked image may undergo some attacks. We distinguish two kinds of attack: non-malicious attacks, which are common signal processing methods, that are not aimed at removing or tam-pering with the embedded watermark; and malicious attacks, which are deliberate attempts to re-move/disable the watermark, possibly using the embedding algorithm itself. It is obvious that some non-malicious attacks can also be used as malicious attacks, especially if the watermarking process is known to be weak against them.
Common non-malicious attacks include:
Noise Data may be altered due to transmission through a noisy communication channel.
Lossy compression Compression algorithms are often used to transfer image data efficiently. Com-pression algorithms such as JPEG or JPEG2000 allow excellent comCom-pression rates, while they introduce moderate levels of distortion, which depend on the chosen quality level or compres-sion rate. Such attacks are completely deterministic but also difficult to model.
Enhancement Very common image processing techniques fall into this category, such as luminos-ity adjustment, sharpening/blurring, contrast adjustment, edge enhancement.
2.3.3 DECODING
Different decoding methods are used for the various embedding techniques. For instance, correla-tion deteccorrela-tion is used when the watermark has been embedded using a modulacorrela-tion scheme. The correlation is computed between the attacked covertext ˜X (or the difference between the attacked and original data ˜X−X) and the watermark m. The correlation value is then compared with a pre-defined detection threshold. A watermark is detected if the correlation is above it. Notice that the original data is required for the decoder to perform efficiently.
Quantization decoding is usually carried out by mapping the attacked value to the nearest quan-tized value. Knowledge of the quantization process is sufficient for decoding.
A principled decoding method, examined later in this paper, is maximum a posteriori (MAP) decoding. Using probabilistic models of the data, watermark, embedding, noise and corruption pro-cess in conjunction with Bayesian statistics, one may obtain posterior mean values of the message as well as error-bars. Drawbacks of this method are: its sensitivity to the accuracy of the probabilistic models used, decoding is carried out in the feature space and at a high computational cost.
3. ICA for Watermarking
ICA was introduced several years ago as a blind source separation technique, but since then has been used in a broad range of applications, from sparse coding and denoising to feature extrac-tion (Hyv¨arinen et al., 2001). The main assumpextrac-tion in ICA is that a given signal can be represented as a linear mixture of statistically independent sources. This property combined with the simplicity of a linear mixture model have made ICA a powerful and useful tool in various research fields.
In the context of watermarking, an ICA based technique has been studied by Gonz ´alez-Serrano et al. (2001). The latter, unlike our approach, is related to a least significant bit modification in the ICA domain. Also, the reported results show quite poor performance. In our approach, ICA allows the maximization of the information content and minimization of the induced distortion by decom-posing the covertext (in this case the image) into statistically independent sources. Embedding infor-mation in one of these independent sources minimizes the emerging cross-channel interference. In fact, for a broad class of attacks and fixed capacity values, one can show that distortion is minimized when the message is embedded in statistically independent sources (Appendix A). Information the-oretical analysis also shows that the information hiding capacity of statistically independent sources is maximal (Moulin and O’Sullivan, 2003). Finally, this extremely simple transformation facilitates the use of Bayesian decoding techniques based on statistical models. They can be constructed due to the simple factorized statistics of the sources. Principled Bayesian techniques are expected to improve the decoding performance in real systems.
Another significant advantage of the ICA based approach is its independence with respect to the application domain. The distortion measure and the ICA mixing and demixing matrices may differ from one application domain to another, but the watermarking scheme principle remains the same.
3.1 ICA-based Watermarking as a Communication Problem
that ICA is a simple linear transformation, we concentrate on the feature space in modeling the sources, attacks and induced distortion.
ICA
ICA I I
encoding
message attack
~ ICA
m n
s ~ ^
s s
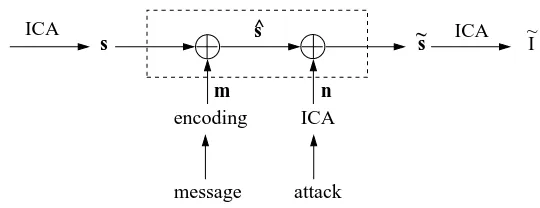
Figure 2: ICA watermarking as a communication problem. In this figure, I is the original image, s is the demixed signals, m is the message to embed, ˆs is the watermarked signals, n is the corruption noise, ˜s is the corrupted or attacked watermarked signals and ˜I is the attacked watermarked image.
Figure 2 describes the complete watermarking problem, separating the linear mixing/demixing operations from the communication channel itself (within the dashed line). In order to construct a proper statistical model of the process, we need to model the demixed signals s, which are the source realizations, any possible noise n, the attack process p(˜s|ˆs,n), the message m and the embedding process p(ˆs|s,m). For convenience, the distribution of m is set to be uniform on{0,1}. We generate a statistical model of s based on real data, in this case, a set of representative images.
The embedding process we use is based on Quantization Index Modulation (QIM) studied by Chen and Wornell (2001). The reasons for selecting this particular technique are:
• its reported high performance (it has been shown to approach optimal performance for some models),
• its inherent non-linearity, which makes it more secure (Craver, 1996),
• the simple statistical model it offers, and
• the simplicity of its implementation.
Finally, we choose to define the attack process as an additive process and fit the noise distribution according to this assumption.
3.2 ICA for Images
In experiments, we used the FastICA algorithm developed by Hyv ¨arinen and Oja (1997), which provides good decomposition results efficiently.
Since it is often impractical to use full size images (bigger than 32×32 pixels) as inputs, we apply the FastICA algorithm to square image patches. Various patch sizes are used in the literature, from 8×8 to 32×32 pixels. Two practical aspects have to be considered: processing time and the size of relevant features. Large patches are theoretically feasible, but their basis estimation is computationally demanding; on the other hand, a small patch size leads to poor performance in the watermarking process. A trade off between these two conflicting constraints has to be found.
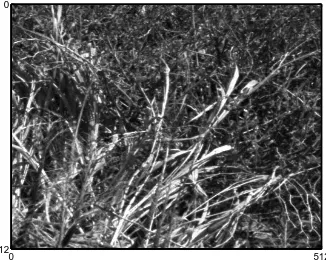
Based on this consideration and practical experiments, we constructed our basis (Figure 5) from a training set of 11 natural scene images (Figure 4), from which a set of 11,000 image patches of 16×16 pixels has been randomly sampled. The data obtained have then been centered. To remove noise and improve energy compaction, the data dimensionality was reduced using principal component analysis (PCA). The remaining 60 largest eigenvalues (Figure 3) preserved 98.68% of the data variance. The preprocessed dataset was used as input to the FastICA algorithm.
10 20 30 40 50 60 70 80
0 200 400 600 800 1000 1200 1400 1600 1800 2000
Images Patches PCA Eigenvalues
Eigenvalues Index
Eigenvalues Values
Figure 3: Image patch eigenvalues.
0 512
0
512
Figure 4: Example of a natural image.
50 100 150 200 250 300 350 400 450 500
50
100
150
200
250
300
4. ICA Watermarking Process
In this section, ICA based algorithms for robust and fragile watermarking are proposed. Both algo-rithms rely on an ICA feature space and QIM. Some differences, which we will highlight later on, make them more suitable to their respective purposes.
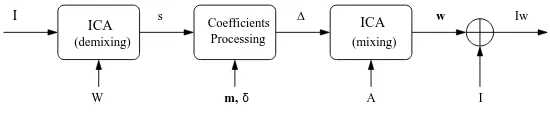
The general ICA based watermarking process comprises four stages as described in Figure 6.
1. The image is divided into contiguous image patches giving a set of mixed signals. Each patch is then demixed resulting in s, using a predetermined ICA demixing matrix W , prepared using an ensemble of typical images.
2. For each patch, a set of coefficients are selected according to the specific task (fragile or robust watermarking) as described below.
3. The selected coefficients are quantized and watermarked. The difference between the water-marked and original values is denoted by∆.
4. ∆ is multiplied by the mixing matrix A to produce w which is then added to the original picture I.
s w
m, ∆
A
Iw
I
δ
W
Coefficients
I
(demixing) Processing (mixing)
ICA ICA
Figure 6: ICA watermarking scheme.
Robust Watermarking Scheme ICs set selection: In order to achieve the best robustness, all allowed distortion is concentrated in one IC, using a large quantization step, which has been se-lected according to some criteria; for instance, robustness against certain types of attacks or suitable statistical properties. Furthermore, to improve imperceptibility we use slight modifications in non-selected ICs to compensate for the distortion induced by the quantization of the non-selected IC; this is carried out by minimizingkAˆsk, where ˆsiis the selected and quantized value and i the index of the
quantized source or IC; A is the mixing matrix.
Fragile Watermarking Scheme ICs set selection: For authentication purposes, one is required to detect changes in any given patch; therefore, a large set of ICs are selected in each patch to be quantized. The probability for a random replacement patch to have the same binary watermark is therefore p=2−n, where n is the number of quantized ICs, chosen to be sufficiently high so as to limit the feasibility of data counterfeiting. In the case of a replacement larger than the patch size, the probability of have the same binary signature can be approximated by pm, where m is here the number of involved patches (Figure 7).
100 200 300 400 500 50
100
150
200
250
300
350
400
450
500
100 200 300 400 500 50
100
150
200
250
300
350
400
450
500
Figure 7: Detection of a tampering attack using ICA-based fragile watermarking. In the left image, a square patch of 64×64 pixels has been attacked by a Gaussian noise of standard de-viation 0.5. The modified area is delimited by a white line. In the right image, the grey regions show the image patches, where a potential tampering attempt has been detected. A black line denotes the area where the modification has been carried out.
Such a watermark is easily destroyed as intended, but one may also want to ensure that the watermark survives mild non-malicious attacks that may occur in the recording or transmission process.
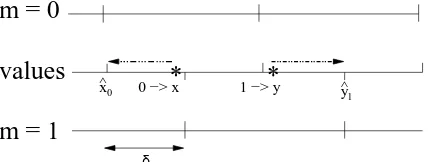
4.1 Watermark Embedding: Quantization Index Modulation
QIM (Chen and Wornell, 2001) is the embedding method used in our experiments. It can be seen as a quantization process, which uses two grids corresponding to the value of the message bit mi{0,1}
(Figure 8). As underlined, the relative simplicity of this embedding process facilitates the use of a statistical model to be used in the decoding process.
x0
^ y
1
^
m = 0
m = 1
values
*
*
0 −> x 1 −> y
δ
4.2 Watermark Decoding
After an attack, the task is to infer the embedded message vector m from the attacked (corrupted) value of the watermarked covertext ˜s. We will focus on two methods, a simple threshold based approach and on a principled Bayesian decoding method.
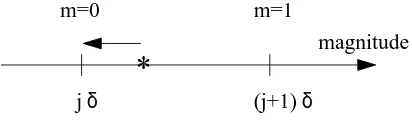
Decoding to the nearest grid point is probably the simplest decoding for a quantization em-bedding scheme, described in Figure 9. The robustness of the coding/decoding process is directly linked to the quantization stepδ used. The only requirement of this decoder is knowledge of the quantization grids.
(j+1)
jδ δ
m=0
*
magnitude m=1
Figure 9: Decoding to the nearest grid point; in this case the retrieved message m is 0.
MAP decoding relies on selecting m values that maximize the posterior probability p(m|˜s)as an estimate of the message, ˆm=maxmp(m|˜s). Using Bayes rule, we obtain
p(m|˜s) = p(˜s|m) p(m) p(˜s) .
Exploiting the fact that all components of the source s and message m are identically independently distributed and assuming that correlations emerging from the attack process are negligible, one can reduce the multidimensional problem to a factorized single variable inference problem. As p(m) has been chosen uniformly and given the fact that p(˜s) is a normalization term independent of m, one may reduce the inference problem to ˆmi∝maxmip(s˜i|mi)over the two mivalues, where i is the
index in the vector. From now on, the latter index i will be omitted to simplify the notation.
s
1,n−1s
0,ns
1,n+1^
^
^
f(x)
Figure 10: Probability of having ˆs0,ngiven m=0.
The probability of having a given quantized value, say ˆsm=0,n, which embeds the message m=
0 is central to our calculation. The expression provided in Equation 1 is based on the fact that any value between two consecutive grid points ˆsm=1,n, watermarked by a message m=0 will be
represents the embedded bit value and the second represents the running quantization number on the combined grid. One straightforwardly derives the expression
P(s0ˆ ,n|m=0) =
Z s1,ˆ n+1
ˆ
s1,n−1
f(x)dx, (1)
that relies on the source probability density function f which is not known analytically.
From the Markov chain in Figure 2, and using the probabilistic attack model we constructed previously, we derive the following conditional probabilities that facilitate the MAP estimate of m:
p(s˜|m=0) =
∑
n
pn(s˜−s0ˆ,n)
Z s1,ˆ n+1
ˆ
s1,n−1
f(x)dx,
=
∑
ˆs0
pn(s˜−sˆ0)P(sˆ0|m=0),
p(s˜|m=1) =
∑
n
pn(s˜−s1ˆ,n)
Z s0,ˆ n+1
ˆ
s0,n−1
f(x)dx,
=
∑
ˆs1
pn(s˜−sˆ1)P(sˆ1|m=1),
where pn(s˜−sˆ.,n) represents a noise model, the argument of which is the difference between the
watermarked and attacked IC values.
Clearly the method relies heavily on obtaining reliable probabilistic models for both sources and the attack process. In this study, we constructed a statistical model for the watermarking problem based on an ICA feature space of digital images. A model for f , based on the family of Generalized Gaussian Exponential (GGE) has been derived and statistically tested in Appendix B. In order to obtain a better model, more elaborate distributions, such as mixtures of Gaussian, may be used. The disparity between image and noise sources, s and n, and the constructed probabilistic models p(s) and p(n), respectively, is measured by theχ2 test (Appendix C and D). Three MAP based decoders are devised for three different attacks: JPEG compression, set partitioning in hierarchical trees (SPIHT) compression and Gaussian noise.
5. Experiments and Results
To test the performance of our watermarking scheme against existing state of the art methods, we carried out a set of experiments for each of the watermarking tasks.
5.1 Experiments
For a given image, attack type and attack strength, the test was repeated 100 times with a differ-ent embedded message m of length 1024. In the next subsection, we give a brief description of the algorithms. The complete settings of experiments can be found in Appendix E.
Fragile Watermarking - We tested our fragile watermarking scheme’s ability to detect modified patches. In order to simulate a tampering process, a randomly located square patch of 16×16 pixels in the watermarked picture was modified by the addition of random noise. Since the size of our image patches is 16×16, this attack can affect up to four image patches of our scheme. Each one of the four potentially affected patches has only 128 pixels involved on average. This means that 75% of the patch is unaffected by the tampering. The detection was considered successful if some of the fragile watermark bits could not be correctly retrieved from the corresponding region. For a given image, attack strength and length of message, the test was repeated 100 times with a different message. The embedded messages m were of length 1024×n, where n is the number of bits embedded per patch and 1024 is the number of patches per image. In this test, we setδnat 0.1,
which gave us a different distortion for each n between 49 and 50 dB PSNR.
We also tested the robustness of our scheme against non-malicious mild attacks such as Gaussian noise or JPEG compression with respect to the number of bits embedded per patch. The trade off between robustness and fragility had to be set according to the final purpose of the watermarking application. In our scheme, the watermark fragility is increased by increasing the number of ICs to modify per patch; doing so also reduces the probability for a random patch to carry the same binary signature. It is also possible to increase the fragility by decreasing the quantization step δn, or by considering several adjacent patches together if the relevant feature size in the picture
is large. Physical limits of the digital image storage (quantization) set a lower bound to δn. For
our experiments, we set the watermarking distortion threshold to 43dB PSNR and distributed all this distortion allowance across the set of selected ICs. Details of parameters used can be found in Appendix E. For a given image, attack strength and length of message, the test was repeated 10 times with different messages. The length of the embedded messages m was 1024×n, where n is the number of bits embedded per patch.
5.2 Algorithm Descriptions
The various algorithms described below are based on quantization of a selected set of coefficients in their respective feature space. The preselection of these sets is also described below.
ICA Sel This is an ICA based algorithm, where we preselect a small subset of ICs that are particu-larly robust against a specific attack; a single IC is then randomly selected from this subset to be watermarked in each patch. Decoding is carried out by mapping to the nearest grid point.
ICA Ne This ICA based algorithm is introduced as a benchmark for the ICA Map algorithm, to show the improvement gained from using a principled decoding method instead of decoding to the nearest grid point. A single IC is selected to be watermarked in all patches for a given attack; the selection criterion is not directly related to its robustness against specific attacks, but having a good agreement with the corresponding source and attack models, according to theχ2test. Decoding to the nearest grid point is used.
DCT A standard, commonly used, DCT based algorithm. It quantizes (QIM) the DCT representa-tion of the entire picture. Among the DCT coefficients which represent a signal with at least one cycle per image patch of 16×16, the 1024 lowest frequency ones convey the watermark. The watermarked picture is then obtained by application of an inverse DCT. Decoding to the nearest grid point is used.
DCTX A local DCT based algorithm. It relies on a partitioning of the picture into contiguous patches of 16×16 pixels. The DCT is applied to each of them. For each patch, a single coefficient is randomly selected among the low frequency ones, and quantized (QIM). An inverse DCT is then applied to obtain each watermarked patch. Decoding to the nearest grid point is used.
DWT A multiresolution wavelet transform based watermarking algorithm. The detail of the pro-cess can be found in (Kundur and Hatzinakos, 1998), but it basically relies on embedding the message in the third level of the Haar wavelet decomposition with some strength parameter (Q=2 in our case) that determines both the robustness achieved and the level of impercepti-bility. A correlation based decoder is used. Full details of the method and its parameters are given in (Kundur and Hatzinakos, 1998).
ICA Fra A fragile watermarking scheme using ICA feature space and QIM. The main difference with respect to robust ICA-based watermarking method, is that here one embeds more infor-mation per patch by choosing several ICs in each patch but with a lower quantization step for each IC. The number of embedded bits and the quantization steps can be tuned to adapt to fragility/robustness requirements. Here, decoding to the nearest grid point is also used.
5.3 Results
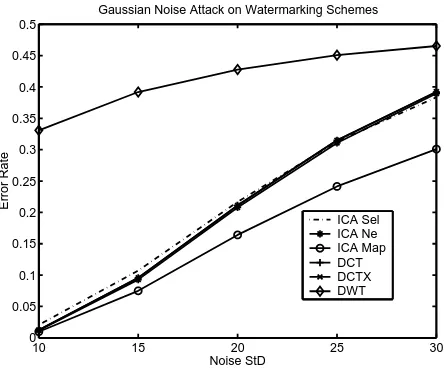
Robust Watermarking Results: The Gaussian noise attack results in Figure 11 show thatICA Sel,
ICA NeandDCTXperform as well as the globalDCTmethod, whileDWTis less robust across the
entire range of noise level. ICA Mapon the other hand, although based on an IC with sub-optimal robustness properties, outperforms all other schemes due to its good source and noise statistical models that have been exploited in the decoding process.
The JPEG compression attack results in Figure 12 show thatICA Selperforms equally well as theDCTXalgorithm. On the other hand,DCT andDWThave quite poor performances in general, whileICA NeandICA Mapperform as well asDCTXandICA Selin the entire range of acceptable compression rates (30-90), but show bad results for high compression. This is due to a breakdown of the statistical models for such high compression rates, indicated by the poorχ2test results, and the sub-optimal robustness properties of the selected IC.
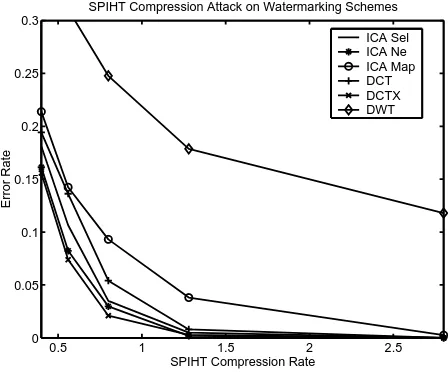
The SPIHT compression attack results in Figure 13 show thatICA Sel,ICA Ne,DCTandDCTX
have similar performances with slightly better performance showed byICA Sel and DCTX.DWT
performs quite poorly.ICA Mapalgorithm does not perform very well, presumably due to inaccurate source or/and noise models used in the decoding process.
The results show quite promising results for ICA algorithms in general, which are either com-petitive with, or outperform other state of the art methods. Improving the source and noise models may facilitate further improvements in performance.
10 15 20 25 30 0
0.05 0.1 0.15 0.2 0.25 0.3 0.35 0.4 0.45 0.5
Noise StD
Error Rate
Gaussian Noise Attack on Watermarking Schemes
ICA Sel ICA Ne ICA Map DCT DCTX DWT
Figure 11: Performance of watermarking schemes against Gaussian noise
10 20 30 40 50 60 70 80 90 0
0.2 0.4
JPEG Quality Level
Error Rate
JPEG Compression Attack on Watermarking Schemes
ICA Sel ICA Ne ICA Map DCT DCTX DWT
Figure 12: Performance of watermarking schemes against JPEG compression
was designed to tolerate. The probability of identifying and locating the attacked patch then follows directly from the number of bits embedded in each patch.
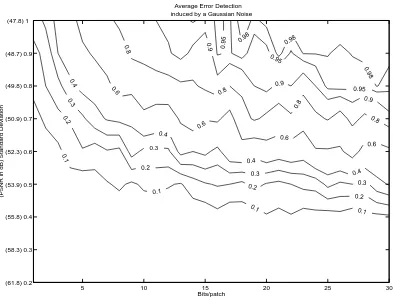
To study the fragility and robustness properties of our fragile watermarking scheme, ICA Fra, we conducted a set of experiments to determine the probability of identifying an attacked patch, and the percentage of decoding errors observed under mild Gaussian and JPEG attacks. The results of these experiments are shown in Figure 14 and Figure 15 respectively.
0.5 1 1.5 2 2.5 0
0.05 0.1 0.15 0.2 0.25 0.3
SPIHT Compression Rate
Error Rate
SPIHT Compression Attack on Watermarking Schemes
ICA Sel ICA Ne ICA Map DCT DCTX DWT
Figure 13: Performance of watermarking schemes against SPIHT compression
that intensity levels are in the range 0-255) and different numbers of marked bits per patch. The probability of detection is marked on the curved lines with respect to the number of bits embedded per patch (horizontal axis) and the noise level (vertical axis). We see that even in relatively low noise levels, it is still possible to identify the attacked patches.
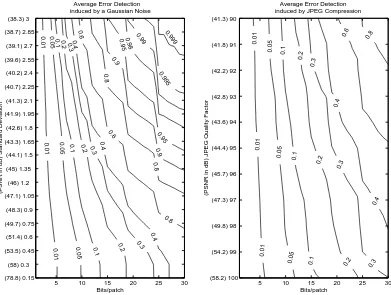
In the second set of experiments we studied the robustness of our method against global non-malicious attacks, Gaussian noise and JPEG, as shown in Figure 15. The figures describe the frac-tion of decoding errors (marked on the curved lines) as a funcfrac-tion of the number of bits marked per patch (horizontal axis) and the noise level (vertical axis). Clearly, a higher number of bits marked per patch for a given distortion, will result in smaller quantization steps and lower robustness. The results show thatICA Fraprovides an efficient fragile watermarking method even in the presence of mild non-malicious attacks. The embedded fragile watermark, of a given low distortion (43dB PSNR), can easily and reliably be identified using 10 bits per patch (with probability for a random patch to carry the same signature of 0.1%).
Another aspect of our method that one should emphasize is that A and W are unknown to the forger; this, combined with small typical quantization steps will make it very difficult to forge a watermark.
6. Conclusion
We have presented a novel approach to both robust and fragile watermarking, using ICA as the fea-ture space in which watermarks are embedded. The new approach, based on embedding information in statistically independent sources, shows high information embedding rate and minimal distortion. We have examined its performance on a set of representative images, random messages and various attacks, and our experiments show promising performance on all the attacks examined.
5 10 15 20 25 30 (61.8) 0.2
(58.3) 0.3 (55.8) 0.4 (53.9) 0.5 (52.3) 0.6 (50.9) 0.7 (49.8) 0.8 (48.7) 0.9 (47.8) 1
Bits/patch
(PSNR in dB) Standard Deviation
Average Error Detection induced by a Gaussian Noise
0.1
0.1
0.1
0.1 0.2
0.2
0.2
0.2
0.3
0.3
0.3
0.3
0.4
0.4
0.4
0.4 0.6
0.6
0.6
0.6
0.8
0.8
0.8
0.8
0.9
0.9
0.9
0.95
0.95
0.95 0.98 0.98
0.98
Figure 14: ICA Fra watermarking for local distortion detection.
and offers additional security in the use of specific mixing/demixing matrices that are not easy to obtain. The provided statistical models for both sources and attacks facilitates the use of a Bayesian decoding method that has the potential to provide an optimal decoding scheme.
Further research may improve the performance by refining the existing statistical models or identifying a new approach for selecting the IC’s to be watermarked or the distortion measures used (for instance a measure based on the human visual system). Applying the same approach to other domains, such as audio signals (Toch et al., 2003), may also require some adaptations due to the different nature of the signals.
Appendix A. Proof
In this appendix, we will show that a blockwise memoryless watermarking process, for a given power-limited class of blockwise memoryless attacks and a fixed capacity, minimizes the distor-tion it induces when the sources s to watermark are independent. This result will be derived from (Moulin and O’Sullivan, 2003), proposition 8.3.
It is assumed that s is a blockwise memoryless source with block size L, that the attack is also blockwise memoryless with blocks of same size L and that the class of attacks
A
is limited by a distortion constraint. Let p(s) =∏Li=1p(si) be the product of the marginals p(si). Theorem5 10 15 20 25 30 (78.8) 0.15 (58) 0.3 (53.5) 0.45 (51.4) 0.6 (49.7) 0.75 (48.3) 0.9 (47.1) 1.05 (46) 1.2 (45) 1.35 (44.1) 1.5 (43.3) 1.65 (42.6) 1.8 (41.9) 1.95 (41.3) 2.1 (40.7) 2.25 (40.2) 2.4 (39.6) 2.55 (39.1) 2.7 (38.7) 2.85 (38.3) 3 Bits/patch
(PSNR in dB) Standard Deviation
Average Error Detection induced by a Gaussian Noise
0.01 0.01 0.01 0.05 0.05 0.05 0.1 0.1 0.1 0.2 0.2 0.2 0.3 0.3 0.3 0.4 0.4 0.4 0.6 0.6 0.6 0.8 0.8 0.9 0.9 0.95 0.95 0.98 0.99 0.995
5 10 15 20 25 30 (41.3) 90 (41.8) 91 (42.2) 92 (42.8) 93 (43.6) 94 (44.4) 95 (45.7) 96 (47.3) 97 (49.8) 98 (54.2) 99 (58.2) 100 Bits/patch
(PSNR in dB) JPEG Quality Factor
Average Error Detection induced by JPEG Compression
0.01 0.01 0.01 0.05 0.05 0.05 0.1 0.1 0.1 0.2 0.2 0.2 0.3 0.3 0.3 0.4 0.4 0.6 0.8 0.999
Figure 15: ICA Fra watermarking for global distortion detection.
watermarking game against an attacker subject to a distortion constrain for embedding, assuming the distribution p(s):
C=max
Q∈QminA∈AJ(Q,A),
where Q denotes the probability density function of the embedding channel, A the probability distri-bution function of the attack channel and J represents the cost function (information rate), described in section 4.3 of (Moulin and O’Sullivan, 2003).
Let us first fix the class of attacks
A
. From proposition 8.3 in (Moulin and O’Sullivan, 2003) and using the same notations, we derive that, subject to a given maximum embedding distortion D1, the capacity C of any distribution p(s)and the capacity C of p(s)are related by C≤C.For a given distribution p(s), if D and D0 are two maximum embedding distortions and C and C0are the respective capacities, then D≤D0is equivalent to having C≤C0. It can be easily proved, since the capacity is defined as the maximum over a set of probability density functions
Q
. Increas-ing the distortion, increases the setQ
thus resulting in a higher capacity.If there exists a maximum embedding distortion D2 such that the capacity C2 of p(s) subject to D2, admits C2 =C, then, according to the result from the previous paragraph applied to the distribution p(s), we obtain D2≤D1.
Appendix B. Generalized Gaussian or Exponential Distributions forν=1/k and
ν=2/k
The general expression of densities belonging to this family is (for zero mean)
px(x) =C exp
− |x|
ν νE{|x|ν}
.
The positive real-valued powerνdetermines the type of distribution, and C is a normalizing con-stant. Two families of probability density functions and probability functions, for ν=1/k and ν=2/k are given below.
The GGE(1/k) family probability density function and probability function are given below, whereσrepresents the distribution’s standard deviation.
f1
k(x) =
1
2k!√tkσexp
n
− |x| 1
k
√tσ1
k
o ,
F1
k(x) =
1 2+ 1 2sign(x) ( 1− k
∑
i=1
|x|k−ki
(k−i)!tk−2iσ
k−i k
)
,
t = (k−1)! (3k−1)!
1k .
The GGE(2/(2m+1))family expressions are given by the following equations, whereσis the standard deviation.
f 2
2m+1(x) =
1
√
2π∏mi=i(2i+1)Σ2m+1exp n
−|x| 2
2m+1
2Σ2 o
,
F 2
2m+1(x) =
1 2+sign(x) ( 1 2+ 1 √
2πΣ2m+1 m
∑
i=1
2m−i(m−i)! (2(m−i) +1)!|x|
2(m−i)+1
2m+1 Σ2i
···
expn−|x|
2
2m+1
2Σ2 o
−Φ(−|x| 1
2m+1
Σ ) )
,
Σ2 = 2 (2m)!(3m)! 2m!(6m+1)!
2m1+1 σ 2
2m+1 ,
Φ(u) = √2π Z u
0
exp(−t2)dt.
Appendix C. Theχ2Fitting Test
Theχ2test is a method for testing the relevance of a model against real data. It uses a data distribu-tion model, also called hypothesis, and a set of real data samples. The disparity between model and data is measured by a normalized quadratic difference, Equation 2. Then comparing theχ2 value obtained to a given threshold, the hypothesis is rejected or accepted. Theχ2expression is given by the following equation.
χ2=
∑
ki=1
(Mi−upi)2
upi
=
k
∑
i=1
where pi=F(bi)−F(ai)is the theoretical probabilities of x falling in∆i= [ai,bi), Mi being the
number of sample values in ∆i, with∑ki=1Mi=u. The border bins must satisfy npi ≥1 and the
others upi≥5; m=k−r−1 is the degree of freedom ofχ2where r is the number of parameters.
In our study, we used 26 bins of size 0.3 from −3.9 to 3.9, two borders bins are also added from−∞to -3.9 and from 3.9 to∞, so m=k−r−1=26−1−1=24, where r is the number of estimated parameters, the number of samples per signal is u=11000, then the critical valueχ2αis 36.4 (log10(χ2α) =1.56), for a confidence valueα=0.05, see Bronshtein and Semendyayev (1997) for further details.
Appendix D. Images and Attacks Modeling
D.1 Image Models
Experiments using theχ2test and aiming at modeling the image sources with the two GGE families and randomly sampled squared patches show that about 13% of the 60 ICs can be modeled by a GGE distribution withν=2/3 orν=1/2, as seen in Figure 16. In the case of MAP decoding, these ICs are therefore preferred, as explained in the text. Further research on more complex models may overcome the limitation represented by the restricted choice of ICs to watermark.
0 10 20 30 40 50 60
1 1.5 2 2.5 3 3.5 4 4.5
Log
10(χ
2) for GGE distributions
# ICs
Log
10
(
χ
2)
u=1/4 u=1/3 u=2/5 u=1/2 u=2/3
u=1 (Laplacian) u=2 (Gaussian)
Figure 16: χ2 fitting test - different GGE (ν∈ {14,13,52,12,23,1,2}) distributions are tested against some real data. The latter are obtained from a set of 11,000 randomly sampled images patches of 16×16 pixels demixed by a ICA demixing matrix W of 60 ICs.
D.2 Attacks Models
0 20 40 60 1
2 3 4
5 JPEG 10
Log
10
χ
2
0 20 40 60
1 2 3 4
5 JPEG 20
0 20 40 60
1 2 3 4 5
JPEG 30
# ICs
0 20 40 60
1 2 3 4 5
JPEG 50
# ICs
Log
10
χ
2
0 20 40 60
1 2 3 4 5
JPEG 90
# ICs
u=1/4 u=1/3 u=2/5 u=1/2 u=2/3
u=1 (Laplacian) u=2 (Gaussian)
Figure 17:χ2fitting test for JPEG compression models.
SPIHT Compression As shown in Figure 18, SPIHT compression is best modeled by the Lapla-cian distribution. However, as for JPEG compression, theχ2 values also show the need for refinements. As previously, we will use the closest distribution, for instance the Laplacian distribution as a first approximation for our experiments.
Gaussian Noise ICA is a linear transform and a linear combination of centered i.i.d. Gaussian vari-ables of the same variance remains Gaussian. Therefore Gaussian noise on images remains Gaussian in the ICA feature space with its standard deviation being a function of the original standard deviation and the demixing matrix W . In our study, ifσis the standard deviation of the noise attack, andσiis the standard deviation of the attack on a given IC, the latter can be
expressed asσi=k(WT)ikσ, wherek.kis the 2-norm and (WT)i is the ith column index of
the matrix WT.
Appendix E. Settings
In this section, we specify the different experimental settings for each algorithm and each attack;δ denotes the quantization step of the QIM process.
ICA Sel/DCT/DCTX/DWT: For these for algorithms, the same settings are used for all attacks and attack strengths. A set of ICs are first selected, then a proper quantization step is set, such that the distortion constraint requirement is obeyed.
0 20 40 60 1 2 3 4 5
SPIHT 0.4 bpp
Log
10
χ
2
0 20 40 60
1 2 3 4 5
SPIHT 0.56 bpp
0 20 40 60
1 2 3 4 5
SPIHT 0.8 bpp
# ICs
0 20 40 60
1 2 3 4 5
SPIHT 1.28 bpp
# ICs
Log
10
χ
2
0 20 40 60
1 2 3 4
5 SPIHT 2.8 bpp
# ICs
u=1/4 u=1/3 u=2/5 u=1/2 u=2/3 u=1 (Laplacian) u=2 (Gaussian)Figure 18:χ2Fitting Test for SPIHT Compression Models.
ICA Sel DCT DCTX DWT
Selected ICs/Coef {5, 55, 59} low frequency with at least one cycle per 16×16 pixels patch
{3, 4, 18, 19, 20, 33, 34, 35, 49, 50}, see Figure 19
The coefficients are randomly selected among the 3rd level decomposition
δ(or Q for DWT) 0.7 50 50 2
Table 1: ICA Sel/DCT/DCTX/DWT algorithm experimental settings
This might also explain the lack of improvement shown by theICA Map algorithm in simulations for this particular attack.
ICA Fra: A set of ICs is randomly drawn from a pre-selected set and quantized using a quanti-zation stepδn, where n is the number of quantized ICs. The pre-selected ICs are the ones within the
range 11-40. The different quantization steps are given in Table 3, for a fixed induced distortion of 43dB PSNR.
Appendix F. Numerical Results
16
16
16
1 49
2
3
4 17
18
19
20 33
34
35 50
Figure 19: DCTX algorithm coefficient selection.
GN JPEG SPIHT
Strength 10-30 10 20 30 50 90 0.4 0.56 0.80 1.28 2.8
Selected ICs 19 16 34 43 28 15 20 23 17 23 20
δ 1.2 2.3 3 1.2 2.2 1.9 2 2 2 2 2
Source Model 5 5 5 5 5 5 5 5 5 5 5
χ2 34.0 25.4 68.3 92.5 49.4 22.9 34.5 43.0 26.7 43.0 34.5
Noise Model 7 6 6 7 7 7 6 6 6 6 6
χ2 - 50.6 57.1 55.3 78.5 35.5 50.7 49.3 36.6 45.1 98.8 Table 2: ICA Ne/Map algorithm experimental settings, where GN stands for Gaussian Noise, and
the noise models correspondences are: 5 for GGE(2/3), 6 for GGE(1) or Laplacian and 7 for GGE(2) or Gaussian.
References
I.N. Bronshtein and K.A. Semendyayev. Handbook of Mathematics. Springer-Verlag, 1997.
B. Chen and G.W. Wornell. Quantization index modulation: a class of provably good methods for digital watermarking and information embedding. IEEE Transactions on Information Theory, 47 (4):1423–1443, May 2001.
A.S. Cohen and A. Lapidoth. The gaussian watermarking game. IEEE Transactions on Information Theory, 48(6):1639–1667, June 2002.
Number of quantized ICs - v 1 2 3 4 5 6 7-8
δv 1.6 1.15 0.9 0.8 0.7 0.65 0.55
Number of quantized ICs - v 9 10-11 12-13 14-18 19-24 25-30
δv .5 .45 .4 .35 .3 .25
STD ICA Sel ICA Ne ICA Map DCT DCTX DWT 10 0.0206 0.0118 0.0098 0.0125 0.0123 0.3308 15 0.1064 0.0929 0.0750 0.0955 0.0957 0.3919 20 0.2165 0.2079 0.1641 0.2112 0.2110 0.4277 25 0.3130 0.3107 0.2414 0.3149 0.3150 0.4506 30 0.3832 0.3895 0.3009 0.3919 0.3924 0.4653 MSE 3.3714 3.1249 3.1249 2.9285 3.1556 2.1830 PSNR 42.5588 42.8884 42.8884 43.1656 42.8466 45.6137
Table 4: Gaussian noise attack on watermarking schemes.
QL ICA Sel ICA Ne ICA Map DCT DCTX DWT
10 0.2594 0.3785 0.5548 0.3373 0.2979 0.4125 20 0.0769 0.2593 0.2708 0.1705 0.0611 0.3157 30 0.0130 0.0072 0.0071 0.1306 0.0052 0.2559 50 0.0001 0.0007 0.0007 0.0909 0.0000 0.1947
90 0 0 0 0.0000 0 0.1136
MSE 3.3680 3.2757 3.2757 2.9326 2.0303 2.1941 PSNR 42.5633 42.7187 42.7187 43.1596 44.7611 45.6032
Table 5: JPEG attack on watermarking schemes.
Final Committee. JPEG2000 part 1 draft version 1.0. tech. rep. FCD15444-1, ISO/IEC, March 2000.
I.J. Cox, J. Kilian, T. Leighton, and T. Shamoon. Secure spread spectrum watermarking for multi-media. IEEE Transactions on Image Processing, 6(12):1673–1687, December 1997.
I.J. Cox, M.L. Miller, and J.A. Bloom. Digital Watermarking. Morgan Kaufmann Publishers, 2002.
S. Craver. Can invisible watermarks resolve rightful ownership? Technical Report RC 20509, IBM Research Report, July 1996.
Rate ICA Sel ICA Ne ICA Map DCT DCTX DWT 0.40 0.1812 0.1613 0.2138 0.1942 0.1558 0.3725 0.56 0.1065 0.0823 0.1424 0.1362 0.0738 0.3106 0.80 0.0350 0.0298 0.0931 0.0541 0.0210 0.2477 1.28 0.0049 0.0018 0.0381 0.0080 0.0029 0.1787
2.80 0 0 0.0026 0 0 0.1180
MSE 3.3702 3.4640 3.4640 2.9284 2.0279 2.1836 PSNR 42.5602 42.4620 42.4620 43.1658 44.7665 45.6141
F.J. Gonz´alez-Serrano, H.Y. Molina-Bulla, and J.J. Murillo-Fuentes. Independent component anal-ysis applied to digital watermarking. In International Conference on Acoustic, Speech and Signal Processing (ICASSP), volume 3, pages 1997–2000, May 2001.
A. Hyv¨arinen, J. Karhunen, and E. Oja. Independent Component Analysis. Wiley-Interscience, 2001.
A. Hyv¨arinen and E. Oja. A fast fixed-point algorithm for independent component analysis. Neural Computation, 9(7):1483–1492, 1997.
A.K. Jain. Fundamentals of Digital Image Processing. Pearson Higher Education, 1989.
E. Koch and J. Zhao. Towards robust and hidden image copyright labelling. IEEE Workshop on Nonlinear Signal and Image Processing, pages 452–455, October 1995.
D. Kundur and D. Hatzinakos. Digital watermarking using multiresolution wavelet decomposition. In International Conference on Acoustic, Speech and Signal Processing (ICASSP), volume 5, pages 2969–2972, May 1998.
P. Meerwald. Digital Image Watermarking in the Wavelet Transform Domain. PhD thesis, Univer-sity Salzburg, January 2001.
P. Moulin and J.A. O’Sullivan. Information-theoretic analysis of information hiding. IEEE Trans-actions on Information Theory, 49(3):563–593, March 2003.
F.A.P. Petitcolas and M.G. Kuhn. Stirmark 4.0. Available electronically from
http://www.cl.cam.ac.uk/˜fapp2/watermarking/stirmark/, 2002.
M. Ramkumar. Data Hiding in Multimedia - Theory and Applications. PhD thesis, New Jersey Institute of Technology, January 2000.
J.J.K. ´O Ruanaidh and T. Pun. Rotation, scale and translation invariant digital image watermarking. In Proceedings of the International Conference on Image Processing, pages 536–539, October 1997.
A. Said and W.A. Pearlman. A new fast and efficient image codec based on set partitioning in hierarchical trees. IEEE Transactions on Ciruits and Systems for Video Technology, 6:243–250, June 1996.
B. Toch, D. Lowe, and D. Saad. Watermarking of audio signals using independent component analysis. In International conference on WEB delivering of music, pages 71–74, September 2003.