Available online at www.JGTPS.com
Research Article
ISSN:2230-7346
Journal of Global Trends in Pharmaceutical Sciences
Volume .4, Issue 1, pp -989-998, January–March 2013
DEVELOPMENT AND VALIDATION OF A STABILITY INDICATING RP-HPLC METHOD FOR THE QUANTITATIVE DETERMINATION OF DEXIBUPROFEN IN
PHARMACEUTICAL FORMULATIONS
Jayam Naga Sateesh1, Gopireddy Venkata Subba Reddy2*and K.N.Jayaveera3
1. Department of Chemistry, PRRM College of Pharmacy, Kadapa, (A.P), INDIA. 2. Department of Chemistry, Jawaharlal Nehru Technological University Anantapur
College of Engineering, Pulivendula, (A.P), INDIA–516 390
3. Department of Chemistry, Jawaharlal Nehru Technological University Anantapur, Anantapur, (A.P), INDIA – 515 002.
*Corresponding Author E-mail:[email protected]
ABSTRACT
Dexibuprofen is commonly used as Non Steroidal Anti Inflammatory Drug (NSAID) in place of ibuprofen to achieve higher pharmacological activity. The main aim and focus of present study is to develop RP-HPLC method and validation in stability indicating manner as per ICH guidelines for the quantification of Dexibuprofen in bulk drug and pharmaceutical formulations. The optimized chromatographic conditions includes a C-18 RP-HPLC column as stationary phase (i.e. Thermo Hypersil ODS, 150 X 4.6mm, 5µm) and the mobile phase pumped with the flow rate of 1.0 ml/min and the eluent was monitored at 220 nm were established. The mobile phase contains a combination of buffer (acetic acid & triethylamine buffer) and acetonitrile in the ratio of 40:60% (v/v). The developed LC method is a simple, rapid, precise, specific and accurate for the determination of Dexibuprofen in the range of 20% to 200% of working concentrations with 0.2 µg mL-1
value of LOQ and 0.05 µg mL-1value of LOD.
Keywords:Dexibuprofen, NSAID, RPHPLC Method, validation and stability indicating
INTRODUCTION
Dexibuprofen [1] is an S (+) Enantiomer of Ibuprofen. Ibuprofen [2] is a widely used as NSAID (Non Steroidal Anti Inflammatory Drug) in a racemic mixture. Dexibuprofen chemically known as
(2S)-2-[4-(2-methylpropyl) phenyl]propanoic acid. The molecular formula is C13H18O2
[3-5]. When Ibuprofen is administered in to the body the R(-)-Ibuprofen present in the racemic mixture will be inverted in to S(+)-Ibuprofen to the extent of 57-69%. And also with respect to pharmacological activity S(+)-Ibuprofen is 160 times more potent than R(-)-Ibuprofen [6-7]. It is used for symptomatic relief of osteoarthritis, primary dysmenorrheal, muscular-skeletal pain or dental pain.
Figure–1: Chemical Structure of Dexibuprofen
The main aim of the present work is to develop stability indicating RP-HPLC method for the quantitative estimation of Dexibuprofen in pharmaceutical formulations such as tablet, Extrude and Gel dosage forms etc. S(+)-Ibuprofen form is not official in any pharmacopoeias but literature survey reveals that there are limited techniques for the estimation of dexibuprofen in tablet form using HPTLC, UV Spectrophotometric methods and few HPLC methods in plasma and urine samples [8-16]. As per literature no article reported on unique method for quantitative estimation of Dexibuprofen from different dosage forms such as tablet, Extrudes & Gel by using RP-HPLC. Current research work mainly devoted to develop a simple, rapid, precise, accurate and reproducible isocratic RP-HPLC method for the determination of dexibuprofen and the developed method is validated with respect to specificity, LOD, LOQ, linearity, precision, accuracy, robustness. The forced degradation
studies were also performed on the drug products to show the stability indicating nature of the method and also to ensure the compliance in accordance with ICH guidelines [17].
EXPERIMENTAL
I. Chemicals and Reagents:
Sample of dexibuprofen pure drug was received from M/S Noven Life Sciences Private Limited, Hyderabad, India and tablet dosage form was purchased from market manufactured by M/S Zuventus Healthcare Ltd, -Mumbai, India. HPLC grade acetonitrile, ortho-phosphoric acid were purchased from M/S Qualigens Fine Chemicals, Mumbai, India. Triethylamine was purchased from M/S Loba chemic Mumbai, India. Glacial acetic acid was purchased from M/S Rankem, Mumbai, India. High pure water was prepared by using Millipore, Milli Q plus (Bedford, MA, USA) purification system.
II. Instrumentation:
III. Chromatographic Conditions:
An isocratic RP HPLC method was achieved with Thermo Hypersil ODS, 150X4.6mm; 5µm column using a mobile phase consisting mixture of buffer and acetonitrile in the ratio 40:60. The buffer consists of HPLC grade water: Acetic acid: Triethylamine (1000ml: 2.5ml: 0.5ml). The LC method was carried out with the flow rate of 1.0ml/min and the column eluent was monitored at 220 nm with the injection volume of 20µl. The total chromatographic runtime was 15 minutes and the column temperature was maintained at 250C.
IV. Preparation of Standard Solution:
The working standard solution was prepared at 50 µg.mL-1 concentration level for the estimation of dexibuprofen .The final concentration was achieved by eluting with diluent (30:70: water: Acetonitrile) from the stock solution of 1000µg.mL-1 of
dexibuprofen in methanol.
V. Preparation of sample solution:
Accurately weighed 100 mg of dexibuprofen equivalent tablet powder / Extrude / Gel and transferred into a 100 ml volumetric flask containing 60 ml of methanol and sonicated for 15 minutes. Then cooled to room temperature and made upto the mark with methanol. The resultant solution contains 1000 µg.mL-1, a supernatant liquid of this solution was filtered through 0.45 µm nylon membrane filter. Thus filtered solution was diluted from 5 mL to 100 mL using diluent (30:70: Water:Acetonitrile).
ANALYTICAL METHOD VALIDATION:
The current LC method was validated as per ICH guideline-Q2.
Specificity:
The specificity of the developed RP HPLC method for dexibuprofen was carried out in the following conditions,
Diluent & Placebo Interference Forced degradation study
Thermal stress (at 105°C)
Acid stress (with 5N HCl)
Alkali stress (with 5N NaOH)
Peroxide stress (with 10% H2O2)
Photolytic stress (1.2 Million Lux Hours)
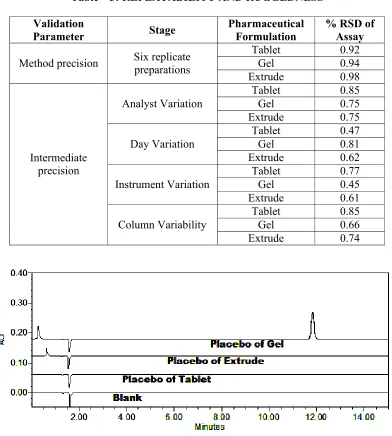
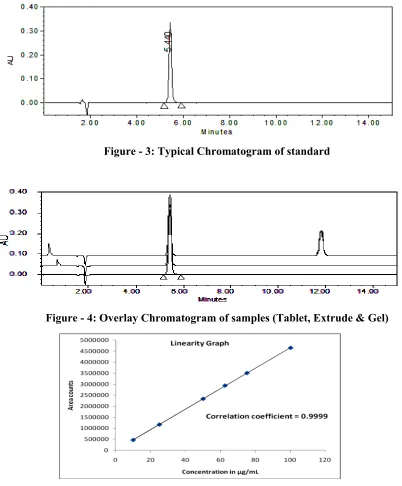
The above stressed samples were analyzed for peak purity studies using PDA. Thus degradation study provided an indication of stability indicating properties of the method. All the forced degradation samples were studied with the 60 minutes of total chromatography run time. The specificity related chromatograms were shown from figure-2 to figure-4, and also shown the compiled forced degradation data in the table-1.
Limit of Detection (LOD) and Limit of Quantification (LOQ):
using slope of linear curve with the following equations. The calculated LOD & LOQ values are 0.05 µg.mL-1 and 0.2 µg.mL-1respectively.
Limit of Detection
= 3.3 X Standard deviation of the response Slope of the calibration
curve
Limit of Quantitation =
10 X Standard deviation of the
response Slope of the calibration curve Precision and Linearity:
The precision for the quantification of Dexibuprofen by RPHPLC was verified by repeatability (system precision & method precision) and by ruggedness (intermediate precision) Repeatability & Ruggedness:
System precision
The system precision was performed by injecting ten replicate injections of the standard solution in to the chromatography .The % RSD for the peak of interest was calculated and found less than 1% (should be less than 2%). The established system suitability was tabulated with all parameters in table-2.
Method precision
The method precision was performed by preparing six replicate sample preparations as per testing procedure and injected in to the chromatography. The percentage w/w of dexibuprofen was calculated from six replicates and %RSD.
Intermediate precision (Ruggedness)
Ruggedness of the method was verified by analyzing the sample of same batch which was used for method precision as per testing procedure .This study was performed by different analyst, different instrument, different column and different day. For each variability the percentage assay and percentage relative standard deviation (%RSD) were calculated against method precision result. Overall percentage relative standard deviation (%RSD) for ruggedness and method precision results were calculated. Repeatability and Ruggedness data were reported in table-3.
Linearity:
The linearity of dexibuprofen was performed in the range of 10 µg.mL-1 to 100 µg.mL-1 (20% to 200% of working concentration). A linearity graph was plotted with concentration (in µg.mL-1) on X- axis and peak
areas on Y-axis. The linearity of the method was graphically represented in figure-5 including correlation coefficient value.
Accuracy (Recovery):
Range:
Range inferred from the data of Linearity, Accuracy and Precision. The method was found linear, accurate and precise in the range of 20% to 200% of working concentrations.
Filter variability and solution stability:
Filter interference study was performed on sample solution by filtering a part of solution through 0.45µm nylon membrane filter and another part of the solution centrifuged. Thus obtained solutions were analyzed as per testing standard procedure and compared against each other. The minimum percentage difference was found for the 0.45µm nylon membrane filter (0.05%) when compared with centrifuged sample. The prepared standard and sample solution were analyzed as per standard testing procedure at initial and different time intervals up to 24hours. The standard and filtered sample solutions were found stable at room temperature up to 24hours.
RESULTS AND DISCUSSION:
The current RP HPLC technique is most accurate, reliable and precise method of analysis for the quantitative estimation of dexibuprofen from its pharmaceutical formulations and dosage form. The specificity of the method was initially performed by injecting diluent and placebo in to the chromatography to check the contribution at the detection wavelength. The diluent and placebo shown negligible contribution at detection wavelength of the proposed method. The current method system suitability was accounted by
measuring USP tailing factor, USP Plate count for the peak of Dexibuprofen from Standard Solution and percentage RSD of Area for the peak of Dexibuprofen from five replicate injection of Standard Solution. The obtained values are 1.1 as USP tailing factor (should be not more than 2.0), 9000 as USP Plate count (should be not less than 2000) and percentage RSD of area as 0.5 (should be not more than 2.0).
The typical dexibuprofen retention time in the current developed method was about 5.4 minutes. The placebo of Gel shows a peak at about 12 minutes which was well separated with the peak of Dexibuprofen. Other placebo peaks of Gel and Extrude was eluted within 2 minutes. The current method was found repeatable and more rugged by performing the analysis with replicate preparations, by varying Analyst/Day/Instrument/Column. All variations resulted with the very good percentage RSD of Assay i.e. less than 1.0%.
Forced Degradation study
degradation of the drug product was observed under acid and thermal stress condition. The degradation of drug in all respective significant stress conditions is due to formation of non-chromophoric chemical moieties of decomposed dexibuprofen. The decomposition of dexibuprofen in thermal stress was due to its low melting range (49-53oC). The homogeneity of the dexibuprofen peak
was checked in PDA (Photo Diode Array) detector through peak purity tests for unstressed sample and stressed samples. The purity and assay of dexibuprofen was unaffected by the presence of its impurities and degradation products and thus confirms the stability indicating power of the developed method.
Table–1: Forced degradation data for Dexibuprofen in different formulations
Condition Pharmaceutical Formulation Assay% Degradati% on
Peak Purity of Dexibuprofen peak
Purity Angle
Purity threshold
Peak Puritya pass/fail Untreated Sample
Tablet 100.2 Not
Applicabl e
0.263 0.417
Pass
Gel 99.5 0.221 0.358
Extrude 100.8 0.268 0.408
Acid stressed sample (with 5N HCl)
Tablet 90.9 9.3 0.224 0.559
Pass
Gel 92.7 6.8 0.219 0.513
Extrude 88.6 12.2 0.261 0.486
Alkali stressed sample (with 5N NaOH)
Tablet 98.7 1.5 0.356 0.521
Pass
Gel 97.8 1.7 0.292 0.431
Extrude 98.1 2.7 0.275 0.487
Peroxide stressed sample (with 10% H2O2)
Tablet 99.0 1.0 0.219 0.493
Pass
Gel 92.1 5.7 0.306 0.512
Extrude 98.2 2.6 0.315 0.479
Thermal stressed sample (at 105°C)
Tablet 81.8 18.4 0.210 0.569
Pass
Gel 75.6 23.9 0.228 0.552
Extrude 78.2 22.6 0.216 0.493
Photolytic stressed sample (1.2 Million
Lux Hours)
Tablet 98.4 1.8 0.232 0.520
Pass
Gel 94.2 5.3 0.229 0.399
Extrude 98.1 2.7 0.281 0.455
Table – 2: System Suitability
Parameter Result Acceptance Criteria
USP Tailing Factor for the peak Dexibuprofen
from Standard Solution 1.1 Not more than 2.0
USP Plate count for the peak of Dexibuprofen
from Standard Solution 9000
Not be less than 2000 %RSD of area for the peak of Dexibuprofen
from five replicate injection of Standard Solution
0.5 Not more than 2.0
Table – 3: REPEATABILITY AND RUGGEDNESS
Validation
Parameter Stage Pharmaceutical Formulation % RSD of Assay
Method precision Six replicate preparations
Tablet 0.92
Gel 0.94
Extrude 0.98
Intermediate precision
Analyst Variation
Tablet 0.85
Gel 0.75
Extrude 0.75
Day Variation
Tablet 0.47
Gel 0.81
Extrude 0.62
Instrument Variation
Tablet 0.77
Gel 0.45
Extrude 0.61
Column Variability
Tablet 0.85
Gel 0.66
Extrude 0.74
Figure - 3: Typical Chromatogram of standard
Figure - 4: Overlay Chromatogram of samples (Tablet, Extrude & Gel)
Figure–5: Linearity Graph
CONCLUSION:
The main focus of this research article was developed and validated for the quantification of dexibuprofen in bulk drug and pharmaceutical formulations such as tablet, gel and extrude (it may be revised). The developed RP HPLC method offers simplicity, selectivity, precision, accuracy and economic.
REFERENCES
1. Budavari S., The Merck Index, Edn.12, Merck Research Lab., Division of Merck and Co., Inc., Whitehouse Station , N.J., 1996, 9. 2. Sweetman and Sean, Martindale,
The complete drug reference, 37th Edition, April2011.
3. R.A. Dionne and L. McCullagh, “Enhanced analgesia and suppression of plasma β-endorphin by the S (+)-isomer of ibuprofen,” Clinical Pharmacology and Therapeutics, vol.63, no.6, pp.694-701, 1998.
4. A. M. Evans, “Enantioselective
pharmacodynamics and
pharmacokinetics of chiral non-steroidal anti-inflammatory drugs, “European Journal of Clinical Pharmacology, vol.42, no.3, pp.237-256, 1992.
5. K. D. Rainsford, Pharmacology and Toxicology of Ibuprofen, Taylor &Francis, London, UK, 1999. 6. Lee EJD, Williams K, Day R,
Graham G, Champion D. Stereo selective disposition of ibuprofen enantiomers in man, B. J. Clin. Pharmacol. 1985; 19: 669-674. 7. Cheng H, Rogers JD, Demetriades
JL, Holland SD, Depuy E. Pharmacokinetics and bioinversion of ibuprofen enantiomers in humans. Pharm. Res. 1994; 11:824-830.
8. [8] Muralidharan S, Meyyanathan SN Validated HPTLC method ofanalysis of Dexibuprofen in its formulation, Jr of Planar Chromatography – Modern TLC. Vol 22, No.3; June 2009:207-210.
9. P.G. Dhartarkar, R. V. Kalamkar, S. D. Saoji, G. Ingle, S.C. Atram, Madhuri D. Game. Development and validation of uv spectrophotometric method for estimation of dexibuprofen in bulk and dosage form. Der Pharma Chemica, 2011, 3(4):361-366. 10. A. D. Hulst, p. Augustijns, S. Arens
et al., “Determination of artesunate by capillary electrophoresis with low UV detection and possible applications to analogues,” Journal of Chromatographic Science, vol. 34, no. 6, pp. 276-281, 1996.
11. J. Krzek, M. Starek, and D. Jelonkiewicz, “RP-TLC determination of S (+) and R (-) ibuprofen in drugs with the application of chiral mobile phase and UV densitometric detection,” Chromatographia, vol. 62, no. 11-12, pp. 653-657, 2005.
12. P. D. Sethi, Identification of Drugs in Pharmaceutical Formulations by Thin Layer Chromatography, CBS Publisher, New Delhi, India, 1992. 13. C. J. T. Thomas and S. Savage,
“High-performance liquid chromatographic determination of ibuprofen in bulk drug and tablets,” Drug Development and Industrial Pharmacy, vol. 11, no. 5, pp. 1123-1131, 1985.
15. H.Thomas Karnes, K. Rajasekharaiah, E. Ralph Small, and |D. Farthing, “Automated solid phase extraction and hplc analysis of ibuprofen in plasma,” Journal of Liquid Chromatography and Related Technologies, vol. 11, no. 2, pp.489-499, 1988.
16. U. Mandal, A. Das, S. Agarwal Uday Chakraborty, Utpal Nandi, Tapas Kumar Chattaraj, Tapan Kumar Pal., “Bioequivalence study of two formulations containing 400mg dexibuprofen in healthy Indian subjects,”Arzneimittel-Forschung, vol. 58, no. 7, pp. 342-347, 2008.