Visualizing the Path of DNA through Proteins Using DREEM
Imaging
Dong Wu1,6, Parminder Kaur2,6, Zimeng M. Li3, Kira C. Bradford1, Hong Wang2,4,*, and
Dorothy A. Erie1,5,*
1Department of Chemistry, University of North Carolina, Chapel Hill, NC 27599, USA
2Department of Physics, North Carolina State University, Raleigh, NC 27695, USA
3Department of Physics and Astronomy, University of North Carolina, Chapel Hill, NC 27599,
USA
4Center for Human Health and the Environment, North Carolina State University, Raleigh, NC
27695, USA
5Curriculum in Applied Sciences and Engineering, University of North Carolina, Chapel Hill, NC
27599, USA
SUMMARY
Many cellular functions require the assembly of multiprotein-DNA complexes. A growing area of structural biology aims to characterize these dynamic structures by combining atomic-resolution crystal structures with lower-resolution data from techniques that provide distributions of species, such as small-angle X-ray scattering, electron microscopy, and atomic force microscopy (AFM). A significant limitation in these combinatorial methods is localization of the DNA within the
multiprotein complex. Here, we combine AFM with an electrostatic force microscopy (EFM) method to develop an exquisitely sensitive dual-resonance-frequency-enhanced EFM (DREEM) capable of resolving DNA within protein-DNA complexes. Imaging of nucleosomes and DNA mismatch repair complexes demonstrates that DREEM can reveal both the path of the DNA wrapping around histones and the path of DNA as it passes through both single proteins and multiprotein complexes. Finally, DREEM imaging requires only minor modifications of many existing commercial AFMs, making the technique readily available.
Graphical abstract
*Correspondence: [email protected] (H.W.), [email protected] (D.A.E.).
6Co-first author
AUTHOR CONTRIBUTIONS
D.W. and D.A.E. invented the DREEM method. K.C.B. prepared human mismatch repair protein-DNA samples. D.W., P.K., Z.M.L., H.W., and D.A.E. designed and conducted experiments, analyzed data, and wrote the manuscript.
HHS Public Access
Author manuscript
Mol Cell. Author manuscript; available in PMC 2017 January 21.
Published in final edited form as:
Mol Cell. 2016 January 21; 61(2): 315–323. doi:10.1016/j.molcel.2015.12.012.
A
uthor Man
uscr
ipt
A
uthor Man
uscr
ipt
A
uthor Man
uscr
ipt
A
uthor Man
uscr
INTRODUCTION
DNA transactions in the cell, such as replication, repair, and transcription, require the assembly of multiple proteins on DNA. Determining the structures of these complexes is essential to understanding their function; however, several factors make characterization of multiprotein-DNA complexes particularly difficult. First, many of the individual proteins are large and contain structured domains connected to one another by intrinsically disordered regions, making them conformationally diverse. Second, the assembly of the different proteins is not necessarily an ordered process, which results in a heterogeneous population of complexes with different conformations and containing different protein stoichiometries (Luijsterburg et al., 2010). Finally, the assembly process may occur over long DNA lengths and/or bring distal DNA regions together. An emerging area of structural biology, which is beginning to address this problem, is the combination of high-resolution data from crystallography and NMR with lower-resolution data from techniques such as small-angle X-ray scattering, which provides estimates of the distribution of conformational states (Hennig and Sattler, 2014; Hura et al., 2013a, 2013b; Williams et al., 2014), and electron microscopy (EM) and atomic force microscopy (AFM), which provide images of individual complexes (Bustamante et al., 1994; Erie et al., 1994; Griffith, 2013; Griffith and
Christiansen, 1978; Janićijević et al., 2003; Lohr et al., 2007; Lyubchenko et al., 2001; Maletta et al., 2014; Moreno-Herrero et al., 2005; Sanchez et al., 2013; Trinh et al., 2012; Villarreal and Stewart, 2014; Wanner and Schroeder-Reiter, 2008; Yang et al., 2003; Yeh et al., 2012). Although these hybrid methods are promising, a significant limitation to the existing lower-resolution techniques is their limited capability for resolving the location of the nucleic acids within protein-DNA complexes. Phosphorus mapping through electron spectroscopic imaging (ESI) has been used to characterize the nucleic acid distribution in transcriptionally active chromatin (Bazett-Jones et al., 1996). In addition, recent advances in the sorting of particles in cryoEM datasets are beginning to allow visualization of multiple conformations (Orlova and Saibil, 2010), and the trajectories of DNA have been estimated
A
uthor Man
uscr
ipt
A
uthor Man
uscr
ipt
A
uthor Man
uscr
ipt
A
uthor Man
uscr
by tagging the end of DNA with streptavidin (Miyata et al., 2005; Villarreal and Stewart, 2014). Finally, recent EM studies revealed the location of the DNA in human RNA polymerase complexes (He et al., 2013) and the RNA in the ribosome (e.g., Brown et al., 2014; Fernández et al., 2013). Currently, no microscopy method allows visualization of DNA within flexible and/or large heterogeneous protein-DNA complexes. Because scanning force microscopy methods can provide images of individual complexes and because both proteins and DNA are significantly charged and interactions between proteins and DNA result in charge neutralization, we reasoned that it may be possible to visualize the path of DNA within individual protein-DNA complexes by high-resolution imaging of their electrostatic properties.
Electrostatic force microscopy (EFM) and Kelvin probe force microscopy (KPFM) have been used to image the electrostatic surface potential of a large variety of materials with high spatial resolution and sensitivity (Barth et al., 2011; Melitz et al., 2011). There are several different modes of EFM and KPFM. In many applications, a modulated bias voltage (VDC +
VACsin(ωt)) is applied between the tip and sample. This bias generates an attractive
electrostatic force between the tip and the sample, Fel = – (1/2)(∂C/∂z)ΔV2, where ΔV =
(VDC – ΔϕTS) + VAC sin(ωt), which is expressed as the sum of three spectral components
(Glatzel, 2003; Melitz et al., 2011; Nonnenmacher et al., 1991):
(Equation 1)
(Equation 2)
(Equation 3)
where ΔϕTS and ∂C/∂z are the contact potential difference and capacitance gradient,
respectively, between the tip and the sample, and z is normal to the surface. This force is used to induce a vibration in the cantilever at the frequency of the AC bias (ω). In KPFM, a feedback loop is used to adjust VDC such that it compensates for ΔϕTS, thereby nullifying Fω
and generating a potential map of the surface; whereas, in EFM, there is no feedback voltage, and although EFM does not measure surface potential, images of the electrostatic properties of the surface are produced by monitoring the amplitude and/or phase of the induced vibration. Dual-frequency single-pass techniques, where the topography and the surface electrical potential are monitored simultaneously have the highest sensitivity (Barth et al., 2011; Glatzel, 2003; Leung et al., 2010; Thompson et al., 2013). In fact, dual-frequency KPFM has been used to obtain images of DNA (Leung et al., 2010) and
A
uthor Man
uscr
ipt
A
uthor Man
uscr
ipt
A
uthor Man
uscr
ipt
A
uthor Man
uscr
transcription complexes (Mikamo-Satoh et al., 2009); however, no details about the DNA in the transcription complexes were revealed.
Considering the weak electrostatic signals generated by DNA and proteins, we developed a sensitive high-resolution dual-resonance-frequency-enhanced EFM (DREEM) to resolve the DNA within protein-DNA complexes deposited on mica (Figure 1). This dual frequency technique enables simultaneous collection of AFM topographic and DREEM images. DREEM images reveal DNA wrapping around individual nucleosomes and the path of DNA passing through DNA mismatch repair (MMR) proteins. These data yield unprecedented details about DNA conformations within individual protein-DNA complexes.
DESIGN
We adapted and extended the dual-frequency single-pass techniques that take advantage of the resonance properties of the cantilever (Glatzel, 2003; Kikukawa et al., 1996; Leung et al., 2010; Stark et al., 2007; Thompson et al., 2013; Ziegler et al., 2007). To simultaneously obtain topographic and DREEM images, we mechanically vibrate the cantilever near the fundamental resonance (ω1), as is done in standard repulsive intermittent contact mode
topographic imaging, while applying a static and a modulated bias voltage (VDC and VAC,
respectively) to the tip at the first overtone (ω2) to monitor the surface electrical properties
(Figure 1) (Stark et al., 2007). Instead of using the DC bias to nullify Fω as is done in KPFM, we use an AC bias at ω2 to generate a vibration at ω2 and apply the DC bias after
engaging in repulsive mode to optimize the amplitude at ω2 for electrostatic imaging. We
then monitor the vibration amplitude (Aω2) and phase (φω2) as a function of sample position. Because there is no feedback at the first overtone, the DREEM amplitude and phase signals depend on both the strength of the electrostatic force and force gradient,
including the static force gradient ( ) (Supplemental Information) (Cleveland et al., 1998; Rodríguez and García, 2004; Tamayo, 2005; Thompson et al., 2013). In addition, other forces may contribute to the signal at ω2 if they are not canceled by the feedback at the
fundamental frequency (Cleveland et al., 1998; Martínez and García, 2006; Martínez et al., 2008; Rodríguez and García, 2004; Tamayo, 2005; Thompson et al., 2013). Generally, the phase image produces higher contrast due to the nonlinear dependence of the phase on the force gradient and energy dissipation (φω2 depends on the arcsine of the force gradient and the energy dissipation) (Cleveland et al., 1998; Rodríguez and García, 2004; Tamayo, 2005). For example, studies using dual-frequency AFM (with mechanically driven vibration at both frequencies) to image antibodies found that the signal to noise ratio for the phase signal is ~50 times higher than that of the amplitude signal at ω2 (Martínez et al., 2008). Because the
force gradient depends on both the capacitance and the electrostatic potential of the sample, changes in either of these properties will contribute to the observed signals. To maximize resolution in both the AFM topographic and DREEM images, we use highly doped sharp silicon cantilevers and operate in repulsive intermittent contact mode. Operating in repulsive mode keeps the tip at a constant minimal distance from the sample, which in turn maximizes the sensitivity of detection of the electrostatic force gradient. Although highly doped silicon cantilevers are the only available cantilevers that are sufficiently sharp to provide high-resolution images, the variability of the oxidation layers on the silicon cantilevers limits the
A
uthor Man
uscr
ipt
A
uthor Man
uscr
ipt
A
uthor Man
uscr
ipt
A
uthor Man
uscr
possibilities for quantitative comparison of DREEM signals collected using different cantilevers (see Limitations).
Using the first overtone for electrostatic imaging and the fundamental frequency for topographic imaging has several advantages. First, it is preferable to conduct topographic imaging of soft samples with a minimal force to avoid damage, and the effective force constant at ω1 (~80 kHz) is approximately 40 times less than that at ω2 (~500 kHz) [k2 =
k1(ω2/ω1)2] (Kokavecz and Mechler, 2008). Second, ω2 is more sensitive to changes in
force gradient than ω1 because the minimal detectable force gradient is inversely
proportional to the frequency and the Q-factor of the resonance peak, which is higher at ω2
(Q(ω2) ~500) than at ω1 (Q(ω1) ~170) (Hoummady and Farnault, 1998). Third, the
contribution of the electrostatic interaction between the cantilever and the sample to the electrostatic force is minimized at ω2, thereby enhancing spatial resolution in the DREEM
image (Ding et al., 2009). Fourth, higher eigenmodes provide enhanced phase contrast compared to the fundamental mode of tip oscillation for both AFM and EFM imaging (Martínez et al., 2008; Stark et al., 1999; Thompson et al., 2013).
To determine the optimum voltage for obtaining the highest-resolution DREEM amplitude and phase images, we hold the AC bias constant (usually VAC = 10–20 V) and vary the DC
bias between +2.5 V and −2.5 V. The optimum DC bias depends on the tip because the tips can have different extents of oxidation on their surfaces, which affects ΔϕTS (Rezek, 2005).
Operating in repulsive mode using a cantilever with force constant of ~2.8 N/m, the amplitude of vibration at ω2 (Aω2) is ~1 nm, which is 30–50 times smaller than the
mechanical vibration amplitude (Aω1) at the fundamental frequency. This Aω2 is sufficiently large to produce high-quality DREEM images and yet small enough compared to Aω1 that no crosstalk from the DREEM to topographic signals is observed (see below). Aω2 depends not only on the force at ω2, but also on the force gradient, ∂F/∂z (i.e., F′), because F′
changes the effective spring constant of the cantilever and shifts its resonance frequency, which in turn changes Aω2 (Albrecht et al., 1991). Upon engaging in repulsive mode, the force gradient due to repulsive atomic interactions ( ) causes the resonance peak to shift to a higher frequency, significantly reducing Aω2. In our experiments, Aω2 decreased by approximately a factor of two upon repulsive engage. During scanning, and Fa are kept
constant via feedback on the topographic signal at ω1, and therefore, changes in Aω2 [ΔAω2
(x, y)] depend primarily on the electrostatic force and force gradient. For small changes in electrostatic potential and/or capacitance, the frequency shift due to changes in force gradient will dominate ΔAω2 (x, y), with the electrostatic force making only a small contribution (Supplemental Information) (Martin et al., 1987). Notably, monitoring F′ instead of F significantly increases spatial resolution and sensitivity, because F′ has a shorter distance dependence compared to F (Colchero et al., 2001; Giessibl, 1995; Lei et al., 2004; Martin et al., 1987).
RESULTS AND DISCUSSION
We verified the capabilities of DREEM for detecting surface electrical potential by imaging a BaTiO3 thin film, which can maintain a stable polarization state after being polarized by
A
uthor Man
uscr
ipt
A
uthor Man
uscr
ipt
A
uthor Man
uscr
ipt
A
uthor Man
uscr
external electrical field (Choi et al., 2004; Gruverman et al., 2009; Trithaveesak et al., 2005). We generated a pattern of very weak negatively and positively charged areas (~2
electrons/nm2) on a BaTiO3 film (Figure S1A) (Bonnell and Kalinin, 2001) and then imaged
the sample with AFM and DREEM with different DC and AC biases (e.g., Figure S1). The topographic image reveals only a rough surface with a large contaminant particle, with no evidence of the charge pattern. In contrast, both the DREEM-phase and amplitude signals clearly show the charge pattern, which corresponds accurately to the differently charged areas (Figure S1B), but show no evidence of the contaminant particle seen in the
topographic image. These results demonstrate the capability of DREEM for detecting weak surface charges (<2 electrons/nm2), with no significant crosstalk between the topographic and DREEM signals. Furthermore, the observation that the contaminant particle does not produce any signal in either the DREEM-phase or amplitude images suggests that the dominant force acting at ω2 is the electrostatic force.
Visualizing the Path of DNA within Protein-DNA Complexes
To demonstrate the power of DREEM for imaging protein-DNA complexes, we imaged nucleosomes and DNA MMR proteins bound to DNA, as well as free proteins. In the crystal structure of a nucleosomal core particle, 147 base pairs of DNA wrap around the histone octamer 1.67 times (Luger et al., 1997, 2012), whereas in MMR complexes, the DNA passes through DNA mismatch recognition protein MutS (Lamers et al., 2000; Obmolova et al., 2000; Warren et al., 2007), and multiple MutS and MutL proteins can assemble onto DNA containing a mismatch (Elez et al., 2012; Grilley et al., 1989; Hombauer et al., 2011; Kunkel and Erie, 2005; Schofield et al., 2001). The DREEM images of free histones, free MMR proteins, and DNA show a decrease in the phase and an increase in amplitude, relative to the mica surface, with proteins producing greater contrast than DNA (Figures 2, S2, and S3A), as seen in previous EFM studies (Leung et al., 2010; Mikamo-Satoh et al., 2009). The features seen in the DREEM images of free protein mimic those seen in the topographic images (Figures S2A and S3A).
Figure 2 shows AFM topographic and DREEM images of nucleosomes. In the topographic images, the nucleosomes appear as smooth peaks protruding above the DNA, consistent with previous work (Bustamante et al., 1997; Lohr et al., 2007; Lyubchenko, 2014; Swygert et al., 2014; Wang et al., 2002; Yang et al., 1994; Zlatanova and Leuba, 2003; Zlatanova et al., 1994). In contrast, in the DREEM images, the nucleosomes show regions of decreased intensity within the nucleosomal core particle, and these features are reproducible in multiple scans, scans at different angles, and in trace and retrace images (Figure S2B). Furthermore, multiple nucleosomes in individual DREEM images display DNA paths at different orientations (Figure S2). The decreased intensities indicate regions of weaker electrostatic interactions between the tip and sample, which likely results from neutralization of charge and possibly changes in capacitance associated with the interaction between the protein and DNA. Consistent with this suggestion, using these decreased intensities to trace the path of DNA on the histone yields a model in which the DNA wraps around the histone core (compare the models and images in Figure 2) (Luger et al., 1997; 2012). In the crystal structure, the DNA is wrapped around the histone 1.67 times (Luger et al., 1997; 2012), but nucleosomes exist in a dynamic equilibrium of states that have different extents of DNA
A
uthor Man
uscr
ipt
A
uthor Man
uscr
ipt
A
uthor Man
uscr
ipt
A
uthor Man
uscr
wrapping (Luger et al., 2012). Consequently, one or two strands of DNA may be revealed in the DREEM images, depending on both the orientation of the nucleosomes on the surface and the extent of DNA wrapping. In addition, the ability to resolve two DNA strands wrapping around the histone will depend on the sharpness of the AFM tip and the quality of the DREEM signal. In half of the nucleosome images (n = 21 out of 41 nucleosomes), we observe one DNA strand wrapping around histones (Figures 2A, 2B, and S2), and in the other half (n = 20 out of 41 nucleosomes) we can visualize two DNA strands wrapping around the histone core, where cross-section analysis reveals two distinct peaks corresponding to DNA (Figures 2C and S2). The distance between the two peaks
corresponding to two DNA double strands is 4.2 ± 0.8 nm, which is slightly larger than that seen in the crystal structure (~3 nm) (Luger et al., 1997). This difference is likely due to both different conformations of the nucleosomes on the surface and the limit of our resolution. In the images in which two DNA strands are seen, the tip was particularly sharp, as revealed by the width of the DNA in the topographic and DREEM images (e.g., Figure 2C). This result suggests that the spatial resolution of the DREEM images, like that of the topographic images, is limited by the tip size. Notably, it is possible to overlay the crystal structure of the nucleosome onto the DREEM image of the nucleosome showing two strands (Figure 2C). Taken together, these results demonstrate that DREEM can be a powerful method for resolving the path of DNA wrapped around proteins.
To further test the capability of DREEM for visualizing DNA contained within protein complexes, we imaged protein-DNA complexes involved in DNA MMR (Supplemental Experimental Procedures). In MMR, MutS homologs recognize DNA mismatches and subsequently form multimeric complexes with MutL homologs in the presence of ATP (Elez et al., 2012; Grilley et al., 1989; Hombauer et al., 2011; Kunkel and Erie, 2005, 2015; Schofield et al., 2001). MutS homologs are dimers with DNA binding and ATPase domains, and the DNA binding domains encircle and bend the DNA (Figure 3A) (Lamers et al., 2000; Obmolova et al., 2000; Warren et al., 2007). In addition, two MutS dimers can associate to form DNA loops (Allen et al., 1997; Jiang and Marszalek, 2011; Wang et al., 2003). Furthermore, in the presence of ATP, MutS homologs form a mobile clamp after mismatch recognition that can move away from the mismatch, which allows multiple proteins to load onto DNA containing a single mismatch (Cho et al., 2012; Gradia et al., 1999; Kunkel and Erie, 2015; Qiu et al., 2012). Topographic AFM images of T. aquaticus (Taq) MutS bound to a GT mismatch (Figure 3B) and two MutS dimers forming a DNA loop between the
mismatch and a DNA end (Figure 3C) show the typical smooth peaks on the DNA corresponding to Taq MutS (Tessmer et al., 2008; Wang et al., 2003). In contrast, in the DREEM images (Figure 3) the “peaks” corresponding to the position of MutS show regions of decreased intensity, similar to our observations with nucleosomes (Figures 2 and S2). The regions of decreased intensity reveal the path of the DNA through MutS, which is hidden in the topographic AFM images. For example, in Figure 3B, MutS appears to be lying on its side (relative to model in Figure 3A) such that the bend in the DNA is clearly revealed. In this orientation, only a small amount of protein is on top of the DNA, allowing the complete path of the DNA to be visualized. In Figure 3C, the path of the DNA is partially obscured by MutS, which appears to be sitting upright on top of the DNA at the mismatch. As illustrated in the model, the DNA appears to come from underneath the protein (going from top to
A
uthor Man
uscr
ipt
A
uthor Man
uscr
ipt
A
uthor Man
uscr
ipt
A
uthor Man
uscr
bottom of the image) and exit on the top (where the DNA can be clearly visualized exiting the protein), with the DNA bend potentially occurring perpendicular to the surface and hidden by the protein. After exiting the protein at the mismatch, the DNA loops back to interact with the second MutS bound at the end of the DNA. Images of multiple hMutSα proteins loaded onto DNA in the presence of ATP also clearly show the DNA passing through the proteins (Figure S3). Inspection of these and other images (not shown) suggests that the contrast between the DNA and protein in the DREEM images depends on how close the protein-DNA interaction site is to the tip. If the DNA is underneath a large amount of protein, then the electrostatic properties of the protein will likely screen out the effect of the DNA. This observation is similar to that seen with carbon nanotubes embedded in a polymer matrix, in which the contrast of the nanotubes decreases with increasing depth of the nanotubes in the matrix (Thompson et al., 2013). In addition to visualizing the DNA inside the complex, the DREEM data taken together with structural data on MutS (Obmolova et al., 2000) allow us to model the general orientation of the MutS dimers in the complexes (Figures 3B and 3C). The potential power of DREEM is revealed in the image of a large multiprotein complex of human MutSα and MutLα bound to DNA containing a GT mismatch (Figure 3D). In the topographic image, a large protein complex is seen at the end of the DNA. This complex is one of the larger MutSα-MutLα complexes that we observe, and it was chosen to demonstrate the capability of DREEM for resolving DNA in large multiprotein-DNA complexes. A detailed analysis of the properties of MutSα and MutLα complexes is the focus of another manuscript. The volume of this complex is consistent with it containing ~10 proteins (Ratcliff and Erie, 2001). The length of the DNA that is not inside the protein complex is ~120 nm shorter than the expected length for 2 kbp DNA. Inspection of the DREEM amplitude and phase images reveals the path of the DNA in this large complex (Figure 3D). Including the DNA inside the proteins yields a DNA length that is within 5% of the expected length. These results suggest that DREEM may be a powerful tool for examining the path of DNA in large multiprotein-DNA complexes that may not be amenable to characterization by other techniques. In fact, the DNA path is often easier to discern in larger protein-DNA or multiprotein-DNA complexes because the DREEM signal of protein surrounding the DNA provides better contrast relative to DNA on the mica surface.
Limitations
Other than the requirement that the samples must be deposited on a surface to be imaged, which is common to all scanning probe microscopies, the primary limitation of DREEM relates to the use of highly doped silicon cantilevers. Although doped diamond-coated cantilevers (tip radius ~100 nm) and metal-coated cantilevers (tip radius ~30 nm) are typical choices for EFM imaging (Fumagalli et al., 2014), they are not sufficiently sharp to produce high-resolution images. Highly doped silicon cantilevers are sharp (5–8 nm) and sufficiently conductive for high-resolution topographic and DREEM imaging; however, the quality of the DREEM image appears to depend on the oxidation layers on the surface. The oxidation layer on the silicon cantilevers requires that the DC and AC biases be optimized for each cantilever. These differences in oxidation layers prevent quantitative comparison of the magnitudes of the DREEM signals collected with different tips, or the same tip after collecting a series of images. In addition, ~30% of prepared conductive silicon cantilevers
A
uthor Man
uscr
ipt
A
uthor Man
uscr
ipt
A
uthor Man
uscr
ipt
A
uthor Man
uscr
do not generate sufficient contrast between the protein and DNA to allow us to discern paths of DNA in protein-DNA complexes in DREEM images. Argon plasma cleaning of the cantilevers prior to use appears to improve their quality for DREEM imaging. Finally, the quality of the DREEM images degrades during imaging faster than that of the topographic images. Typically, ~10–12 high-quality DREEM images can be obtained from a single AFM tip.
Similar to conventional AFM imaging techniques, DREEM imaging can also experience tip artifacts, due to the asymmetry in the electric field between the AFM tip and sample surface. For example, in some cases, half-moon-like asymmetries, with one side of the DREEM signal consistently stronger than the other side, are seen in the same orientation for all complexes in a single DREEM image. As with tip artifacts in topographic images, these artifacts can be identified by the repetitive features in different molecules from the same image and by scanning at various angles.
A final limitation of DREEM is that it is currently limited to imaging in air. At present, we have not been able to identify operating parameters that allow contrast in aqueous
environment. A few studies demonstrate EFM imaging of solid materials at low ionic strength using lift mode (Gramse et al., 2012; Johnson et al., 2003); however, the resolution and detection limit in these images appears low. It is likely that the electrostatic double layer significantly damps the DREEM signals from proteins and DNA in electrolyte solutions.
Conclusions
In summary, while the paths of DNA are hidden in protein complexes in traditional microscopy imaging techniques, such as AFM and EM imaging, DREEM allows the visualization of the conformation of DNA within individual protein-DNA complexes. In addition to the studies presented here, DREEM also has been employed to visualize DNA conformations within telomere binding proteins (Benarroch-Popivker et al., 2016; P.K., D.W., L. Lin, P. Countryman, K.C.B., D.A.E., R. Riehn, P.L. Opresko, and H.W.,
unpublished data). Taken together, the capability of DREEM to detect very small changes in electrostatic force gradient with high resolution makes it a powerful tool for characterizing the structure of protein-DNA complexes at the single-molecule level. It will be especially useful for characterizing protein-DNA complexes with long length scales and those that result in heterogeneous populations of proteins on the DNA. Furthermore, a growing area in structural biology is the combination of atomic-resolution crystal structures with lower-resolution data from small-angle X-ray scattering, EM, and AFM to generate atomic-level structures of complex assemblies and conformationally flexible proteins (Bustamante et al., 1994; Erie et al., 1994; Griffith, 2013; Griffith and Christiansen, 1978; Hennig and Sattler, 2014; Hura et al., 2013a, 2013b; Janićijević et al., 2003; Lohr et al., 2007; Lyubchenko et al., 2001; Moreno-Herrero et al., 2005; Sanchez et al., 2013; Trinh et al., 2012; Villarreal and Stewart, 2014; Wanner and Schroeder-Reiter, 2008; Williams et al., 2014; Yang et al., 2003; Yeh et al., 2012). DREEM has the capability to significantly increase the constraints on the possible orientations of proteins in multiprotein assemblies on DNA, as demonstrated by our ability to dock the crystal structure of the nucleosome into a subset of the images. In addition, DREEM allows the path of DNA to be resolved in large heterogeneous
multi-A
uthor Man
uscr
ipt
A
uthor Man
uscr
ipt
A
uthor Man
uscr
ipt
A
uthor Man
uscr
protein-DNA complexes. It also will be applicable for characterizing the electrostatic properties of other biological specimens, such as viruses and membranes, as well as non-biological samples. With sharper tips and further refinement of the technique, it is highly likely that the resolution can be further increased in the future. Finally, with the addition of only two components (a function generator and a lock-in amplifier, Figure 1), DREEM can be implemented on many of the commercially available AFMs, making it readily available to many labs.
EXPERIMENTAL PROCEDURES
Instrument Design
Our experimental setup for simultaneous AFM and DREEM is described in Figure 1. In our setup, we apply an AC bias at the first overtone (ω2) and monitor the vibration amplitude
(Aω2) and phase (φω2) as a function of position, while simultaneously collecting the topographic image at the fundamental frequency (ω1).
The detailed methods for conductive cantilever preparation, substrate grounding, selection of imaging conditions, sample preparation, deposition, and analysis are described in the Supplemental Experimental Procedures.
Supplementary Material
Refer to Web version on PubMed Central for supplementary material.
ACKNOWLEDGMENTS
We would like to thank James Jorgenson for the use of the lock-in amplifier, Peggy Hsieh for providing human MutSα and MutLα proteins, and Elizabeth Sacho and Keith Weninger for helpful discussions and critical reading of the manuscript. This work was supported by National Institutes of Health grant R01 GM079480 (D.A.E.), R00 ES016758 (H.W.), R01 GM107559 (H.W.), P30ES025128 (H.W.), and NCSU start-up fund (H.W.). D.A.E. and D.W. have a patent pending on the DREEM technique.
REFERENCES
Albrecht TR, Grütter P, Horne D, Rugar D. Frequency modulation detection using high-Q cantilevers for enhanced force microscope sensitivity. J. Appl. Physiol. 1991; 69:668–673.
Allen DJ, Makhov A, Grilley M, Taylor J, Thresher R, Modrich P, Griffith JD. MutS mediates heteroduplex loop formation by a translocation mechanism. EMBO J. 1997; 16:4467–4476. [PubMed: 9250691]
Barth C, Foster AS, Henry CR, Shluger AL. Recent trends in surface characterization and chemistry with high-resolution scanning force methods. Adv. Mater. 2011; 23:477–501. [PubMed: 21254251] Bazett-Jones DP, Mendez E, Czarnota GJ, Ottensmeyer FP, Allfrey VG. Visualization and analysis of
unfolded nucleosomes associated with transcribing chromatin. Nucleic Acids Res. 1996; 24:321– 329. [PubMed: 8628657]
Benarroch-Popivker D, Pisano S, Mendez-Bermudez A, Lototska L, Kaur P, Bauwens S, Djerbi N, Latrick CM, Fraisier V, Pei B, et al. TRF2-Mediated Control of Telomere DNA Topology as a Mechanism for Chromosome Chromosome-End Protection as a Mechanism for Chromosome Chromosome-End Protection. Mol Cell. 2016; 61 this issue.
Bonnell DA, Kalinin SV. Local Polarization, Charge Compensation, and Chemical Interactions on Ferroelectric Surfaces: a Route Toward New Nanostructures. MRS Proceedings. 2001; 688
A
uthor Man
uscr
ipt
A
uthor Man
uscr
ipt
A
uthor Man
uscr
ipt
A
uthor Man
uscr
Brown A, Amunts A, Bai XC, Sugimoto Y, Edwards PC, Murshudov G, Scheres SH, Ramakrishnan V. Structure of the large ribosomal subunit from human mitochondria. Science. 2014; 346:718–722. [PubMed: 25278503]
Bustamante C, Erie DA, Keller D. Biochemical and structural applications of scanning force microscopy. Curr. Opin. Struct. Biol. 1994; 4:750–760.
Bustamante C, Zuccheri G, Leuba SH, Yang G, Samori B. Visualization and analysis of chromatin by scanning force microscopy. Methods. 1997; 12:73–83. [PubMed: 9169197]
Cho W-K, Jeong C, Kim D, Chang M, Song K-M, Hanne J, Ban C, Fishel R, Lee J-B. ATP alters the diffusion mechanics of MutS on mismatched DNA. Structure. 2012; 20:1264–1274. [PubMed: 22682745]
Choi KJ, Biegalski M, Li YL, Sharan A, Schubert J, Uecker R, Reiche P, Chen YB, Pan XQ, Gopalan V, et al. Enhancement of ferroelectricity in strained BaTiO3 thin films. Science. 2004; 306:1005– 1009. [PubMed: 15528439]
Cleveland J, Anczykowski B, Schmid A, Elings V. Energy dissipation in tapping-mode atomic force microscopy. Appl. Phys. Lett. 1998; 72:2613.
Colchero J, Gil A, Baró A. Resolution enhancement and improved data interpretation in electrostatic force microscopy. Phys. Rev. B. 2001; 64:245403.
Ding XD, An J, Xu JB, Li C, Zeng RY. Improving lateral resolution of electrostatic force microscopy by multifrequency method under ambient conditions. Appl. Phys. Lett. 2009; 94:223109. Elez M, Radman M, Matic I. Stoichiometry of MutS and MutL at unrepaired mismatches in vivo
suggests a mechanism of repair. Nucleic Acids Res. 2012; 40:3929–3938. [PubMed: 22241777] Erie DA, Yang G, Schultz HC, Bustamante C. DNA bending by Cro protein in specific and nonspecific
complexes: implications for protein site recognition and specificity. Science. 1994; 266:1562– 1566. [PubMed: 7985026]
Fernández IS, Bai XC, Hussain T, Kelley AC, Lorsch JR, Ramakrishnan V, Scheres SH. Molecular architecture of a eukaryotic translational initiation complex. Science. 2013; 342:1240585. [PubMed: 24200810]
Fumagalli L, Edwards MA, Gomila G. Quantitative electrostatic force microscopy with sharp silicon tips. Nanotechnology. 2014; 25:495701. [PubMed: 25407683]
Giessibl FJ. Atomic resolution of the silicon (111)-(7x7) surface by atomic force microscopy. Science. 1995; 267:68–71. [PubMed: 17840059]
Glatzel T. Amplitude or frequency modulation-detection in Kelvin probe force microscopy. Appl. Surf. Sci. 2003; 210:84–89.
Gradia S, Subramanian D, Wilson T, Acharya S, Makhov A, Griffith J, Fishel R. hMSH2-hMSH6 forms a hydrolysis-independent sliding clamp on mismatched DNA. Mol. Cell. 1999; 3:255–261. [PubMed: 10078208]
Gramse G, Gomila G, Fumagalli L. Quantifying the dielectric constant of thick insulators by electrostatic force microscopy: effects of the microscopic parts of the probe. Nanotechnology. 2012; 23:205703. [PubMed: 22543516]
Griffith JD. Many ways to loop DNA. J. Biol. Chem. 2013; 288:29724–29735. [PubMed: 24005675] Griffith JD, Christiansen G. Electron microscope visualization of chromatin and other DNA-protein
complexes. Annu. Rev. Biophys. Bioeng. 1978; 7:19–35. [PubMed: 78683]
Grilley M, Welsh KM, Su SS, Modrich P. Isolation and characterization of the Escherichia coli mutL gene product. J. Biol. Chem. 1989; 264:1000–1004. [PubMed: 2536011]
Groothuizen FS, Fish A, Petoukhov MV, Reumer A, Manelyte L, Winterwerp HH, Marinus MG, Lebbink JH, Svergun DI, Friedhoff P, Sixma TK. Using stable MutS dimers and tetramers to quantita tively analyze DNA mismatch recognition and sliding clamp formation. Nucleic Acids Res. 2013; 41:8166–8181. [PubMed: 23821665]
Gruverman A, Wu D, Lu H, Wang Y, Jang HW, Folkman CM, Zhuravlev MY, Felker D, Rzchowski M, Eom CB, Tsymbal EY. Tunneling electroresistance effect in ferroelectric tunnel junctions at the nanoscale. Nano Lett. 2009; 9:3539–3543. [PubMed: 19697939]
He Y, Fang J, Taatjes DJ, Nogales E. Structural visualization of key steps in human transcription initiation. Nature. 2013; 495:481–486. [PubMed: 23446344]
A
uthor Man
uscr
ipt
A
uthor Man
uscr
ipt
A
uthor Man
uscr
ipt
A
uthor Man
uscr
Hennig J, Sattler M. The dynamic duo: combining NMR and small angle scattering in structural biology. Protein Sci. 2014; 23:669–682. [PubMed: 24687405]
Hombauer H, Campbell CS, Smith CE, Desai A, Kolodner RD. Visualization of eukaryotic DNA mismatch repair reveals distinct recognition and repair intermediates. Cell. 2011; 147:1040–1053. [PubMed: 22118461]
Hoummady M, Farnault E. Enhanced sensitivity to force gradients by using higher flexural modes of the atomic force microscope cantilever. Applied Physics A: Materials Science & Processing. 1998; 66:361–364.
Hura GL, Budworth H, Dyer KN, Rambo RP, Hammel M, McMurray CT, Tainer JA. Comprehensive macromolecular conformations mapped by quantitative SAXS analyses. Nat. Methods. 2013a; 10:453–454. [PubMed: 23624664]
Hura GL, Tsai CL, Claridge SA, Mendillo ML, Smith JM, Williams GJ, Mastroianni AJ, Alivisatos AP, Putnam CD, Kolodner RD, Tainer JA. DNA conformations in mismatch repair probed in solution by X-ray scattering from gold nanocrystals. Proc. Natl. Acad. Sci. USA. 2013b; 110:17308–17313. [PubMed: 24101514]
Janićijević A, Ristic D, Wyman C. The molecular machines of DNA repair: scanning force microscopy analysis of their architecture. J. Microsc. 2003; 212:264–272. [PubMed: 14629552]
Jiang Y, Marszalek PE. Atomic force microscopy captures MutS tetramers initiating DNA mismatch repair. EMBO J. 2011; 30:2881–2893. [PubMed: 21666597]
Johnson AS, Nehl CL, Mason MG, Hafner JH. Fluid Electric Force Microscopy for Charge Density Mapping in Biological Systems. Langmuir. 2003; 19:10007–10010.
Kikukawa A, Hosaka S, Imura R. Vacuum compatible high-sensitive Kelvin probe force microscopy. Rev. Sci. Instrum. 1996; 67:1463–1467.
Kokavecz J, Mechler A. Spring constant of microcantilevers in fundamental and higher eigenmodes. Phys. Rev. B. 2008; 78:172101.
Kunkel TA, Erie DA. DNA mismatch repair. Annu. Rev. Biochem. 2005; 74:681–710. [PubMed: 15952900]
Kunkel TA, Erie DA. Eukaryotic Mismatch Repair in Relation to DNA Replication. Annu. Rev. Genet. 2015; 49:291–313. [PubMed: 26436461]
Lamers MH, Perrakis A, Enzlin JH, Winterwerp HH, de Wind N, Sixma TK. The crystal structure of DNA mismatch repair protein MutS binding to a G × T mismatch. Nature. 2000; 407:711–717. [PubMed: 11048711]
Lei C, Das A, Elliott M, Macdonald JE. Quantitative electro-static force microscopy-phase measurements. Nanotechnology. 2004; 15:627.
Leung C, Maradan D, Kramer A, Howorka S, Mesquida P, Hoogenboom BW. Improved Kelvin probe force microscopy for imaging individual DNA molecules on insulating surfaces. Appl. Phys. Lett. 2010; 97:203703.
Lohr D, Bash R, Wang H, Yodh J, Lindsay S. Using atomic force microscopy to study chromatin structure and nucleosome remodeling. Methods. 2007; 41:333–341. [PubMed: 17309844] Luger K, Mäder AW, Richmond RK, Sargent DF, Richmond TJ. Crystal structure of the nucleosome
core particle at 2.8 A resolution. Nature. 1997; 389:251–260. [PubMed: 9305837]
Luger K, Dechassa ML, Tremethick DJ. New insights into nucleosome and chromatin structure: an ordered state or a disordered affair? Nat. Rev. Mol. Cell Biol. 2012; 13:436–447. [PubMed: 22722606]
Luijsterburg MS, von Bornstaedt G, Gourdin AM, Politi AZ, Moné MJ, Warmerdam DO, Goedhart J, Vermeulen W, van Driel R, Höfer T. Stochastic and reversible assembly of a multiprotein DNA repair complex ensures accurate target site recognition and efficient repair. J. Cell Biol. 2010; 189:445–463. [PubMed: 20439997]
Lyubchenko YL. Nanoscale Nucleosome Dynamics Assessed with Time-lapse AFM. Biophys. Rev. 2014; 6:181–190. [PubMed: 24839467]
Lyubchenko YL, Gall AA, Shlyakhtenko LS. Atomic force microscopy of DNA and protein-DNA complexes using functionalized mica substrates. Methods Mol. Biol. 2001; 148:569–578. [PubMed: 11357614]
A
uthor Man
uscr
ipt
A
uthor Man
uscr
ipt
A
uthor Man
uscr
ipt
A
uthor Man
uscr
Maletta M, Orlov I, Roblin P, Beck Y, Moras D, Billas IM, Klaholz BP. The palindromic DNA-bound USP/EcR nuclear receptor adopts an asymmetric organization with allosteric domain positioning. Nat. Commun. 2014; 5:4139. [PubMed: 24942373]
Martin Y, Williams CC, Wickramasinghe HK. Atomic force microscope–force mapping and profiling on a sub 100-Å scale. J. Appl. Physiol. 1987; 61:4723–4729.
Martínez NF, García R. Measuring phase shifts and energy dissipation with amplitude modulation atomic force microscopy. Nanotechnology. 2006; 17:S167–S172. [PubMed: 21727409] Martínez NF, Lozano JR, Herruzo ET, Garcia F, Richter C, Sulzbach T, Garcia R. Bimodal atomic
force microscopy imaging of isolated antibodies in air and liquids. Nanotechnology. 2008; 19:384011. [PubMed: 21832570]
Melitz W, Shen J, Kummel AC, Lee S. Kelvin probe force microscopy and its application. Surf. Sci. Rep. 2011; 66:1–27.
Mendillo ML, Putnam CD, Kolodner RD. Escherichia coli MutS tetramerization domain structure reveals that stable dimers but not tetramers are essential for DNA mismatch repair in vivo. J. Biol. Chem. 2007; 282:16345–16354. [PubMed: 17426027]
Mikamo-Satoh E, Yamada F, Takagi A, Matsumoto T, Kawai T. Electrostatic force microscopy: imaging DNA and protein polarizations one by one. Nanotechnology. 2009; 20:145102. [PubMed: 19420517]
Miyata T, Suzuki H, Oyama T, Mayanagi K, Ishino Y, Morikawa K. Open clamp structure in the clamp-loading complex visualized by electron microscopic image analysis. Proc. Natl. Acad. Sci. USA. 2005; 102:13795–13800. [PubMed: 16169902]
Moreno-Herrero F, de Jager M, Dekker NH, Kanaar R, Wyman C, Dekker C. Mesoscale conformational changes in the DNA-repair complex Rad50/Mre11/Nbs1 upon binding DNA. Nature. 2005; 437:440–443. [PubMed: 16163361]
Nonnenmacher M, O'Boyle MP, Wickramasinghe HK. Kelvin probe force microscopy. Appl. Phys. Lett. 1991; 58:2921.
Obmolova G, Ban C, Hsieh P, Yang W. Crystal structures of mismatch repair protein MutS and its complex with a substrate DNA. Nature. 2000; 407:703–710. [PubMed: 11048710]
Orlova EV, Saibil HR. Methods for three-dimensional reconstruction of heterogeneous assemblies. Methods Enzymol. 2010; 482:321–341. [PubMed: 20888967]
Qiu R, DeRocco VC, Harris C, Sharma A, Hingorani MM, Erie DA, Weninger KR. Large conformational changes in MutS during DNA scanning, mismatch recognition and repair signalling. EMBO J. 2012; 31:2528–2540. [PubMed: 22505031]
Ratcliff GC, Erie DA. A novel single-molecule study to determine protein–protein association constants. J. Am. Chem. Soc. 2001; 123:5632–5635. [PubMed: 11403593]
Rezek B. Atomic and Kelvin force microscopy applied on hydrogenated diamond surfaces. New Diam Front C Tech. 2005; 15:275–295.
Rodríguez TR, García R. Compositional mapping of surfaces in atomic force microscopy by excitation of the second normal mode of the microcantilever. Appl. Phys. Lett. 2004; 84:449.
Sanchez H, Kertokalio A, van Rossum-Fikkert S, Kanaar R, Wyman C. Combined optical and topographic imaging reveals different arrangements of human RAD54 with presynaptic and postsynaptic RAD51-DNA filaments. Proc. Natl. Acad. Sci. USA. 2013; 110:11385–11390. [PubMed: 23801766]
Schofield MJ, Nayak S, Scott TH, Du C, Hsieh P. Interaction of Escherichia coli MutS and MutL at a DNA mismatch. J. Biol. Chem. 2001; 276:28291–28299. [PubMed: 11371566]
Stark RW, Drobek T, Heckl WM. Tapping-mode atomic force microscopy and phase-imaging in higher eigenmodes. Appl. Phys. Lett. 1999; 74:3296–3298.
Stark RW, Naujoks N, Stemmer A. Multifrequency electrostatic force microscopy in the repulsive regime. Nanotechnology. 2007; 18:065502.
Swygert SG, Manning BJ, Senapati S, Kaur P, Lindsay S, Demeler B, Peterson CL. Solution-state conformation and stoichiometry of yeast Sir3 heterochromatin fibres. Nat. Commun. 2014; 5:4751. [PubMed: 25163529]
Tamayo J. Study of the noise of micromechanical oscillators under quality factor enhancement via driving force control. J. Appl. Physiol. 2005; 97:044903.
A
uthor Man
uscr
ipt
A
uthor Man
uscr
ipt
A
uthor Man
uscr
ipt
A
uthor Man
uscr
Tessmer I, Yang Y, Zhai J, Du C, Hsieh P, Hingorani MM, Erie DA. Mechanism of MutS searching for DNA mismatches and signaling repair. J. Biol. Chem. 2008; 283:36646–36654. [PubMed: 18854319]
Thompson HT, Barroso-Bujans F, Herrero JG, Reifenberger R, Raman A. Subsurface imaging of carbon nanotube networks in polymers with DC-biased multifrequency dynamic atomic force microscopy. Nanotechnology. 2013; 24:135701. [PubMed: 23478331]
Trinh MH, Odorico M, Pique ME, Teulon JM, Roberts VA, Ten Eyck LF, Getzoff ED, Parot P, Chen SW, Pellequer JL. Computational reconstruction of multidomain proteins using atomic force microscopy data. Structure. 2012; 20:113–120. [PubMed: 22244760]
Trithaveesak O, Schubert J, Buchal C. Ferroelectric properties of epitaxial BaTiO3 thin films and heterostructures on different substrates. J. Appl. Physiol. 2005; 98:114101.
Villarreal SA, Stewart PL. CryoEM and image sorting for flexible protein/DNA complexes. J. Struct. Biol. 2014; 187:76–83. [PubMed: 24333094]
Wang H, Bash R, Yodh JG, Hager GL, Lohr D, Lindsay SM. Glutaraldehyde modified mica: a new surface for atomic force microscopy of chromatin. Biophys. J. 2002; 83:3619–3625. [PubMed: 12496129]
Wang H, Yang Y, Schofield MJ, Du C, Fridman Y, Lee SD, Larson ED, Drummond JT, Alani E, Hsieh P, Erie DA. DNA bending and unbending by MutS govern mismatch recognition and specificity. Proc. Natl. Acad. Sci. USA. 2003; 100:14822–14827. [PubMed: 14634210]
Wanner G, Schroeder-Reiter E. Scanning electron microscopy of chromosomes. Methods Cell Biol. 2008; 88:451–474. [PubMed: 18617047]
Warren JJ, Pohlhaus TJ, Changela A, Iyer RR, Modrich PL, Beese LS. Structure of the human MutSalpha DNA lesion recognition complex. Mol. Cell. 2007; 26:579–592. [PubMed: 17531815] Williams GJ, Hammel M, Radhakrishnan SK, Ramsden D, Lees-Miller SP, Tainer JA. Structural
insights into NHEJ: building up an integrated picture of the dynamic DSB repair super complex, one component and interaction at a time. DNA Repair (Amst.). 2014; 17:110–120. [PubMed: 24656613]
Yang G, Leuba SH, Bustamante C, Zlatanova J, van Holde K. Role of linker histones in extended chromatin fibre structure. Nat. Struct. Biol. 1994; 1:761–763. [PubMed: 7634084]
Yang Y, Wang H, Erie DA. Quantitative characterization of bio-molecular assemblies and interactions using atomic force microscopy. Methods. 2003; 29:175–187. [PubMed: 12606223]
Yeh JI, Levine AS, Du S, Chinte U, Ghodke H, Wang H, Shi H, Hsieh CL, Conway JF, Van Houten B, Rapić-Otrin V. Damaged DNA induced UV-damaged DNA-binding protein (UV-DDB)
dimerization and its roles in chromatinized DNA repair. Proc. Natl. Acad. Sci. USA. 2012; 109:E2737–E2746. [PubMed: 22822215]
Ziegler D, Rychen J, Naujoks N, Stemmer A. Compensating electrostatic forces by single-scan Kelvin probe force microscopy. Nanotechnology. 2007; 18:225505.
Zlatanova J, Leuba SH. Chromatin fibers, one-at-a-time. J. Mol. Biol. 2003; 331:1–19. [PubMed: 12875831]
Zlatanova J, Leuba SH, Yang G, Bustamante C, van Holde K. Linker DNA accessibility in chromatin fibers of different conformations: a reevaluation. Proc. Natl. Acad. Sci. USA. 1994; 91:5277–5280. [PubMed: 8202481]
A
uthor Man
uscr
ipt
A
uthor Man
uscr
ipt
A
uthor Man
uscr
ipt
A
uthor Man
uscr
Highlights
• Dual-frequency atomic and electrostatic force microscopy of protein-DNA complexes
• Imaging the topographic and electrostatic features of protein-DNA complexes
• Visualizing DNA in nucleosomes and mismatch repair complexes via their electrostatics
A
uthor Man
uscr
ipt
A
uthor Man
uscr
ipt
A
uthor Man
uscr
ipt
A
uthor Man
uscr
In Brief
Wu et al. developed a dual resonance frequency imaging method that simultaneously captures atomic force microscopy topographic and electrostatic force gradient images. This method reveals DNA wrapping around histones and the path of DNA as it passes through both single-protein and multiprotein mismatch repair complexes.
A
uthor Man
uscr
ipt
A
uthor Man
uscr
ipt
A
uthor Man
uscr
ipt
A
uthor Man
uscr
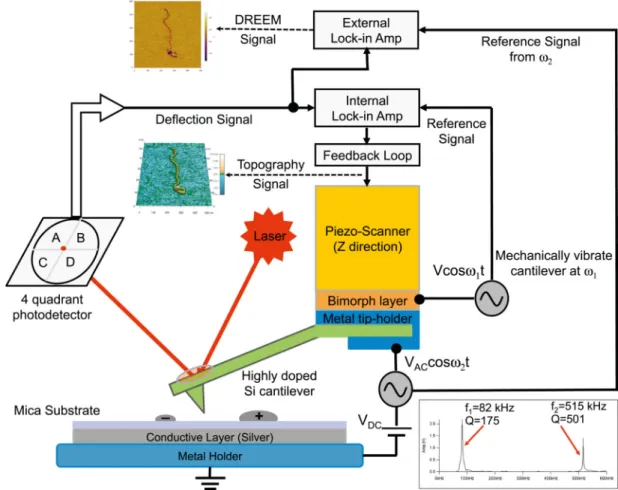
Figure 1. Instrumental Design for Simultaneous AFM and DREEM Imaging
The AFM (MFP-3D, Asylum Research) is operated in repulsive oscillating (intermittent contact) mode with the cantilever mechanically vibrated near its resonance frequency (ω1 =
2π f1) (f1 = ~80 kHz for the cantilever used in this study) to collect the topographic
information. To simultaneously collect the DREEM image, AC and DC biases are applied to a highly doped silicon cantilever (Nanosensors, PPP-FMR, force constant ~2.8 N/m), with the frequency of the AC bias centered on cantilever's first overtone (ω2 = 2πf2) (f2 ~500
kHz). An external lock-in amplifier is used to separate the ω2 component from the output
signal and compare it with the reference input AC signal to generate the electrostatic amplitude and phase signals. The DC bias is maintained constant and is used to adjust the electrical vibration amplitude to produce optimal contrast in the DREEM images. In the current setup, the AC and DC biases can be adjusted from 0 V to 20 V and −2.5 V to 2.5 V, respectively. The inset shows the thermal motion of a typical cantilever used in our
experiments as a function of the frequency. The frequencies and Q factors for the fundamental (f1, Q1) and first overtone (f2, Q2) frequencies are shown by each peak.
A
uthor Man
uscr
ipt
A
uthor Man
uscr
ipt
A
uthor Man
uscr
ipt
A
uthor Man
uscr
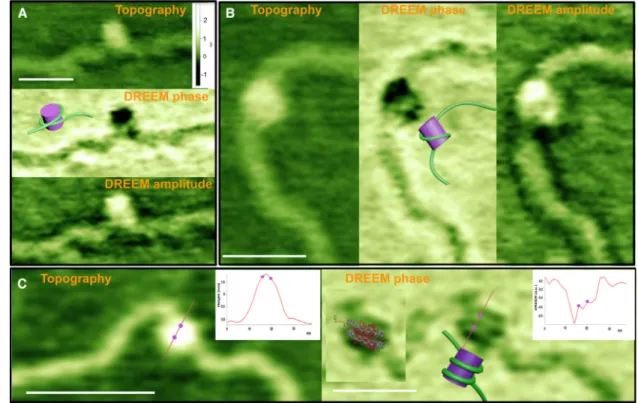
Figure 2. Representative Topographic AFM and DREEM Images of Nucleosomes
(A and B) Topographic (A top, B left), DREEM-phase (A middle, B center), and DREEM amplitude (A bottom, B right) images of nucleosomes showing one DNA wrapping around histones one time.
(C) Topographic (left) and DREEM-phase (right) images of a nucleosome showing DNA wrapping around nucleosomes twice. Insets show graphs of the height cross-section for the line drawn across the nucleosome in topographic (left) and DREEM-phase (right) images. The two dots on the graph correspond to the positions of the two dots shown on the line across the image, which mark the position of the peaks corresponding to the DNA in the DREEM image. The distance between the two peaks corresponding to the two DNA double strands (dots on graph) is 3.4 nm, which is similar to that seen in the crystal structure (~3 nm) (Luger et al., 1997). Cartoon models of the DNA wrapping around histones are shown on each DREEM-phase image (models are not to scale). The crystal structure of a
nucleosome (Luger et al., 1997) overlaid on the DREEM-phase image is shown in the inset of the phase image in (C). The white scale bars are 50 nm. All topographic images are scaled to the same height, and the height scale bar is shown in (A). Both the topographic and DREEM-phase images in (C) are sharper than those in (A) and (B) as a result of a sharper AFM tip. All features in the images are seen in both the trace and retrace scans (Figure S2B). Nucleosomes were reconstituted on a 2,743 bp linear fragment containing 147 bp 601 nucleosome positioning sequence. Unlike the images of nucleosomes, DREEM images of free histones show only smooth “hemispherical shape,” similar to the topographic images (Figure S2A). See also Figure S2.
A
uthor Man
uscr
ipt
A
uthor Man
uscr
ipt
A
uthor Man
uscr
ipt
A
uthor Man
uscr
Figure 3. Topographic AFM and DREEM Images of Mismatch Repair Complexes on 2 kbp DNA Containing a GT Mismatch
(A) Space-filling model of the crystal structure of Taq MutS (generated from PDB: 1EWQ). Subunits A and B and the DNA are colored blue, gold, and cyan, respectively. MutS bends the DNA by ~60° as it passes through the DNA binding channel.
(B) AFM topographic (left) and DREEM-phase (center) and amplitude (right) images of a Taq MutS-DNA mismatch complex. Model of the complex is shown overlaid onto the AFM images and next to the phase images.
(C) AFM topographic (left) and DREEM-phase (right) images of two MutS dimers forming a loop in the DNA between the location of the mismatch (375 bp from one end) and DNA end. Model of the complex is shown overlaid onto the AFM images and next to the phase images. The model is based on the volume of the complex in the topographic image (consistent with two dimers), the location of the DNA in the DREEM image, as well as the crystal structure and the location of the tetramerization (two MutS dimers) interface (Groothuizen et al., 2013; Mendillo et al., 2007). A topographic surface plot of this image is shown in Figure 1.
(D) AFM topographic (left: surface plot) and DREEM-phase (middle: surface plot; right: top view) images of a large MutSα-MutLα-DNA complex containing ~10 proteins. The path of the DNA is identified as the regions with highest reduction of the magnitude of DREEM signals compared to protein alone and traced in the inset in blue. Interestingly, the DNA appears to be sharply bent after entering the complex at the expected position of the mismatch (MM). Z-scale bars are in nanometers for AFM images and arbitrary units for the DREEM images. See also Figure S3.