MULTIDEMENSIONALITY OF CAREGIVER BURDEN IN PARENTS OF CHILDREN WITH AUTISM SPECTRUM DISORDER
Kathryn Miller, MSW
A dissertation submitted to the faculty of the University of North Carolina at Chapel Hill in partial fulfillment of the requirements for the degree of Doctor of Philosophy in the School of
Education department of School Psychology
Chapel Hill 2020
Approved by: Sandra Evarrs
Jessica Dykstra Steinbrenner Rune J. Simeonsson
ABSTRACT
Kathryn Miller: Multidimensionality of Caregiver Burden in Parents of Children with Autism Spectrum Disorder
(Under the direction of Jessica Dykstra Steinbrenner and Sandra Evarrs)
ACKNOWLEDGEMENTS
I would like to acknowledge everyone who has played critical roles in my academic achievements and milestones. First, I’d like to thank my research advisor, Dr. Jessica Dykstra Steinbrenner, for her guidance and support on this project, and my dissertation chair, Dr. Sandra Evarrs, for always believing in me. I would also like to thank the members of my committee: Dr. Steve Knotek, Dr. Rune Simeonsson, and Dr. Christina Christopoulos, for agreeing to serve on my committee and for helping to guide my graduate studies as well as providing me feedback and continued support throughout the dissertation journey. In addition, I was fortunate to have individualized support at the Odum Institute for Research in Social Science, specifically, Nuvan Rathnayaka, who provided me with invaluable guidance that made statistical analyses and interpretation for this dissertation possible.
I would also like to take a moment to thank my loved ones and close friends. My
ACKNOWLEDGEMENT OF SOURCE
TABLE OF CONTENTS
LIST OF TABLES ... XII LIST OF FIGURES ... XIII LIST OF ABBREVIATIONS ... XIV
CHAPTER I: INTRODUCTION ... 1
CHAPTER II: REVIEW OF LITERATURE ... 5
Core Features of ASD ... 6
Caregiver Burden ... 9
Theoretical framework. ... 10
ABCX Formula. ... 10
Stress process model. ... 11
Caregiver Burden in Parents of Adolescents with ASD ... 14
Outcomes for young adults with ASD. ... 15
Child factors related to caregiver burden. ... 18
Age. ... 18
Gender. ... 19
Adaptive functioning ... 19
Cognitive abilities. ... 20
Academic performance. ... 21
Grade level. ... 22
Co-morbidities ... 22
ASD symptom severity. ... 23
Family characteristics related to caregiver burden. ... 24
Respondent’s relationship to child with ASD. ... 24
Respondent’s educational attainment ... 24
Household income. ... 25
Respondent’s race and ethnicity. ... 26
Family empowerment ... 26
Convergence of Findings ... 28
Rationale of Factors ... 30
RESEARCH RATIONALE ... 31
Limitations of Previous Research ... 31
Conclusions ... 32
Purpose of Current Study ... 32
Research Questions and Hypotheses ... 33
Research Question 1. ... 33
Hypotheses associated with research question 1. ... 33
Research Question 2. ... 34
Hypotheses associated with research question 2. ... 34
Research Question 3. ... 34
Hypotheses associated with research question 3. ... 34
Procedure ... 36
Inclusion/Exclusion Criteria ... 37
Ethical Considerations ... 37
Participants ... 37
Measures ... 39
Child and family demographic form. ... 39
The Vineland Adaptive Behavior Scales, Second Edition. ... 40
Social Responsiveness Scale, Second Edition ... 41
Woodcock-Johnson, Third Edition - Tests of Achievement ... 43
Family Empowerment Scale. ... 45
Zarit Burden Interview ... 47
Analytic Strategy ... 53
Data screening. ... 53
Research question 1 analysis. ... 53
Research question 2 analysis. ... 54
Research question 3 analysis. ... 55
CHAPTER IV: RESULTS ... 57
Introduction ... 57
Preliminary Analysis ... 57
Research question 1. ... 60
Research question 2. ... 63
Research question 3. ... 66
Predictors of Caregiver Burden ... 75
Child characteristics. ... 75
Family characteristics. ... 78
Family empowerment as a mediator of caregiver burden. ... 80
Family empowerment as a moderator of caregiver burden. ... 81
Limitations ... 81
Future Research ... 85
Conclusions ... 86
APPENDIX 1: SUMMARY OF STUDIES ON CAREGIVER BURDEN IN PARENTS OF CHILDREN WITH ASD ... 88
APPENDIX 2: CHILD AND FAMILY DEMOGRAPHIC FORM ... 93
APPENDIX 3: ADAPTED ZBI ... 98
LIST OF TABLES
Table 1. Participant Demographic Characteristics by Study ... 18
Table 2. Inconsistencies of Findings from Previous Studies ... 30
Table 3. Variables and Measures ... 50
Table 4. Descriptive Statistics of Variables ... 57
Table 5. Rules for Interpreting Bivariate Pearson r Values ... 59
Table 6. Bivariate Pearson Correlation Matrix of Caregiver Burden and Child Characteristics ... 61
Table 7. Multiple Regression Analysis of Child Characteristics and Caregiver Burden ... 63
Table 8. Bivariate Pearson Correlation Matrix of Caregiver Burden and Background/Context Variables ... 64
Table 9. Tukey’s Post Hoc Multiple Comparisons for Respondent’s Relationship to Child ... 65
Table 10. Multiple Regression Analysis of Family Characteristics and Caregiver Burden ... 66
Table 11. Correlations Among Predictor and Dependent Variables ... 67
LIST OF FIGURES
Figure 1. McCubbin & Patterson’s Double ABCX Model. ... 11
Figure 2. Pearlin et al.’s (1990) conceptual model of caregiver’s stress relate to caring for an individual with Alzheimer’s disease. ... 13
Figure 3. An adapted conceptual model of Pearlin’s stress process model and the predicted relationships for this study (Pearlin et al., 1990). ... 14
Figure 4. Predicted Relationships Between Caregiver Burden and Child/Family Characteristics ... 33
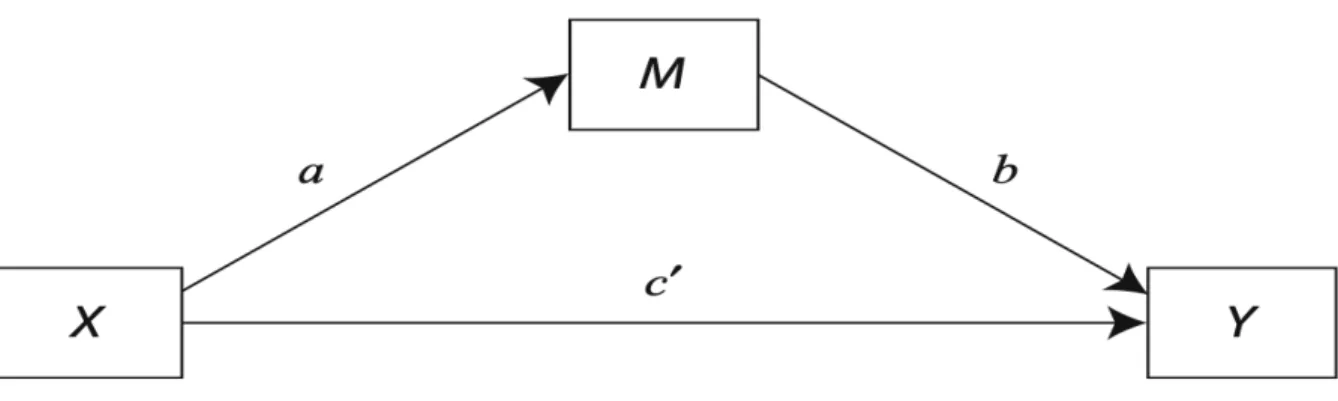
Figure 5. Generic mediation model being tested (based on Preacher & Hayes, 2008). ... 56
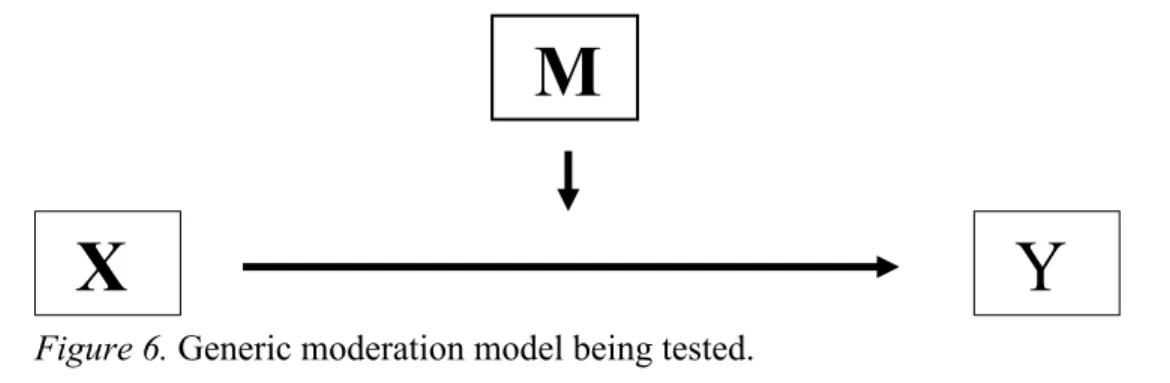
Figure 6. Generic moderation model being tested. ... 69
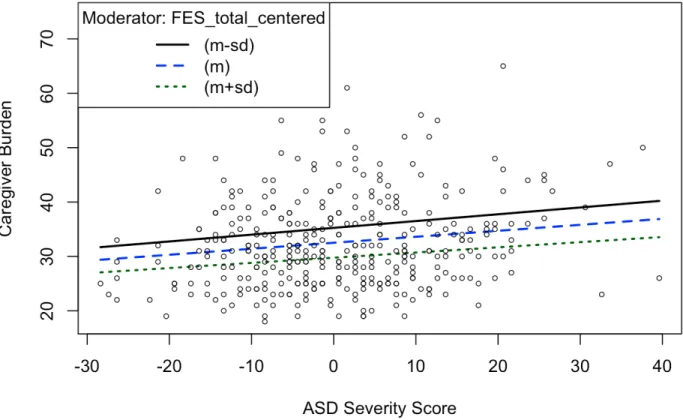
Figure 7. Plot of the interaction of family empowerment and ASD symptom severity. ... 71
Figure 8. Plot of the interaction of family empowerment and the presence of comorbidities in addition to an ASD diagnosis. ... 72
LIST OF ABBREVIATIONS
ABAS-II Adaptive Behavior Assessment System-Second Edition ABC Adaptive Behavior Composite
ADDM Autism and Developmental Disabilities Monitoring
ADHD Attention Deficit-Hyperactivity Disorder APA American Psychiatric Association ASD Autism Spectrum Disorder
CDC Center for Disease Control & Prevention
CSESA Center on Secondary Education for Students with ASD
DSM-III Diagnostic and Statistical Manual of Mental Disorders, Third Edition DSM-IV Diagnostic and Statistical Manual of Mental Disorders, Fourth Edition DSM-5 Diagnostic and Statistical Manual of Mental Disorders, Fifth Edition FES Family Empowerment Scale
FPG Frank Porter Graham Child Development Institute IACC Interagency Autism Coordinating Committee ID Intellectual Disability
IDEA Individuals with Disabilities Education Act IEP Individualized Education Plan
IQ Intelligence Quotient IRB Institutional Review Board LEA Lead Education Agency
PDD Pervasive Developmental Disorder
RRBs Ritualistic and Restrictive Repetitive Behaviors
SRS-2 Social Responsiveness Scale, Second Edition, Teacher Form U.S. United States
CHAPTER I: INTRODUCTION
The prevalence of autism spectrum disorder (ASD) has risen over the past several decades, and the Center for Disease Control & Prevention (CDC) report states that 1 in 59 children today are diagnosed with autism (Baio, 2014). ASD is a neurobiological developmental disability, first described by Kanner (1943), characterized by a range of social impairments, nonverbal and verbal communication difficulties, and excessive displays of restricted, repetitive, and stereotyped patterns of behavior (American Psychiatric Association [APA], 2013; National Institute of Neurological Disorders and Stroke, 2014).
The criteria for an ASD diagnosis have undergone significant changes as research has improved the definition and criteria for this disorder. The American Psychiatric Association (APA) first distinguished the clinical presentation of autism in 1980, with the third edition of the Diagnostic and Statistical Manual of Mental Disorders (DSM-III). This publication provided diagnostic criteria for infantile autism and pervasive
developmental disorder (PDD). The criteria and definition for autism has undergone multiple revisions and has since become recognized as a spectrum of behavioral
Manual of Mental Disorders, Fifth Edition (DSM-5), published in 2013, ASD was
redefined as a single disorder (Christensen, 2018). This definition of ASD, subsumed the previous categories of Asperger’s disorder, PDD – not otherwise specified, and autistic disorder. More specifically, the DSM-5 provides two main criteria within this definition of ASD. Included in this diagnostic criterion for an ASD diagnosis are severity levels for social communication and restricted and repetitive behaviors (5th edition; APA, 2013). The three severity levels include level one requiring support and level three requiring substantial support. Further information about the diagnostic criteria for ASD is explained in the literature review.
adulthood. There is growing awareness regarding caregiver burden for families raising children with ASD (Smith & Anderson, 2014). Previous studies indicate parents of youth with ASD and parental stress were most strongly related to child’s behavior and degree of conduct problems, rather than the severity of developmental delay, lack of adaptive skills, or demographic characteristics of the family (King et al., 1999; Hartley et al., 2012; Mao, 2012). Adolescents and young adults with ASD generally have continued impairment in communication skills, social interaction, and independent living skills as they age.
Given the crucial role that parents play in their child with ASD’s life, and often acting as their main caregiver as they age, it is important that caregivers who provide for children with ASD receive support as their children transition out of high school. Additionally, it is important to recognize the factors that contribute to the burden that caregivers are facing as their children with ASD transition into adulthood, so the proper services can be made available to them to help alleviate some of the burden they may experience. As parents are usually the primary provider of care to their child with ASD, and often have other responsibilities to balance, this increase in care may lead to higher levels of stress in parents (Peer & Hillman, 2014). Moreover, having a child with disabilities is associated with child-caring stress as well as less time for parents to meet their own needs (Lee, Harrington, Louie & Newschaffer, 2008).
attempts to build on and address gaps in the past research by examining both child
characteristics and family characteristics and how they contribute to caregiver burden. In addition, this study seeks to learn more about empowerment as a possible mediator or moderator of caregiver burden. There is a need for research on this topic to better understand factors that are related to caregiver burden that can contribute to the
Chapter II: REVIEW OF LITERATURE
on the stress process model, which will be used as the theoretical framework for this study. The third section will focus on understanding current research in the literature about what may be contributing to higher levels of caregiver burden in parents of children with ASD. Following this review, the limitations of previous research and the rationale for this study will be discussed, including the research questions being examined in this study and related hypotheses to posed research questions.
Core Features of ASD
The DSM-5 outlines two main criteria to meet diagnostic criteria for a diagnosis of ASD. Individuals with ASD have core deficits in socio-communicative ability and behavior (Weiss et al., 2015). Deficits in socio-communicative ability or criterion A in the DSM-5, describe deficits in social-emotional reciprocity, nonverbal communicative behaviors, and developing and maintaining social friendships. Social-emotional
restrictive repetitive behaviors (RRBs). For children with ASD this can manifest in a variety of ways. For example, children with ASD may be highly sensitive to everyday
stimuli when compared to typically developing children (e.g., the sound of a toilet
flushing). This may also manifest in a diminished response to everyday stimuli (e.g., not
noticing the changes in temperature) or may seem to derive excessive pleasure from
certain stimuli (e.g., touching a particular texture; Kirby, White, and Baranek, 2015).
Additionally, included in this category would be several types of RRBs, including but not
limited to stereotypy, obsession, compulsions, echolalia, rituals, self-injurious behavior,
and insistence on sameness (Malmberg, 2007). A diagnosis of ASD is determined based
on DSM-5 criteria and other factors such as daily functioning and a thorough clinical interview with the child’s caregiver and an assessment with the child.
In addition to the previous criteria being met for a diagnosis of ASD, individuals with ASD often have complex medical and psychological profiles with co-occurring medical or psychiatric conditions. For example, co-morbid medical or psychiatric conditions can include, but are not limited to anxiety, intellectual disability (ID), ADHD, behavioral, sleep, sensory processing, and gastrointestinal problems. Levy and
colleagues (2010) reported that 83% of 8-year old children with ASD had at least one co-occurring developmental diagnosis, 16% had at least one co-co-occurring neurologic
cognitive, speech or language, psychological or self-care conditions that typically originate during childhood; are likely to continue indefinitely; and require additional coordinated services, supports, or other assistance for an extended duration or during a lifetime” (pp. 19). For example, of the 79.5% of those with ASD, also had a co-occurring “other developmental delay,” and 41.8% had a co-co-occurring diagnosis of ADHD (Boulet et al., 2009). Co-occurring conditions/symptoms can increase the societal impact of ASD, as they often contribute to a higher level of impairment and increased need for services (Soke et al., 2018).
As ASD symptoms persist into young adulthood, many of the impairments do as well. For example, many children with ASD show continued impairments in daily living skills, communication, social interaction, employment, and education (Cadman et al., 2012). Although these deficits continue into young adulthood, often there is less access and availability of services to support individuals with ASD into this transition into young adulthood. As ASD is a spectrum and presents differently among individuals diagnosed, there are several areas of an individual’s life that are often impaired by a diagnosis that may need supports into young adulthood after high school. This support is often provided by the parents of those with ASD, which can lead to increased amount of stress and burden placed upon the parents. Furthermore, depending on the nature and severity of ASD symptomology, the individual may require significant personal care and monitoring to ensure their overall health and safety as they transition into adulthood and out of high school services. Much of this care is placed upon the parents of the
self-sufficient and living independently because of an inability to achieve a higher level of education and sustain employment (Mao, 2012).
Caregiver Burden
The concept of family burden has been widely discussed and is one of the most commonly used variables in caregiver research, however there is a lack of agreement on the conceptualization and concrete definition of caregiver burden. Caregiver burden is a multidimensional construct that maintains varying definitions within the literature. Moreover, the meaning of burden is further obscured by the use of other terms such as “well-being, stress, and adverse effects” (Montgomery, Stull & Borgatta, 1985). However, the concept of caregiver burden has been a useful way for researchers to conceive how the caregiving role may negatively impact family members who may take it on within their family. The concept of burden was first introduced in the literature by Grad and Sainsbury (1966) and was defined as any cost to the family of which the patient is a member. In 1980, Zarit and colleagues defined burden as “the extent to which caregivers perceived their emotional, physical health, social life, and financial status as a result of caring for their relative” (pp. 261). More recently, Vogan et al. (2014) describe caregiver burden as the “perception of psychological distress, anxiety, depression,
dimensions of ‘caregiver burden’ according to this definition, research that investigates caregiver burden can include some or all of these dimensions. Furthermore, Pearlin et al. (1990) conceptualized caregiver burden as an outcome variable, when considered within the context of the stress process model. The stress process model incorporates multiple layers of stress (e.g., individual, family, and community level), with a focus on predicting mental health outcomes, while also accounting for possible mediators. By understanding how burden factors into the stress process model, researchers can gain greater insight into the variables that affect caregiver burden (Pearlin et al., 1990).
Theoretical framework. There are many theoretical models of stress in the literature, the double ABCX model and the stress process model seem particularly
important in understanding the multidimensional factors of caregiver burden in parents of children with ASD in high school. A brief overview of the ABCX stress model will be followed by a discussion of the stress process model and its applicability to this study. ABCX Formula. The ABCX Formula is the basis of most family stress models, based on research done by Reuben Hill, who is considered the father of family stress theory (Weber, 2011, p. 82). As a sociologist, Hill’s research examined the ways that families managed stress during World War II. His model of the ABCX Formula focuses primarily on precrisis variables of families, with each letter of the formula signifying an element in the model (Weber, 2011 & McCubbin & Figley 1983). Much like a
a linear, deterministic model (Weber, 2011, p. 84).
In 1983, family scientists Hamilton McCubbin and Joan Patterson, added
postcrisis variables, into the ABCX Formula to create the Double ABCX Formula. The Double ABCX Formula explains and predicts how families recover from crisis and why some are better able to adapt than others to the ABCX Model (Weber, 2011, p. 83). Figure 1 shows a simple depiction of the Double ABCX Model. Within this model, stress is viewed as the interaction between demands (known as the stressors), on one hand, and available resources, coping style and cognitive appraisal, on the other (Stuart & McGrew, 2009). Although the Double ABCX model has been used successfully in several studies of adaptation of families of children with ASD, this dissertation uses the theoretical framework of the stress process model because it introduces the idea of a mediator variable that can provide additional information on the effects of the stressors on the outcome variable.
Figure 1. McCubbin & Patterson’s Double ABCX Model.
come together to form a process of stress, using a three-dimensional concept of domains. These include, the sources of stress or the background and context of stress, the mediators of stress, which ultimately impacts the caregivers’ wellbeing outcomes. Within each of these three domains (i.e., stressors, mediators, and outcomes) subsumes a variety of subparts. The caregiving experience and associated stress process reflects a process that changes over time. Moreover, Pearlin’s stress process model suggests that primary stressors are those anchored in the needs and demands of the caregiving required, which interacts with secondary stressors, consisting of role strains and intrapsychic factors (intrapsychic strains involve dimensions of self-concept and kindred psychological states). Pearlin’s stress process model suggests that stressors and resources (such as informational, emotional, and instrumental resources) exist which affect the caregivers’ well-being, physical and mental health, and the caregivers’ ability to sustain their own social roles (Pearlin et al., 1990; Raina et al., 2004). When applied to caregiving, caregiver burden is an outcome which is affected by the caregiver’s background or the caregiving context, and primary stressors – which are those factors that are directly linked to the individual and the disability (Pearlin et al., 1990, Raina et al., 2004). This
seen in Figure 2.
Figure 2. Pearlin et al.’s (1990) conceptual model of caregiver’s stress relate to caring for an individual with Alzheimer’s disease.
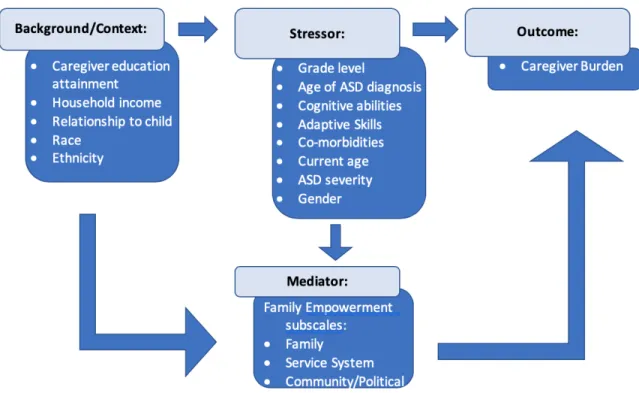
An adapted stress process model used for this current study is depicted in Figure 3. For the current study, background/context variables are considered family characteristics, such as the primary caregiver’s educational attainment, total household income, the primary caregiver’s relationship to the child with ASD, etc. Primary stressors are considered objective indicators of the child’s level of functioning, such as cognitive abilities, adaptive skills, and ASD symptom severity, or other relevant child
Figure 3. An adapted conceptual model of Pearlin’s stress process model and the predicted relationships for this study (Pearlin et al., 1990).
Caregiver Burden in Parents of Adolescents with ASD
As ASD is a lifelong neurodevelopmental disability, mothers and fathers often have active parenting responsibilities in their child’s adolescence and adulthood (Krauss, Steltzer, & Jacobson, 2005). Additionally, parenting an adolescent or adult with ASD presents unique challenges, including assisting the individual transitioning out of school services and navigating post-secondary education options, community settings, and long-term-care (Hartley et al., 2011). Families of children with ASD often have additional concerns that families of typically developing children generally do not have to consider. For example, parents with typically developing children can reasonably expect their children to gain independence around young adulthood in most cases. Parents of children with ASD do not have the same expectation, as care is often expected to continue
additional time, preparation, thought, energy, and planning in terms of everyday activities that most parents of typically developing children take for granted, such as performing instrumental and basic activities of daily living and social outings (Harper et al., 2013). This can result in stresses and strains beyond those routinely endured by parents caring for only typically developing children. Whereas parents of typically developing children house, feed, clothe, transport, and financially support their offspring between 18 and 20 years, parents of children with ASD are engaged in care and provision of needs for their child often well into adulthood. Additionally, the transition out of high school for typically developing children is often a time of celebration and relatively smooth
transition into post-secondary options such as schooling or job placements, however, for parents of children with ASD the transition is a time when preparations must be made for the transition out of school-based services into adulthood (Seltzer et al., 2003). Shattuck and colleagues (2012) found that children with ASD have poor postsecondary
employment and education outcomes, especially in the first two years after high school, and often continue to live with their parents (Shattuck et al., 2012).
category and sampling fractions were calculated to produce enough students in each disability category, and a total of 11,276 students were selected and eligible to participate in the NLTS-2. Data was collected in five waves, 2 years apart from 2001 to 2009. At the end of the study, participants had been out of school for up to 10 years (Anderson et al., 2014). The NLTS-2 uses the outdated term ‘mental retardation’ to be consistent with the federal special education category definition and to be consistent with how the data were collected, however it is noted that intellectual disability is currently the preferred term. Anderson et al. (2014) examined the prevalence and correlates of three living arrangements among a nationally representative sample of postsecondary young adults with ASD: with a parent or guardian, independently or with a roommate, or in a
participation in employment or post-secondary education opportunities (Shattuck et al., 2012). Specifically, of the youth with ASD that had left high school within the last two years, more than 50% had no participation in employment or education. Additionally, Shattuck et al. (2012) found that higher income and higher functional ability were associated with higher adjusted odds of participation in postsecondary employment and education. Given that young adults with ASD have lower rates of postsecondary education and employment participation even compared to young adults with other disability types, it would make sense that this time would be a stressful time for parents of children with ASD. Moreover, this transition into adulthood for children with ASD is accompanied by a shift in service provision, as youth lose entitlement to school-based special education services and shift to a need-based model of service delivery, which can place an increased amount of care upon the parents of children with ASD (Anderson et al., 2014).
Table 1.
Participant Demographic Characteristics by Study
Study Diagnoses n
Participant ages (years)
Location Measure Burden
Vogan et al., 2014
ASD w/out ID ASD w/ ID
135
162 12 to 30 Canada
Caregiver Burden Scale
- 9 items Cadman et
al., 2012
ASD ADHD
101
91 14 to 24
United Kingdom
Zarit Burden Interview- 12
Item Kring et al.,
2008
ASD only ASD w/comorbidities
130
142 10 to 52
United States
Burden Interview -29
item
Lin, 2011 ASD 50 10 to 18 Taiwan
Caregiver Burden Scale
- 18 items Child factors related to caregiver burden. A variety of child characteristics have been linked to caregiver burden in parents of children with ASD in the literature, including age of the child with ASD, adaptive functioning, cognitive functioning, the presence of psychiatric comorbidities in addition to an ASD diagnosis, and ASD symptom severity. The manifestation in the child’s ASD symptoms and other
characteristics of the child with ASD (e.g., cognitive functioning, adaptive functioning, academic ability, age) are objective conditions of the disability, and constitute actual care demands for the parent and would be considered stressors within the stress process model for this study (Raina et al., 2004).
transition out of high school into adulthood, it is understandable that caregiver burden would also increase. Hartley and colleagues (2011) found that age was negatively related to parenting burden in their study of 91 married couples co-residing with their adolescent or adult with ASD, indicating that parents of individuals with ASD in the adolescent phase reported more burden than parents of adult children (Hartley et al., 2011). This finding contradicts previous research by Kring et al. (2008) that did not find that child age was a significant predictor of caregiver burden; however, this study was aimed at maternal well-being rather than burden. More recently, Vogan et al. (2014) found similar results, in that child age was not associated with caregiver burden in their study of 297 parents of children with ASD. Given that the research is mixed on whether or not the age of the child is associated with caregiver burden, more research on age is warranted.
Gender. As autism is four times more likely to occur in boys, according to the CDC, examining gender differences can be important in creating targeted interventions towards parents of children of specific genders (Christensen et al., 2012). There are a number of studies that have examined the associations between caregiver burden and gender differences, however, most of these studies use a more diverse sample of male to female ratio. For example, in Cadman et al.’s (2012) study, 92% of the ASD group were males, while in Vogan et al.’s study, 81.1% were male (Vogan et al., 2012). This is an important variable to examine in a larger more diverse sample (i.e., larger sample of females) to determine whether or not gender is associated with caregiver burden.
functioning would most likely depend on others, likely their primary caregivers, to support their engagement in activities of daily living (e.g., dressing and bathing). Weiss, Sullivan, and Diamond (2003) examined adaptive functioning of 97 individuals with developmental disabilities, aged 9.3 to 42.5 years as a predictor of parental stress, and found that lower levels of adaptive functioning were predictive of higher levels of
parental stress. Similarly, Lin’s study on caregiver burden in mothers of adolescents with an ASD in Taiwan found that caregiver burden is associated with less functional
independence (Lin, 2011). Thus, it appears that adaptive functioning would contribute to caregiver burden, however this has not been studied in children with ASD in the US.
diverse sample is important in determining predictors of caregiver burden among parents of children with ASD.
Academic performance. The acquisition of functional academic skills can lead to better outcomes for children with disabilities by preparing children for employment, independent living, and economic self-sufficiency (Shandra & Hogan, 2009). Thus, one could presume that higher academic skills lead to more independence, which in turn can decrease the dependency that individuals with ASD have on their caregivers. It is
important to determine if academic abilities are associated to level of caregiver burden to inform that the proper interventions can be created and put into place. The Woodcock-Johnson, Third Edition - Tests of Achievement (WJ-III ACH) is a useful assessment to measure academic performance and can be used as a stand-alone assessment to measure achievement in individuals (Wendling, Schrank, & Schmitt, 2007).
Grade level. Previous research has proven that parents of early adolescent children reported significantly more stress than parents of preadolescents or middle adolescents (Small, Eastman & Cornelius, 1988). Therefore, one would expect that as a child advances in school as well as in grade level, that caregiver burden would likely increase. In fact, Hartley et al. (2011) found that parenting burden was higher for parents with adolescent children with ASD than those with adults with ASD. In contrast, Lin (2011) did not find an association between child age and maternal well-being in their sample of 10-18-year-olds with ASD. Of note, these studies did not focus on grade level exclusively; thus, examining the relationship between grade and caregiver burden can help identify the timing of potential interventions to alleviate the burden caregivers experience.
Co-morbidities. ASD has been consistently linked to high rates of co-morbidities (psychiatric, medical, and behavioral), which could further contribute to caregiver burden and the need for parents continued support during the transition into adulthood.
Prevalence rates of ASD and co-morbid conditions vary in the literature; Simonoff and colleagues (2008) noted that 70% of their 112, 10 to 14-year-olds had at least one co-morbidity (e.g., anxiety, oppositional defiant disorder, attention-deficit/hyperactivity disorder).
caregiver burden among individuals with ASD and psychiatric comorbidities as compared to those with ASD only. Based on these findings it appears that there is a relationship between the presence of a co-morbidity with ASD and caregiver burden.
ASD symptom severity. The severity of ASD symptoms is an important variable to capture in children with ASD, as many times it is one of the determining factors of the services an individual is eligible to receive (Weitlauf et al., 2014). As the core features of ASD (e.g., deficits in social communication and restricted and repetitive behaviors) can often lead to increased level of care, which is often provided by the caregiver, it is understandable that this is related to caregiver burden. In a large study of 880 parents of children with moderate and severe developmental delays, Smith, Oliver, and Innocenti (2001) found that the severity of the child’s disability had minimal impact on paternal distress and that a child’s social skills were a stronger predictor of parenting stress than were their motor, communication, adaptive behavior, or cognitive abilities. Further, Cadman and colleagues (2012) found that the severity of the ASD symptoms was not a significant predictor of burden in parents of children with ASD once need was controlled (need in this study was considered the caregiver’s primary appraisal of care needs). In contrast, Kring et al. (2008), Lin (2011), Vogan et al. (2014), and Stuart & McGrew (2009) all found ASD symptom severity associated with caregiver burden. Of note, all of the aforementioned studies used different measures to assess the severity of ASD
symptoms in their participants. Kring et al. (2008) used the Autism Diagnostic
based the severity of ASD diagnosis on a combination of verbal IQ scores, level of functional language, and social adaptation. Clear conclusions cannot be drawn based on the previous studies mentioned above, as most of them has small sample sizes of
participants with ASD. A clear understanding of how ASD symptom severity is associated with caregiver burden, could lead to more effective transition services for parents of children with ASD or support services available to them.
Family characteristics related to caregiver burden. Currently, findings related to caregiver burden and family characteristics among individuals with ASD have been mixed; thus, further exploration into this area is warranted. Within the stress process model used as a theoretical framework for this study, family characteristics are considered background or contextual variables (e.g., respondent’s relationship to the child with ASD, respondent’s educational attainment, total household income) and can influence how stressors are experienced.
Respondent’s relationship to child with ASD. Many of the previously mentioned studies either included exclusively mothers (e.g., Kring et al, 2008; Lin, 2011; and
Abbeduto et al., 2004) or they included both mothers and fathers, but with majority response levels among mothers; thus, this variable is more exploratory in nature. It appears that burden is differentially experienced by men and women in the caregiving role because of persistent sex role differences and greater female life expectancy, women are much more likely than men to assume responsibility for providing direct care (Chou, 2000).
to socioeconomic status (Raina et al., 2004). Generally, more education leads to higher levels of potential earnings (i.e., income); however, findings related to caregiver burden and parental educational attainment status have been mixed. For example, Kring et al. (2008) found that higher levels of education in parents reported greater burden in parents of children with ASD. In contrast, a more recent study conducted by Cadman at el. (2012) did not find this relationship between parental education and caregiver burden. Similarly, a study conducted by Vogan and colleagues (2014) did not find that higher levels of education lead to higher levels of caregiver burden in their study of 297 parents of adolescents and young adults, ranging in age from 12 to 30 years old, with ASD in Ontario, Canada. It should be noted that the majority of respondents were highly educated (75%), and the lack of diversity could contribute to the lack of association. Findings related to caregiver burden and parental education have been mixed, thus additional research is warranted to examine associations of caregiver burden and parental education.
families with higher income had higher adjusted odds of participation in postsecondary employment and education, thus suggesting that it may be easier for parents with higher income to access opportunities for their young adult children in the community.
Respondent’s race and ethnicity. Race can affect the intensity of the experience of caregiver burden, as race is often attached to culture and varying cultural values also affect caregiving decisions about the care of children with special health care needs (Chou, 2000). Indeed, Blacher & McIntyre (2006) reported that cultural differences exist in caregiver reports of depression, morale, and positive perceptions in their study of 282 Anglo and Latino caregivers of young adults with ID. It appears race and ethnicity can be differentially experienced by individuals of different races/ethnicities; thus, it is
important to examine race and ethnicity to determine if they can affect the level of burden parents feel and in return help inform interventions. More research in this area is
warranted as there is limited studies examining the effects of race and ethnicity on caregiver burden among parents of children with ASD.
Family empowerment. Empowerment is defined as “…an intentional, ongoing process… through which people lacking an equal share of valued resources gain greater access to and control over those resources” (Cornell Empowerment Group, 1989, p. 2). According to Zimmerman (1995), empowerment can be viewed as a process
their child and their family. Singh et al. (1995) described parental empowerment as a process through which families can access knowledge, skills, and resources that enable them to gain positive control over their lives. Parent empowerment has been associated with positive outcomes in families of children with developmental disabilities (Koren, DeChillo & Friesen, 1992). Weiss and colleagues (2015) examined a sample of 156 mothers of children with ASD in a wide range of ages (4 to 21-years old) to investigate how parent empowerment and positive gain are related to their experiences of distress. Results suggested that more child problem behaviors were related to less maternal empowerment, which in turn was related to greater maternal distress, thus supporting empowerment as a partial mediator in their study
(Weiss, MacMullin & Lunsky, 2015).
As shown in Figure 3, the depiction of the conceptual model used for this study in terms of caregiver burden in parents of children with ASD in high school used the stress process model framework. In this prediction model, the interaction between the
background and context, stressors, and outcome are thought to be mediated by family empowerment. The statistical analysis looks at the direct links between the
background/context variables and outcomes, the direct links between the stressor
cognitive abilities, academic skills, adaptive skills, the presence of any co-morbidities in addition to ASD, age of the child upon enrollment in the study, ASD symptom severity, and the child’s gender. The outcome for this study is caregiver burden. In addition, family empowerment is first considered as part of the process that is taken into account when looking at caregiver burden, then it is examined as a possible mediator between predictor variables and caregiver burden. A mediator variable is a variable that explains the relationship between the independent variable and dependent variable and can produce changes in the dependent variable.
As caregiver burden has been conceptualized in a multitude of ways, a summary of the studies utilizing the term caregiver burden, as well as well-being and/or stress is included in Appendix 1.
Convergence of Findings
In evaluating the four studies that examined multiple factors associated with caregiver burden in caregivers of children with ASD, it can be determined that various themes reoccurred within the literature (Table1; Vogan et al., 2014; Kring et al., 2008; Cadman et al., 2012; & Lin, 2011). All the studies found that parents of children with ASD had high levels of caregiver burden, as well as higher levels of burden than parents of children with other disabilities (e.g., ADHD and Down Syndrome). In addition, all four of the studies considered family background and child characteristics as important factors associated with caregiver burden. Albeit different in each study, there is a consensus that a combination of family and child characteristics can contribute to the variance associated with caregiver burden in parents of children with ASD.
studies (e.g., measures used to assess caregiver burden and ASD symptom severity, etc.). For example, in two of the studies caregiver burden was measured by the Zarit Burden Interview (ZBI; Kring et al., 2008 and Cadman et al., 2012), while Vogan et al. (2014) used a 9-item Caregiver Burden Scale, a subscale of the Revised Caregiver Appraisal Scale, and Lin (2011) used a Caregiver Burden Scale, which included 18 items and developed in Chinese. In addition, ASD symptom severity was measured differently among all four studies. Vogan et al. (2014) used the Social Communication
Questionnaire Lifetime, which consists of 40 items that are based on the Autism
Diagnostic Interview – Revised (ADI-R). The ADI-R was used in Kring and colleagues (2008) study, while Cadman et al. (2012) used the Autism Quotient-Informant to capture the current severity of ASD symptoms, and Lin’s (2011) study utilized a combination of verbal IQ scores and levels of function language and social adaptation to determine the severity of autism diagnosis. Lastly, the country the studies were conducted varied, which can have an impact on family characteristics, such as income and education. For
example, both Cadman et al. (2012) and Vogan et al. (2014) studies were conducted in countries with universal health care, (e.g., United Kingdom and Canada respectively), where services are provided regardless of income. Lin’s (2011) study was conducted in Taiwan, while Kring et al. (2008) study was conducted in the U.S.
while 162 had a diagnosis of ASD and co-morbid ID. Moreover, Lin’s (2011) study consisted of 50 adolescents with ASD and did not use a comparison group.
Table 2 shows the inconsistencies of findings among the four studies that examined child characteristics/background variables and caregiver burden. Table 2.
Inconsistencies of Findings from Previous Studies Vogan et al. 2014 n=297 Cadman et al. 2012 n=192
Kring et al. 2008 n=272 Lin 2011 n=50 Child Characteristics
ASD Comorbid ID - +
ASD Symptom Severity + - + +
Externalizing Behaviors + + +
Psychiatric Comorbidities + + +
Adaptive skills +
Age of Child - -
Gender of Child -
Parental/Family Characteristics
Marital Status -
Parental Age +
Parental Education - - +
Household Income -
- Not significant in predicting caregiver burden + Significant in predicting caregiver burden
Note: the sample (n) in this chart are indicative of the whole study, not just ASD specific population within the study
Rationale of Factors
income, and family empowerment. Variables such as parental marital status and parental age will not be included in this study as this information is not available in the dataset.
Research Rationale
Limitations of Previous Research
unpredictable behavior, poorer health ratings, or greater frequency of gastrointestinal problems.
Conclusions
As young adults with ASD generally will have continued impairment in
communication skills, social interaction, and independent living skills into adulthood and because fewer services exist to support young adults with ASD through adulthood, they tend to rely heavily on the assistance from family and friends. Previous research has reported high levels of caregiver stress and burden in parents caring for children with ASD than parents of children with other disabilities such as Fragile X syndrome and Down syndrome (Hartley, Seltzer, Head & Abbeduto, 2012; Dabrowska & Pisula, 2011; Smith & Anderson, 2014; Cadman et al., 2012). However, much of the research is inconsistent on what variables contribute to caregiver burden, a more in-depth
understanding of these factors commonly associated with caregiver burden in parents of children with ASD, as well as the impact of the variables on caregiver burden is needed.
Purpose of Current Study
Figure 4. Predicted Relationships Between Caregiver Burden and Child/Family Characteristics
Research Questions and Hypotheses
Research Question 1. What are the significant relationships between child characteristics and caregiver burden in parents of adolescents with ASD?
Hypotheses associated with research question 1.
• Measures of adaptive skills and cognitive abilities are hypothesized to predict caregiver burden with an inverse relationship. Specifically, the lower the adaptive skills and cognitive abilities, the higher the caregiver burden in parents of children with ASD in high school.
• ASD symptom severity as measured by the Social Responsiveness Scale-Second Edition, Teacher (SRS-2) form, the presence of co-morbidities, age of ASD diagnosis, grade in school, and current are hypothesized to significantly predict caregiver burden directly. More specifically, the more ASD symptoms an
-Lower adaptive skills -Lower cognitive abilities
-More severe ASD symptomology -1 or more co-morbidities -Older children -Higher grade level
-Higher household income
-Younger age of ASD diagnosis
more co-morbid diagnoses, the older a child is, and higher grade the child is in school are likely to increase caregiver burden, while younger age of ASD diagnosis the lower the caregiver burden in parents of children with ASD. • Passage Comprehension and Academic Knowledge (measured by subtests of the
WJ-III ACH) and gender of the child with ASD are more exploratory in nature as there are few studies in the previous research on caregiver burden in children with ASD.
Research Question 2. What are the significant relationships between family demographic characteristics and caregiver burden?
Hypotheses associated with research question 2.
• Respondent’s race and ethnicity are exploratory in nature, as much of the research
on family demographics and their contribution to caregiver burden is mixed. • Total household income, respondent’s educational attainment, and family
empowerment are hypothesized to predict caregiver burden with an inverse relationship. That is, the higher the total household income, higher educational attainment and higher levels of family empowerment (within each of subscales; Family, Service System, and Community/Political, the lower the level of burden as reported by the caregiver.
Research Question 3. How is empowerment of families associated with caregiver burden?
Hypotheses associated with research question 3.
• Higher scores on the Family Empowerment Scale (FES) are hypothesized to be
indicate higher levels of empowerment.
• In addition, higher scores within each of the three subscales of the FES (i.e., Family, Service System, Community/Political) are hypothesized to be associated with lower levels of caregiver burden.
CHAPTER III: RESEARCH METHODS
This study is a secondary analysis of the Center on Secondary Education for Students with ASD (CSESA) data from a 3-year randomized control trial on high school students with ASD. Participants in this study were part of a larger research project examining the efficacy of a comprehensive treatment model for high school students on the autism spectrum (CSESA), a grant funded by the Institute of Education Sciences through Frank Porter Graham Child Development Institute (FPG). Sixty high schools across three states (North Carolina, California, and Wisconsin) were randomly assigned to the intervention (CSESA) or services-as-usual group. The current study does not address intervention efficacy and only utilizes data collected prior to the intervention; thus, no further distinction between participant groups is made. Baseline data about the student participants were collected from the students with ASD, their teachers, and their parents. Parents also completed measures related to family demographic characteristics (e.g., household income and educational attainment) and personal well-being (e.g., caregiver burden and empowerment).
Procedure
questions will be addressed: (1) What are the significant relationships between child characteristics and caregiver burden in parents of adolescents with ASD?; (2) What are the significant relationships between family demographic characteristics and caregiver burden? and (3) How is empowerment of families associated with caregiver burden in parents of children with ASD in high school?
Inclusion/Exclusion Criteria
The inclusionary criteria were as follows: (a) students had an Individualized Education Plan (IEP) with a primary or secondary educational label of autism, (b) had at least two years remaining in school, and (c) had family who could complete forms in either English or Spanish. Children and their parents were recruited at each high school site. Schools were given study packets with informational fliers and consent forms to send home to families of all students who met eligibility criteria. The families then mailed the completed consent forms in a pre-addressed, pre-stamped envelope directly to the research staff or returned the study packets to the school. All parents consented to their participation; adolescent assent was conducted at the initial testing session.
Ethical Considerations
This study was conducted in compliance with the University of North Carolina’s Institutional Review Board (IRB; #13 – 3002). For the current study, all electronic files from FPG were de-identified prior to receipt of secondary data.
Participants
demographic information about their child and their own demographic information, and while the data the parent provided was prioritized, supplemental data from the school was used regarding grade, gender, ethnicity and race of the child, if the parent did not
complete the demographic form. The child participants in this study are 86% male (n = 469) and 14% female (n = 75), ranging in age from 13 to 20 at the beginning of the research study. In 2012, the CDC estimated the overall prevalence ratio for boys
compared to girls was 4.5, thus the study sample is relatively similar to the expected ratio of males to females (Christensen et al., 2012). Of the 544 children who participated in this study, 61.9% of the child’s parent identified them as White (n = 337), 12.9% identified as Black or African-American (n = 69), and less than one percent were
Census Bureau found that 76.5% of the U.S identified as white alone, 13.4% identified as Black or African American alone, 1.3% identified as American Indian and Alaskan Native alone, 5.9% identified as Asian alone, 0.2% identified as Native Hawaiian and Other Pacific Islander alone, and 2.7% identified as two or more races. As far as race and Hispanic origin, 60.4% identified as White alone, Non-Hispanic or Latino and 18.3% identified as Hispanic or Latino (United States [U.S.] Census Bureau, 2018). In addition, parents provided information on additional medical and psychiatric co-morbidities their child had been diagnosed with in addition to ASD. The most common co-morbid diagnosis was attention deficit disorder, occurring in 23.9% of participants (n = 130), followed by anxiety disorder, occurring in 16.7% of participants (n = 91).
Measures
This descriptive, associational study examines the relationship between caregiver burden and a variety of child and family characteristics in children with ASD, as well as empowerment as a possible mediator between the child and family characteristics and caregiver burden. A detailed battery of clinical and psychological tests and questionnaires completed by teachers, research staff, and caregivers, were used to extract specific
quantitative information. The measures used for the study are discussed below.
Child and family demographic form. To gather demographic information on participants and their caregivers, the Child and Family Demographic Form was given to the parents of children with ASD to fill out, and included 11 questions related to the child’s age, gender, grade level, age of ASD diagnosis, and any diagnosed
educational attainment, and total household income. In addition, there was room for a second caregiver information to be filled out regarding, relationship to the child, ethnicity, race, and highest level of education achieved, which was inconsistently filled out (Appendix 2). For the purpose of this study, it is assumed that the primary caregiver completed the form, thus using their information as caregiver 1. With regard to grade level, 9th, 10th, 11th, 12th, and “other” were the options available to choose from, where “other” would be considered a child repeating a grade, past 12th grade. As children in special education are entitled to educational services until their 21st birthday, they may be repeating 12th grade a number of times and would therefore be considered in an “other” grade.
The Vineland Adaptive Behavior Scales, Second Edition. The Vineland Adaptive Behavior Scales, Second Edition (Vineland-II) assessment was designed to measure adaptive behavior in individuals from birth to 90 years of age and can aid in diagnosing and classifying intellectual disabilities and other disorders such as autism and global developmental delays. The scales of the Vineland-II are organized within a four-domain structure: Communication, Daily Living Skills, Socialization, and Motor Skills.
This structure corresponds to the broad domains of adaptive functioning set forth by the
American Association of Intellectual and Developmental Disabilities: Conceptual,
Practical, and Social (PsychCorp, 2016). Each of the four domains within the
Vineland-II have two to three subdomains. The scores for three specific adaptive behaviors
domains (i.e., Communication, Daily Living Skills, and Socialization) yield an overall
adaptive behavior composite (ABC) score. Questions on the Vineland-II are rated using a
sometimes present, and 2 – always present. Raw scores are converted to standard scores
with a mean of 100 and a standard deviation of 15. The Vineland-II assigns adaptive
functioning levels for ranges of standard scores: high (130 – 140), moderately high (115
– 129), adequate (86 – 114), moderately low (71 – 85), and low (20 – 70).
A large normative sample (n=3,695) was used that is representative of the general
population in the United States, including ethnicity, gender, and socioeconomic status.
Reliability, in terms of split-half reliability coefficients for the composite scores ranged
from .84 to .93; and test-retest reliability coefficients for the Composite scores ranged
between .86 to .92. Concurrent validity is highly correlated with the Adaptive Behavior
Assessment System-Second Edition (ABAS-II), with the overall Adaptive Composite on
the Vineland-II and the General Adaptive Composite scores on the ABAS-II correlated at
.70 (Community-University Partnership, 2011).
This study utilized the Vineland-II, Teacher Form to obtain a measure of adaptive skills for child participants. A teacher that was familiar with the child participating in the study completed the adaptive rating scales, taking approximately 25 minutes to complete
for each child. This study utilized the ABC standard score which includes the
Communication, Daily Living Skills, and Socialization domains.
Response options include, 1- not true, 2 - sometimes true, 3 - often true, and 4 - almost always true. The SRS-2 yields the following treatment subscales: Social Awareness, Social Cognition, Social Communication, Social Motivation, and Restricted Interests and Repetitive Behavior. These subscales yield the overall total score (Constantino &
Gruber, 2012). Raw scores are converted to T-scores, with a mean of 50 and a standard deviation of 10. T-score ranges are as follows; T-scores of 76 and higher are considered severe – suggesting that an individual has clinically significant deficits in social
functioning that interfere with interactions with others, scores that fall between 66 and 75 are considered moderate – signaling some clinically significant social deficits, scores that fall within 60 to 65 are considered within the mild range – indicating deficiencies in reciprocal social behavior that are clinically significant and may lead to mild to moderate interference with everyday social interactions, and scores of 59 and below are considered to be within the normal limits and indicate that the individual probably does not have social difficulties (Constantino & Gruber, 2012). The SRS-2 includes items related to both autism symptom domains of social communication impairment, and
stereotyped/repetitive behaviors (Constantino et al., 2003).
The School-Age Form for the SRS-2 covers ages 4 to 18 years. The School-Age Form yielded a total reliability coefficient of .95 with a large normative sample (n =
1,014) that was representative of the general population in the United States for the
school-age sample (Constantino & Gruber, 2012). In regards to validity, the School-Age
Form was found to have moderate to high correlations between other rating scales of
social behavior and communication (e.g., Social Communication Questionnaire, the
Checklist, and the Childhood Autism Rating Scales; Constantino & Gruber, 2012).
In order to measure ASD symptom severity, the SRS-2 Teacher Form was used in this study. It was given to teachers who were familiar with the child participating in the study to complete, taking approximately 15 to 20 minutes for each student. This study utilized total T-scores.
Woodcock-Johnson, Third Edition - Tests of Achievement. The WJ-III ACH is a widely used, individually administered test used to measure overall academic
performance. It includes 22 different tests measuring skills in reading, mathematics, oral language abilities, and academic knowledge (Wendling, Schrank, & Schmitt, 2007).
Normative data for the WJ-III ACH was gathered from 8,818 subjects in over 100
geographically diverse U.S. communities, ranging in age from 24 months to 90 years and
older. More specifically, the kindergarten through 12th grade sample composed of 4,783
subjects (Schrank et al., 2001). Regarding concurrent validity, the General Intellectual Ability measured by the WJ-III ACH had correlations ranging from .67 to .76, with the
full scale or composite scores from the Wechsler Preschool and Primary Scale of
Intelligence – Revised and the Wechsler Intelligence Scale for Children – Third Edition
(Schrank et al., 2001).
The WJ-III ACH subtests used in this study were Passage Comprehension and the Academic Knowledge (Science, Social Studies, and Humanities subtests are also known as the Academic Knowledge cluster; McGrew et al., 2014). According to Wendling et al. (2007):
provided by the text during the process of reading. As the examinee reads, the meaning of the passage is derived through constructing mental representations based on concepts from stored knowledge. (pp.7)
The Academic Knowledge cluster of the WJ-III ACH has three subtests including Science, Social Studies, and Humanities, and is considered a measure of comprehension-knowledge (Wendling, Schrank, & Schmitt, 2007 & McGrew, LaForte, & Schrank, 2014). The median test reliability for Passage Comprehension is .88 and .90 for the Academic Knowledge cluster (Schrank et al., 2001).
To measure academic performance, trained research staff administered the Passage Comprehension and the Academic Knowledge cluster of the WJ-III ACH to participants of the study, generally taking 45 minutes per participant. This study utilized the standard scores for each subtest (e.g., a standard score for Passage Comprehension and a standard score for Academic Knowledge cluster) generated by the online scoring software.
Leiter International Performance Scale, Third Edition. The Leiter
International Performance Scale, Third Edition (Leiter-3) offers a completely non-verbal measure of intelligence often administered for use with those who are cognitively
the test, in that administration and responses by the examinee do not require spoken language (Roid & Koch, 2017). The subtests of the Leiter-3 yield a raw score, which are converted to scaled scores, and the sum of the scaled scores yield a cognitive composite score for nonverbal IQ. Scaled scores are normalized standard scores and have a mean of 100 and a standard deviation of 15. Standard score ranges are as follows: extremely high/gifted (150-170); very high/gifted (130-149); high (120-129); above average (110-119); average (90-109); below average (80-89); low (70-79); very low & mild delay (55-69); moderate delay (40-54); and severe delay (30-39).
Standardization for the Leiter-3 was performed on 1,603 nationally stratified individuals. Internal consistency reliability coefficients, for the four subtests used range from .79 to .95. The concurrent validity for the Leiter-3 was established with the WJ-III COG (note that this is a different WJ-III test that was used in this study to assess
academic performance - the WJ-III ACH in this study) with correlations ranging from .77 to .92. Additionally, the Leiter-3 was validated with the Stanford Binet – 5th Edition and had a correlation score of .85 (Genseke, 2014).
To measure non-verbal cognitive ability, participants in this study were
individually administered four subtests of the Leiter-3 by trained research staff, taking approximately 30 minutes to an hour to administer to each participant. The subtests used in this study included, Figure Ground, Form Completion, Classification/Analogies, and Sequential Order, which are the four subtests needed for a nonverbal IQ composite score.
(Koren, Dechillo, & Friesen, 1992). The conceptual framework behind the development of the FES consists of two dimensions; the level of empowerment and the way that empowerment is expressed (Koren, DeChillo, & Friesen, 1992). Each item on the FES is a statement, in which the rater is asked to rate on a 5-point Likert scale format. Response options include, 1 – not true at all, 2 – mostly not true, 3 – somewhat true, 4 – mostly true, 5 – very true. Scores for each of the three subscales (Family, Service System, and Community/Political) are calculated by summing scores for the subscale items and dividing the number of questions within that subscale. Although all subscale scores can be summed to obtain an overall score ranging from 3 to 15, the scoring guide
recommends using each subscale rather than an overall score because each subscale addresses a different topic. The Family subscale is comprised of 12-items, and is considered the immediate situation at home and primarily involves the parent’s management of day-to-day situation. The Service System subscale is comprised of 12-items and refers to the parent’s working with the service system to obtain services for their child. The Community/Political subscale is comprised of 10-items related to legislative bodies, policymakers, and involves the parent advocacy (Kageyama et al., 2016).
The FES was constructed using standard techniques and piloted with 94 parents of children with emotional disabilities (Koren, 1992). Internal consistency of the FES was examined in terms of the three subscales; Family, Service System, and
terms of validity, two analyses of validity were completed which support the
correspondence of the FES items to the concepts fundamental to the instrument design (Koren et al., 1992). Sample items include “I feel my family life is under control;” “I understand how the service system for children is organized;” and “I am able to work with agencies and professionals to decide what services my child needs.”
In order to measure family empowerment, the FES was given to the caregivers of participants to fill out, taking approximately 10 to 20 minutes to complete. For this study, scoring was done by an unweighted summation of the items on each subscale (Family, Service System, and Political/Community) divided by the number of items within the subscale (e.g., both the Family and Service System subscales have 12 items, while the Political/Community subscale has 10 items). Possible score ranges were 1 to 5 for each of the three subscales, with higher scores indicating higher levels of family empowerment. Cronbach’s alphas for the 12-item Family, 12-item Service System, and 10-item Community/ Political subscales were .88, .89, and .87 respectively for this study. The means and standard deviations for each of the subscales were as follows: M = 4.11, SD = .54 for Family, M = 4.13, SD = .57 for Service System, and M = 3.12, SD = .78 for Community/Political.
relationship between the caregiver and the impaired person). The Burden Interview had a 4-point Likert type response scale, with a possible total burden score of 84 (Bachner & O’Rourke, 2007; Zarit et al, 1980). A total burden score was calculated with four of the 29 items were scored in the opposite direction and subtracted from the total (Zarit et al., 1980). The ZBI was later reduced to 22-items, with a 5-point Likert type response scale, and is one of the most commonly used instruments to assess caregiving burden in clinical and research settings (Bachner & O’Rourke, 2007; Al-Rawashdeh, Lennie, & Chung, 2016). It subsequently has been modified for use with a diverse range of patient populations and caregivers, and translated into a variety of languages, such as: French, German, Hebrew, Japanese, Korean, and Chinese (Bachner & O’Rourke, 2007).
from the sum of the negative items, with a possible score range of 17 to 75, with higher scores reflecting greater burden. Modifications from the original ZBI for this study included using the words ‘son/daughter’ instead of ‘spouse.’ Sample items from the ZBI used in this study include “I feel that my son/daughter currently affects my relationships with other family members and friends in a negative way;” “I feel embarrassed over my son/daughter’s behavior;” and “Because of my involvement with my son/daughter, I don’t have time for myself.” Cronbach’s alphas for the 29 scored items on the adapted ZBI used for this study was found to be highly reliable (29 items; a = .89). See
Appendix 3 for a copy of the adapted ZBI used for this study.
Table 3.
Variables and Measures
Variable Measure Scale Type of
Data
Conversion
Child Characteristics: Child and Family Demographic Form
Age (years) Age: 13 - 21 Continuous None
Gender Gender: M = Male; F = Female Dichotomous None
Grade Level Grade: 9th, 10th, 11th, 12, Other Ordinal Recategorized:
“Other” = 13th grade
Co-morbidities Disorder is absent: 0; Disorder is
present: 1
Dichotomous None
Age of Diagnosis Age of Diagnosis: .5 - 20 Continuous None
Adaptive Skills Vineland Adaptive Behavior Scales, Second Edition (Vineland-II) Teacher Form Standard Score: Mean: 100 SD:15
Continuous None
ASD Symptom Severity Social Responsiveness Scale, Second Edition Teacher Form
(SRS-2)
T-Score Mean: 50 SD:10
Continuous None
Academic Performance Woodcock Johnson Test of Achievement-III (WJ-III ACH)
Standard Score: Mean: 100
SD:15
Continuous None
Cognitive Functioning Leiter International Performance Scale, Third Edition
(Leiter-3)
Standard Score: Mean: 100
SD:15
Continuous None