http://dx.doi.org/10.4236/epe.2013.59060
Mitigation of Unbalanced Voltage Sags and Voltage
Unbalance in CIGRE Low Voltage Distribution Network
*
Ghullam Mustafa Bhutto1,2#, Birgitte Bak-Jensen1, Pukar Mahat1, Carlo Cecati3
1Department of Energy Technology, Aalborg University, Aalborg, Denmark
2Department of Electrical Power, Quaid-E-Awam University of Sciences & Technology, Nawabshah, Pakistan 3Department of Information Engineering, Computer Sciences and Mathematics, Via G. Gronchi, L’Aquila, Italy
Email:[email protected], #[email protected], [email protected], [email protected], [email protected]
Received September 28,2013; revised October 28, 2013; accepted November 5, 2013
Copyright © 2013 Ghullam Mustafa Bhutto et al. This is an open access article distributed under the Creative Commons Attribution
License, which permits unrestricted use, distribution, and reproduction in any medium, provided the original work is properly cited.
ABSTRACT
Any problem with voltage in a power network is undesirable as it aggravates the quality of the power. Power electronic devices such as Voltage Source Converter (VSC) based Static Synchronous Compensator (STATCOM) etc. can be used to mitigate the voltage problems in the distribution system. The voltage problems dealt with in this paper are to show how to mitigate unbalanced voltage sags and voltage unbalance in the CIGRE Low Voltage (LV) test network and net-works like this. The voltage unbalances, for the tested cases in the CIGRE LV test network are mainly due to single phase loads and due to unbalanced faults. The compensation of unbalanced voltage sags and voltage unbalance in the CIGRE distribution network is done by using the four STATCOM compensators already existing in the test grid. The simulations are carried out in DIgSILENT power factory software version 15.0.
Keywords: Power Quality; Unbalanced Voltage Sags; Mitigation of Voltage Unbalance; Voltage Unbalance Factor (VUF); Distributed Static Compensator (STATCOM)
1. Introduction
Power quality (PQ) is one of the primary objectives of the modern power system. Among the various phenom- ena responsible of performance degradation, Voltage Sags (VS) defined by IEEE standards 1159-1995 as the reduction in the value of RMS voltage between 0.1 to 0.9 p.u at the power frequency with the duration from 0.5 cycles to 1 min represent one of the most important cau- ses of poor power quality [1]. The main causes of voltage sags are short circuit faults occurring in transmission or distribution systems, transformer energizing, switching of the capacitor banks and starting of large induction mo- tors [2]. Their effects are multiple and change with dif- ferent loads. The case of sensitive house hold loads has been deeply described in [3].
Voltage sags can be symmetric or asymmetric depend- ing on the type of short circuit faults. The majority of faults in power system are single-phase-to-ground faults [4], and consequently result in unbalanced sags. A sym-
metric fault involves all kinds of sequence quantities: po- sitive, negative and zero sequence, whereas voltage sags due to symmetric fault contain only positive sequence quantities. Depending on both the type of faults and the transformer connections between medium voltage and the low voltage, different types of voltage sags can be distinguished. A detailed discussion about the influence of the transformer winding connection on the propaga- tion of voltage sags is presented in [5,6]. The transformer winding (delta/wye) connection used in this network blocks the flow of zero sequence components from the voltage [5]. An extended analysis of voltage sag and their classification has been carried out in [7-9].
Voltage in power system can be unbalanced due to the several reasons. One of the major reasons of voltage un- balance is an uneven distribution of single phase loads that draw unbalanced currents from the system [10,11]. These unbalance currents will create unequal heating in each of the phases which creates unbalance heating in ca- bles and other parts of the network, which might reduce the life time of the cables and other components [12,13]. Another reason for voltage unbalance is due to unbalan- ced faults. The unbalance in the voltage due to this rea- *1) Subject Classification: Smart Grids; 2) All authors are mutually
agreed; 3) It’s the original work of all the authors; 4) We did not submit this manuscript before.
son is severe.
According to European standards, the percent Voltage Unbalance Factor (VUF) is defined by the ratio of the negative sequence voltage to the positive sequence volt- age [14-16].
2 1
%VUF V V 100 (1) where 1 and 2 are the positive and negative
se-quence components of the voltage respectively. Accord-ing to IEEE Std. 1547.2 - 2008 the voltage unbalance factor should be below “2% to 3%”.
V V
The aim of this paper is to investigate how to mitigate unbalanced voltage sags and also voltage unbalance in a CIGRE low voltage distribution network. This is done by using custom power devices: two D-STATCOMs and two BESS-STATCOMs used at different locations of the network.
The paper is organized as follows: Section 2 gives the description of CIGRE LV distribution network, Section 3 presents the description about the control structure; Sec-tion 4 presents the simulaSec-tion results without using con-trollers. Mitigation of the voltage sag and the voltage unbalance for the two cases (i.e. when voltage sag of 42.3% and 43.4% on phase A and phase B of bus R1 and when voltage sag of 13% on phase B of the same bus) is proposed by using appropriate controllers in Section 5. Finally, the conclusion about the paper is presented in Section 6.
2. Description of CIGRE Network
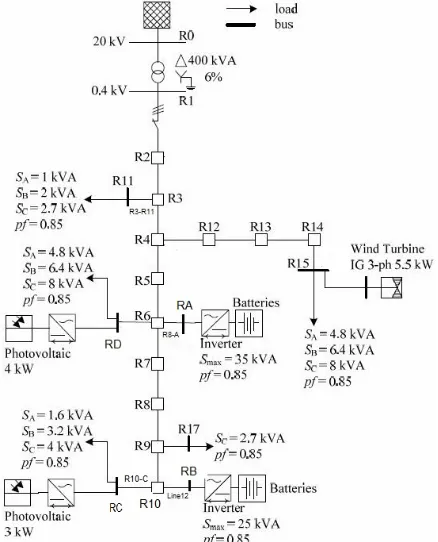
In order to achieve the described goal, a test distribution network set up by CIGRE comprising Wind Turbine Generator (WTG), Photovoltaic (PV) solar generation units, two batteries and STATCOMs comprising Voltage Source Converters (VSCs) at different locations has been chosen for the study [17]. Unbalanced loads are aggre-gated at the 0.4 kV voltage levels and are connected at bus RC, RD, R11, R15 and bus R17. The detailed data concerning bus bars, cables/lines and loads is given in [17]. The Distributed Generation (DG) units are inte-grated into the grid using a delta-wye with neutral (D-YN) transformer used at the beginning of the radial as shown in Figure 1. The neutral of the transformer is grounded with low impedance, Z
0.0032j0.0128
. The [image:2.595.314.533.85.356.2]sin-gle line diagram of this distribution system is shown in Figure 1. The considered network is details are described in [17].
In case of a WTG connected to an unbalanced voltage, the stator currents will be unbalanced. These unbalanced stator currents creates unequal heating in stator winding which might degrade winding insulation and thereby reducing the life time of the stator winding. The impacts of voltage unbalance on WTG’s have been studied in [18]. The impacts of voltage unbalance on PV inverters are studied in [19,20]. The CIGRE network is modeled in
Figure 1. Single line diagram of CIGRE LV distribution system.
DIgSILENT power factory software version 15.0.
3. Description of Control System
The control system developed by the author used for this study is detailed described [21]. A brief introduction of the control system is presented in this paper only. The D-STATCOM controllers for both PV systems have been developed in order to control dc-link and AC voltages by injecting/absorbing active and reactive powers respect- tively [21]. The controllers for the Battery Energy Stor- age Systems (BESS) are developed and are able to char- ge/discharge the batteries at different charging rates. The BESS controllers are developed in such a way that they counteract voltage and frequency disturbances by re- ceiving/delivering active and reactive powers [21]. The inverters of the PV units and battery units are modeled in such a way that they can deliver unbalance currents in order to mitigate unbalanced voltage sags and prevent the problems of the voltage unbalance in the network [21]. The focus in this paper is only on the control of the AC side of thevoltage. The problems of the dc-link voltages on the PV inverters are discussed in [19,21] and charg-ing/ discharging of the batteries are described in [21].
4. Study of the System without Using
Controllers
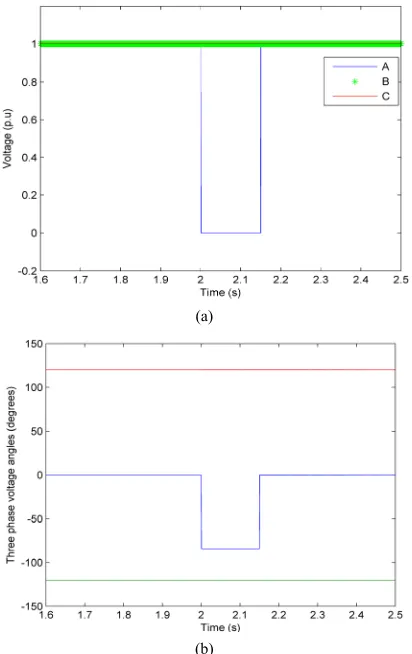
disabled in order to study the impacts of unbalanced loads and unbalanced faults on the voltage in different parts of the low voltage CIGRE network. The voltage un- balance exists from the beginning as unbalanced loads are connected to the network. Next, a single line to ground fault on phase A with a 0 Ω fault impedance is applied at time equal to t = 2 s on the 20 kV Medium Voltage (i.e. R0) bus in order to simulate a case of severe unbalance. The fault is cleared at 2.15 s. The magnitude and phase angle of voltage in the three phases at the bus R0 is shown in Figures 2(a) and (b).
It can be seen that voltage in all three phases of the bus R0 are nearly the same during normal operating condi- tions as there is only minor load unbalance. At time equal to t = 2 s, the voltage in the effected phase becomes zero and the voltage in the other two phases remain nearly the same as shown in Figure 2(a). The results shown in Fig-ure 2(a) are matching with the reference [5,22].
The voltage angles in its three phases on bus R0 are shown in Figure 2(b). It can be seen in Figure 2(b) that the angle of the voltage is changed in the affected phase
(a)
(b)
Figure 2. (a) Voltage in the three phases of the R0 bus for single phase to ground fault on phase A with Ω. (b) Angles of three phase voltages on bus R0 in case L-G fault on phase A with Ω (blue line: phase A, green line: phase B, red line: phase C).
0
f
Z =
0
f
Z =
only, whereas the voltage angles of the healthy phases re- mains unchanged.
The transformation of voltages from primary (i.e. delta) of the transformer to its secondary (i.e. star) is described with the help of Figure 3 [23].
In delta wye configuration of the transformer, the val-ue of phase to neutral voltage on secondary (i.e. shown with colored lines R, Y and B) is equal to that of the line voltage at the primary divided by 3 [24]. The line to line primary voltages are given in “Equation (2)”.
ba b a
cb c b
ac a c
V V V
V V V
V V V
(2)
Putting the values of phase voltages with respect to their phase angles obtained from Figure 2 in “2,” line to line voltages on the primary of the transformer can be calculated.
0 0
0
1 120 0 84
1 120
ba
ba
V V
The voltage Vba on the primary corresponds to the
voltage in phase B on the secondary of the transformer as shown in Figure 3 and is given by VbN Vba 3 which is
equal to 0.578 1200 p.u.
0
0 0
0.999 120 1 120
1.723 90 cb
cb
V
V
The voltage Vcb on the primary corresponds to the
voltage in phase C on secondary of the transformer as shown in Figure 3 and is given by VcN Vcb 3 which is
equal to 0.999 90 0 p.u.
0 0
0 0.999 120 0.999 60
ac ac
[image:3.595.70.276.343.670.2]V V
[image:3.595.308.538.489.707.2]The voltage Vac on the primary corresponds to the
voltage in phase A on the secondary of the transformer as shown in Figure 3 and is given by VaN Vac 3 which is
equal to 0.578 600 p.u.
The voltage in the three phases at the bus R1 is shown in Figure 4. At t = 2 s, the voltage profile on this bus changes as shown in Figure 4.
It can be seen in Figure 4 that there is voltage sag of 42.3% in phase A and 42.4% in phase B on the bus R1. Phase C on this bus is unaffected. A slight difference in voltage sag on phase A and B is due to the slight differ-ence in their loadings. The load on phase B is slight more than the load on phase A, so voltage sag on phase B is slightly deeper than on phase A. When the fault is clear- ed after 150 m s, the voltage in all the phases return to prefault values. The results shown in Figure 4 also match with [5,6,9].
The voltage at different phases on bus RA, RB, RC and Bus RD is shown in Figures 5(a)-(d) respectively. Similar to Figure 4, there is mild unbalance in voltage in normal operating conditions due to unbalanced loads and severe unbalance due to the unbalanced fault.
Table 1 shows the unbalance factor in different parts of CIGRE distribution network under mild and severe unbalance.
It can be seen in Table 1 that there is a mild unbalance due to the unbalanced loads connected on different buses
Figure 4. Voltage on R1 bus (blue line: phase A, green line: phase B, red line: phase C).
Table 1. Unbalance Factors in different parts of network for the two conditions.
Bus No %(VUF) in normal operating conditions %(VUF) during fault
RA 0.45 49.64
RB 0.48 49.6
RC 0.5 49.59
RD 0.43 49.638
R11 0.31 49.66
R15 0.395 49.74
R17 0.55 49.55
(a)
(b)
(c)
(d)
in normal operating condition and severe unbalance in the network grid due to a fault. The difference in the un-balance factor during normal operating conditions is due to different loadings on the buses in the network grid.
5. The Mitigation of Unbalance Voltage Sag
and Voltage Unbalance
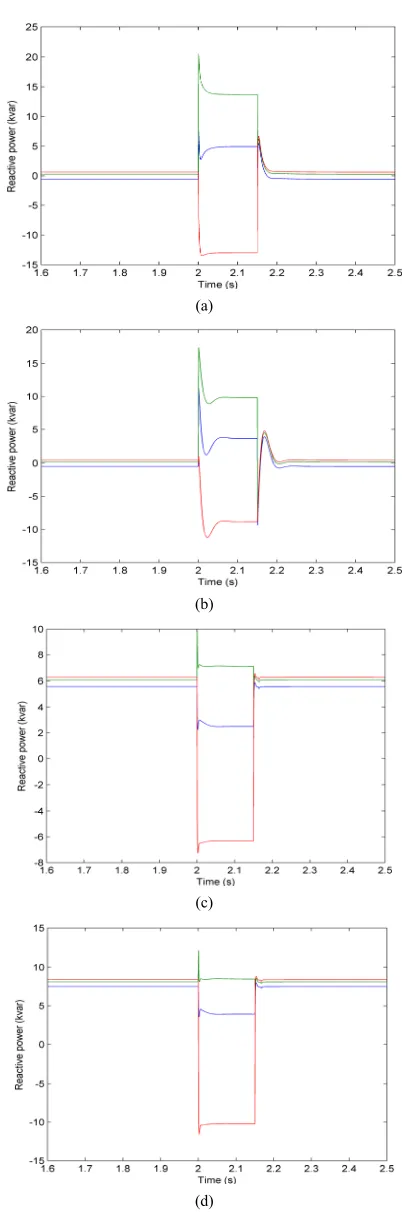
Four STATCOM controllers are used in order to in- ject/absorb the desired amount of reactive power in each of the phases in order to restore the voltage of different phases to permissible limits and mitigate the problems of voltage unbalance. The reactive power injected/absorbed by all of the four VSCs in the three phases of bus RA, RB, RC and bus RD are shown in Figures 6(a)-(d) re-spectively.
Since all four inverters are modeled for voltage regula-tion, they inject or absorb reactive power in different phases of the buses where they are connected. If the voltage of the bus in any of the phase is greater than the voltage of an inverter connected on that bus, the reactive power in that phase is absorbed by the inverter and vice versa [25]. Two of the inverters (i.e. VSC1 and VSC2) are used for battery applications and the other two (VSC3 and VSC4) for the PV units.
The contribution of reactive power from the different converters (i.e. VSC1, VSC2, VSC3 and VSC4) is ac-cording to their rated power. The power and voltage rat-ings of the inverters used in the network are shown in Table. 2. The inverters mentioned in Table 2 can deliver reactive power up to their rated value if they do not inject or absorb active power. The batteries are charged at very slower rates (i.e. 1/100 rate) so that battery inverters can provide maximum amount of reactive power in order to mitigate voltage sags. The PV inverters are also set to deliver maximum amount of reactive power.
[image:5.595.321.522.74.680.2]It can be seen in Figure 6 that reactive power is in-jected in different phases of the bus RA, RB, RC and bus RD in the normal operating conditions in order to reduce the unbalance factor. As shown in Figures 6(a) and (b), VSC1 and VSC2 deliver small amounts of reactive po- wer during steady state condition but inject/absorb maxi- mum amount of reactive power during unbalanced volt- age sag. Since the two phases (i.e. phase A and phase B) have seen voltage sag in the network buses therefore all of the inverters are injecting reactive power in these two phases at t = 2 s as shown in Figure 6.
Table 2. The ratings of the inverters used in the network.
Name of an inverter
Apparent power, S
(kVA) VDC (kV) VAC (kV)
VSC1 35 0.714 0.4
VSC2 25 0.781 0.4
VSC3 18 1 0.4
VSC4 24 1 0.4
(a)
(b)
(c)
(d)
[image:5.595.56.286.661.738.2]The reactive power injected by all of the inverters in phase B is little bit higher than phase A because voltage sag in phase B is little deeper than phase A in all branches. The phase C in all branches has not seen volt age sag so in general there should be no injection of re-active power by the inverters in this phase. But the pur-pose of the controllers developed for this study is not on- ly to mitigate voltage sag but also to compensate against voltage unbalance in the network. Due to this reason the reactive power is absorbed in phase C in order to reduce unbalance factor.
When fault appears in some part of the network, there is an increase in the flow of the currents delivered by the inverters used in the network. The rise of the current in the inverters is controlled by using current limiters so the IGBTs may not damage against over currents. The peaks in the reactive powers of VSC1 and VSC2 in each of the phase as shown in Figures 6(a) and (b) are due to this phenomenon.
It can be seen in Figures 6(c) and (d) that VSC3 and VSC4 are injecting nearly full amount of reactive power in steady state operation in order to meet the line voltage drops and other load unbalances in the network. When the unbalanced voltage sag appears at t = 2 s, the con-trollers do not have enough reactive power to compen-sate for it and hence the distribution system operates in under voltage conditions across these points. Due to this reason the reactive power injected by these controllers in some of the phases decrease further (i.e.Q = VI sinϕ) as seen in Figures 6(c) and (d).
The peaks in Figures 6(c) and (d) at the beginning and at the end of voltage sag are due to the charging and dis-charging of DC-link capacitors in order to maintain DC-link voltage of PV1 and PV2.
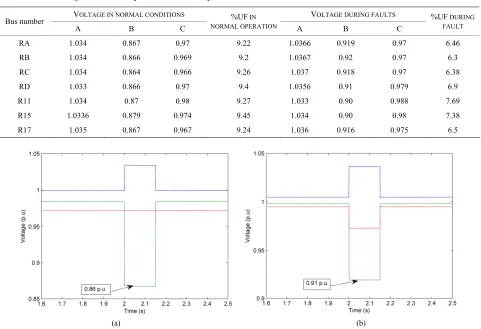
[image:6.595.323.522.335.488.2]The new value of voltage in each of the phases in per unit in different parts on network after using compensa-tion and the voltage unbalance factors in normal and fault periods are shown in Table 3.
Table 3 shows that the controllers to some extent have mitigated the voltage sags in the different phases and have improved the unbalance factors. The unbalance fac- tors in fault conditions are still not within an acceptable range and also the voltages in phase A and phase B are not improved up to the acceptable limits [26] because the converters do not have enough reactive power capacity to mitigate voltage sag and voltage unbalances of such big depth.
To figure out the limit of the converters in relation to the voltage sag depth after voltage sag compensation, a single phase to ground fault on phase A at the R0 bus with a fault impedance of 3 Ω is applied on time equal to t = 2 s. The fault is cleared at 2.15 s. The voltages in the three phases of the R0 bus in this case are shown in Fig-ure 7. It can be seen in Figure 7 that voltage in the
ef-fected phase during the fault is reduced but not equal to zero as in the last case.
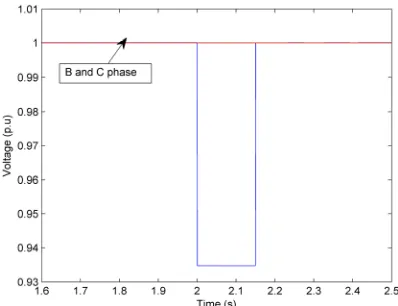
The fault on R0 bus creates unbalanced voltage sags in different parts of the network gird. The transformation of voltage sag from the delta side of the transformer to its wye side is according to Figure 3. The voltages in three phases of bus R1 obtained by using above transformation method in this new case is shown in Figure 8. The val-ues of the voltage during fault in each of the phases have been verified by using (2) and the results are matching with the results shown in Figure 8.
For simplicity the voltage on one of the buses (i.e. bus RA) with and without controllers in this new case is shown in Figures 9(a) and (b). It can be seen in Figure 9(a) that without using controllers phase B of bus RA of the network is less than 90% which is not within a toler-able limit according to IEEE standard 1159-1995 and Danish standards [26]. By using controllers the voltages in all of the phases are restored within the permissible limits of ±10% according to Danish standards.
Figure 7. The voltage in three phases of R0 bus when single phase to ground fault on phase A with Ω. (blue line: phase A, green line: phase B, red line: phase C).
= 3 f Z
[image:6.595.315.530.542.709.2]Table 3. Voltage in different phases in different parts of the network and unbalance factors.
VOLTAGE IN NORMAL CONDITIONS VOLTAGE DURING FAULTS
Bus number
A B C %UF IN NORMAL
OPERATION A B C
%UF
DURING FAULT
RA 1.007 0.9986 0.9949 0.299 0.69 0.54 0.912 33.2
RB 1.0066 0.9991 0.9956 0.32 0.691 0.545 0.9087 32.4
RC 1.0078 0.9982 0.994 0.34 0.68 0.55 0.91 32.55
RD 1.0061 0.9977 0.9936 0.299 0.654 0.56 0.926 35.5
R11 1.0045 0.9976 0.9945 0.22 0.61 0.579 0.95 40.2
R15 1.0052 0.996 0.9904 0.295 0.626 0.57 0.939 38.3
[image:7.595.59.540.242.571.2]R17 1.0077 0.9992 0.992 0.39 0.67 0.56 0.914 33.33
Table 4. Voltages in different phases in different parts of the network with and without controllers and unbalance.
VOLTAGE IN NORMAL CONDITIONS VOLTAGE DURING FAULTS
Bus number
A B C %UF IN
NORMAL OPERATION A B C
%UF DURING FAULT
RA 1.034 0.867 0.97 9.22 1.0366 0.919 0.97 6.46
RB 1.034 0.866 0.969 9.2 1.0367 0.92 0.97 6.3
RC 1.034 0.864 0.966 9.26 1.037 0.918 0.97 6.38
RD 1.033 0.866 0.97 9.4 1.0356 0.91 0.979 6.9
R11 1.034 0.87 0.98 9.27 1.033 0.90 0.988 7.69
R15 1.0336 0.879 0.974 9.45 1.034 0.90 0.98 7.38
R17 1.035 0.867 0.967 9.24 1.036 0.916 0.975 6.5
(a) (b)
Figure 9. (a) Voltage on bus RA without controllers. (b) Voltage on bus RA with controllers. (blue line: phase A, green line: phase B, red line: phase C).
6. Conclusion
It can be seen in Table 4 that voltage in all parts ofnetwork in each of the phases are restored within permis-sible limits and the voltage unbalance during fault are also reduced to a smaller value by using the developed controllers. The controllers have successfully mitigated the unbalanced voltage sags in all parts of the network grid but they are unable to maintain unbalance factor according to IEEE standards 1547.2-2008 during a fault. The only way to restore the unbalance factor according to the standards is to use bigger size of the battery units rather than the existing ones.
in any of the phases. If the depth of the voltage sag in any phase is more than that, the controllers cannot restore the voltage up to the operating limits. By using the exist- ing controllers, the unbalance in voltage has been re-duced to a small value for the case when the voltage sag in one of phases is not more than 13%, but this voltage unbalance is still not in the acceptable limits. This has been verified in simulation results. The compensation of voltage unbalance in the network grid is proposed by using bigger energy storage units rather than existing one. In future work, the controllers will be tested in island conditions as well.
7. Acknowledgements
We are thankful to Kai Strunz for providing the CIGRE test network for LV distribution network. I, Ghullam Mustafa am thankful to Quaid-E-Awam University of Engineering Sciences and Technology, Nawabshah, Sindh, Pakistan for the support and funding.
REFERENCES
[1] IEEE Standard 1159-1995, “IEEE Recommended Prac-tice for Monitoring Electric Power Quality,” IEEE, 1995. [2] H. J. B. Math, I. Y. H. Gu, P. G. V. Axelberg and
E.Styvaktakis, “Classification of Underlying Causes of Power Quality Disturbances: Deterministic versus Statis- tical Methods,” EURASIP Journal on Applied Signal Processing, Vol. 1, 2007, pp. 172-172.
[3] G. G. Karady, S. Saksena and B. Z. Shi, “Effects of Volt- age Sags on House Hold Loads,” IEEE Power Engineer- ing Society General Meeting, Vol. 3, 2005, pp. 2456-
2461.
[4] M. Mc Granaghan, D. R. Mueller and M. Samotyj, “Voltage Sag in Industrial Systems,” IEEE Transactions on Industry Applications, Vol. 29, 1993, pp. 397-403.
http://dx.doi.org/10.1109/28.216550
[5] M. T. Aung and J. V. Milanovic, “The Influence of
Transformer Winding Connections on the Propagation of Voltage Sags,” IEEE Transactions on Power Delivery,
Vol. 21, 2006.
[6] W. R. Mendes, M. I. Samesima and F. A. Moura, “Influ- ence of Power Transformer Winding Connections on the Propagation of Voltage Sags through ElectricSystem,”
Proceedings of the IEEE, 2008, pp. 1-6.
[7] L. D. Zhang and M. H. J. Bollen, “A Method for Charac- terizing Unbalanced Voltage Dips (Sags) with Symmetri- cal Components,” IEEE Power Engineering Review, Vol.
18, No. 7, 1998, pp. 50-52.
http://dx.doi.org/10.1109/MPER.1998.686958
[8] C. Di Perna, P. Verde, A. Sannino, M. H. J. Bollen, “Static Series Compensator for Voltage Dip Mitigation with Zero-Sequence Injection Capability,” 2003 IEEE Bologna Power Tech Conference Proceedings, Bologna, 23-26 June 2003.
[9] R.Teodorescu, M. Liserre and P. Rodríguez, “Grid Syn-
chronization in Three Phase Power Converters,” In: Grid Converters for Photovoltaic and Wind Power Systems,
John Wily & Sons Ltd.,Chichester, 2011, pp. 169-181. [10] A. von Jouanne and B. B. Banerjee, “Voltage Unbalance:
Power Quality Issues, Related Standards and Mitigation Techniques,” Electric Power Research Institute, Palo Alto, EPRI Final Rep, 2000.
[11] Aneel, “Contribution for the Normalization of the Quality of Electric Power-Harmonic and Unbalances in the Elec- tric Networks,” Ph.D. Thesis, Federal University of Uber- landia, 2000.
[12] A. von Jouanne and B. Banerjee, “Assessment of Voltage Unbalance,” IEEE Transactions on Power Delivery, Vol.
16, No. 4, 2001, pp. 782-790.
[13] F. C. Pereira, J. C. de Oliveira, O. C. N. Souto, A. L.A. Vilaca and P. F. Ribeiro, “An Analysis of Costs Related to the Loss of Power Quality,” Proceedings on Harmon- ics and Power Quality, Vol. 2, 1998, pp. 14-16.
[14] V. J. Gosbell, S. Perera and V. Smith, “Voltage Unbal-ance,” Technical Power Quality Center, University of Wollongong, Technical Note No. 6, 2002.
[15] C.-Y. Lee, “Effects of Unbalanced Voltage on the Opera- tion Performance of a Three-Phase Induction Motor,”
IEEE Transactions on Energy Conversion, Vol. 14, No. 2,
1999, pp. 202-208.http://dx.doi.org/10.1109/61.956770 [16] A. I. Maswood, G. Joos, P. D. Ziogas and J. F. Lindsey,
“Problems and Solutions Associated with the Operation of Phase-Controlled Rectifiers under Unbalanced Input Voltage Conditions,”IEEE Transactions on Industry Ap- plications, Vol. 27, 1991, pp. 765-772.
http://dx.doi.org/10.1109/28.85494
[17] Benchmark Systems for Network Integration of Renew- able Energy Resources, Version 7, CIGRE Task Force C6.04.02, 2011.
[18] E. Muljadi, C. P. Butterfield, T. Batan and D. Yildirim, “Understanding the Unbalanced Voltage Problems in Wind Turbine Generation,” National Renewable Energy Laboratory (NREL), 1999.
[19] J. Alonso-Martínez, J. Eloy-García and S. Arnaltes, “Control of a Three-Phase Grid Connected Inverter for Photovoltaic Applications with a Fuzzy MPPT under Un- balanced Conditions,” Proceedings on Power Electronics and Applications, 2009, pp. 1-7.
[20] L. Fan, Z. Miao, and A. Domijan, “Impact of unbalanced grid conditions on PV systems,” IEEE power and energy society general meeting, 2010, pp. 1-6.
[21] G. M. Bhutto, B. Bak-Jensen and P. Mahat, “Modeling of the CIGRE Low Voltage Test Distribution Network and the Development of Appropriate Controllers,” Transac- tions on Smart Grid and Clean Energy, Vol. 2, 2013, pp. 184-191.
[22] D. Das, “Electrical Power System,” New Age Interna- tional (P) Publisher, New Delhi, 2006.
[23] Vector Group of Transformer, Electrical Notes & Articles. http://electricalnotes.wordpress.com/2012/05/23/vector-gr oup-of-transformer.
[25] C. Hochgraf, R. H. Lasseter, “STATCOM Control for Operation with Unbalanced Voltages,” IEEE Transac- tions on Power Delivery, Vol. 13, 1998, pp. 538-544.
http://dx.doi.org/10.1109/61.660926