812
ZINC COATING THICKNESS QUALITY CONTROL OF ANGLE STEEL
TOWER MATERIALS BASED ON STATISTICAL METHOD
1
JITAO FANG, 2HUI WANG, 3WEIWEI DENG
1Department of Mechanical Engineering, University of Jinan, Jinan 250022, Shandong, China
2Department of Mechanical Engineering, University of Jinan, Jinan 250022, Shandong, China
3
China National Heavy Duty Truck Group, Jinan 250031, Shandong, China
ABSTRACT
As an important quality index of high voltage electricity transmission tower, zinc coating thickness detection and quality control is more and more attention in recent years. The coating thickness and uniformity of tower materials provided by the suppliers are tested through the traditional method by the power department, the detection precision of this method is low efficiency and analysis results is not returned objectively to help superior evaluation. In this paper, zinc coating thickness detection and quality control system of tower materials based on statistical method are developed, through coating thickness and uniformity tested, the test results are returned to the competent department timely, the analysis of test data is completed automatically by this system. Therefore the zinc coating quality of the tower materials caused safety issues is avoided effectively and contributed to superior evaluation reasonably.
Keywords: Angle Steel Tower Material, Zinc Coating Thickness Detection, Quality Control, Statistical
Method, Supplier Evaluation
1. INTRODUCTION
With the rapid development of national economy and National Grid, high voltage electricity transmission angle steel towers are needed urgently in national power grid and information industry construction. More and more supplier appears which could provide angle steel tower. The quality of angle steel tower is very important, is the safety guarantee of National Grid. Tower materials detection and quality control is more and more attention in recent years. Because the angle steel tower which is good or bad is decided by tower materials. The zinc coating thickness and uniformity of tower materials is very important index for quality control of steel tower. Because steel tower often be placed in the wild, so corrosion resistance of steel tower must be have, therefore the zinc coating thickness and uniformity of tower materials is the quality guarantee of steel tower, and is the safety guarantee of National Grid.
In the last few years, as the plating thickness uneven, tower materials are corroded and waste seriously, so the tower of galvanized layer thickness material and uniformity which supplied by suppliers are tested. At present the tower of material coating thickness and uniformity provided by the suppliers are tested through the traditional method [1], for example the thickness of tower materials is
tested by thickness measuring instrument and the result data is recorded on the paper, the quality of zinc coating thickness is judged by testing personnel subjectively, and the uniformity of tower materials zinc coating is tested by copper sulfate testing, which is put tower materials in the copper sulfate solution repeat four times, if the zinc coating of tower materials does not appear the phenomenon of show iron, so we could judge that the uniformity of tower materials zinc coating is qualified [2]. Although there are many studies on quality control of tower materials there are still many problems have not been satisfactorily resolved. For example the detection precision of this method is low efficiency and analysis result is not returned objectively to help superior evaluation, the quality control of zinc coating thickness and uniformity is difficulty by the existing method.
ISSN: 1992-8645 www.jatit.org E-ISSN: 1817-3195
813 storage and so on, the coating thickness gauge of QNix8500 is purchased for measuring galvanized layer thickness of tower materials [3]. Taking galvanized layer thickness and uniformity of angle steel tower materials as an test object, according to the principle of control chart,control charts which suitable for galvanized layer thickness and uniformity of tower materials are selected. Reference standards and combined with the actual situation of layer detection of angle steel tower materials. When acquisition data of galvanized layer thickness of tower materials, the position and number of measuring point are made based on the engineering requirements. When acquisition data of galvanized layer uniformity thickness of tower materials, the position and number of measuring point are made based on the pitch method and simplified m fonts of measuring principles. The structure of galvanized layer detection and quality control system of tower materials is established, the function of each module and the operation process of the system are analyzed, galvanized layer detection and quality control system of tower materials is devised and statistical process control is used. Therefore the zinc coating quality of the tower materials caused safety issues is avoided effectively and contributed to superior evaluation reasonably.
2. QUALITY CONTROL OF ZINC
COATING THICKNESS AND
UNIFORMITY
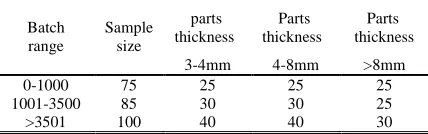
The thickness values of zinc coating pieces are divided three types: from three to four micrometers, from four to eight micrometers and more than equal to eight micrometers. In order to evaluate each supplier, the plating piece which checked should be covered different thickness values. Table 1 is the scheme standard of the plating thickness of angle steel tower materials.
2.1 Quality Control of Zinc Coating Thickness The test requirement of the coating thickness of angle steel plating pieces as follows, each plating piece is checked 12 points [5], plating thickness values in the range of three to four micrometers, measured values of coating local thickness are not less than 45µ m and measured values of coating average thickness are not less than 55µ m, plating thickness values in the range of four to eight micrometers, measured values of coating local thickness are not less than 55µm and measured values of coating average thickness are not less than 75µm, plating thickness values which are more than equal to 8 micrometers, measured values of coating
[image:2.612.311.525.161.228.2]local thickness are not less than 70µm and measured values of coating average thickness are not less than 85µ m.
Table 1: The Scheme Standard Of Zinc Coating Thickness Of Angle Steel Tower (Unit: Piece)
Batch range
Sample size
parts thickness
Parts thickness
Parts thickness
3-4mm 4-8mm >8mm
0-1000 75 25 25 25
1001-3500 85 30 30 25
>3501 100 40 40 30
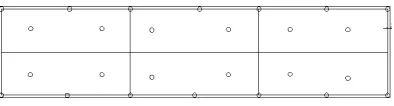
Each plating piece which is selected is checked 12 points. The distribution of 12 points in the plating piece is shown in figure. 1.The distribution of 12 points is designed based on uniform distribution method, for better reflect the thickness situation of zinc coating. Measured values of coating local thickness are arithmetic average value that the 12 points of each plating piece which checked, measured values of coating average thickness are arithmetic average value that coating local thickness of some coating thickness of plating pieces. If average value could meet the standard of zinc coating thickness of angle steel, then the quality of zinc coating thickness is qualified would be determined by inspection personnel.
Figure 1: The Distribution Of 12 Points In Plating Piece
Although the result of testing could be determined by the above method, but the detailed evaluation of superior is difficult to achieve. So zinc coating thickness detection and quality control of tower materials based on statistical method are put forward. In order to better reflect the capability of suppliers, through the statistical analysis of data which is checked, process capability index could be calculated. It is a widely used capability index for process capability studies. It may range in value from zero to infinity with a larger value indicating a more capable process. CPwill be used for the evaluation of supplier capability. Because the standard of zinc coating thickness only has the lower requirements, so the unilateral lower limit calculation formulaCPL is used. It can be expressed by the following equation.
σ
σ 3ˆ
3
L L PL
T x T u
814 Where u is the theory of mean value, x is the actual of mean value, and TLis the unilateral lower
limit value. σˆ is the value of standard deviation. At
the same time according to the calculated statistical data, the histogram will be designed out. The change trend of zinc coating thickness could be reflected intuitively.
2.2 Uniformity Control of Coating Thickness Uniformity control of zinc coating thickness is a very important inspection item for quality control of steel tower. The traditional uniformity control method of tower materials zinc coating is tested by copper sulfate testing, which is put tower materials in the copper sulfate solution repeat four times, if the zinc coating of tower materials does not appear the phenomenon of show iron, so we could judge that the uniformity of tower materials zinc coating is qualified. The thinnest point of tower materials could be found effectively by this method, but the uniformity could not be reflected effectively. So the new idea of distribution points and statistical analysis method are put forward. The zinc coating uniformity of the tower materials caused safety issues is avoided effectively and contributed to superior evaluation reasonably. The check scheme of plating uniformity and the distribution of points and statistical analysis method are introduced in the following content.
Table 2 : The Scheme Standard Of Zinc Coating Uniformity Of Angle Steel Tower (Unit: Piece)
Piece length
Sample size
Judgment array
Ac Re
0-3m 3 0 1
3m-5m 3 0 1
5m-8m 2 0 1
Check scheme of plating uniformity is shown in table. 2 [6]. As the length values of plating pieces are divided three types: from zero to three meters, from three to five meters and from five to eight meters. In order to evaluate each supplier, in the processing of checking, each length value of plating piece is checked three. The tower materials is put tower materials in the copper sulfate solution repeat four times, if the zinc coating of tower materials does not appear the phenomenon of show iron, so we could judge that the uniformity of tower materials zinc coating is qualified. If the plating coating uniformity of the three plating pieces are qualified, so the plating coating uniformity of this batch of plating pieces are qualified.
Although the result of testing could be determined by the above method, but the detailed
[image:3.612.320.517.243.296.2]evaluation of superior is difficult to achieve. So zinc coating thickness uniformity control of tower materials based on statistical method is put forward. In order to better reflect the capability of suppliers, through the statistical analysis of data which is checked, the statistical process control chart could be used. Combined uniformity judgment needs, the individual and moving range control chart (x−Rs) is used [7]. First the distribution of points which are checked is designed, each plating piece which checked is measured several points, the distribution of points in the plating piece is shown in Figure. 2.
Figure 2: The Distribution Of Points In Plating Piece For Uniformity Control
The test requirement of the coating thickness uniformity of angle steel plating pieces as follows, each plating piece which checked is measured several points, then these points of each plating piece are drawled the control chart , by judging the situation of the point on the chart, the coating thickness uniformity of plating each piece is analyzed. According to the length values of plating pieces are divided three types: from zero to three meters, from three to five meters and from five to eight meters. In order to the points which checked can be reflected the thickness uniformity of all plating pieces of angle steel, different lengths of the angle steel should be measured different points. Based on the method of pitch and principle of measuring meters fonts, it concludes that the length values of angle steel plating pieces which are from zero to three meters are measured 36 points and the length values of angle steel plating pieces which are from three to five meters are measured 48 points and the length values of angle steel plating pieces which are from five to eight meters are measured 52 points.
ISSN: 1992-8645 www.jatit.org E-ISSN: 1817-3195
815 to use, and has to find as soon as possible and to judge the abnormal production of the characteristics. Moving range Rs control chart is to use quality characteristic data deviation to reflect and control the product quality characteristics of discrete degree, moving range is defined adjacent the two observation data difference absolute value, therefore, can be seen as a capacity of two the sample range.
The x control chart control limits can be expressed by the following equation
− = = = + =
∑
= δ δ s n i i s R x LCL x n x CL R x UCL 3 1 3 1 (2)Where x is tactual of mean value,
∑
=
= N
i
x
iN x
1
1 , and
σˆ is the value of standard deviation,
( )
1 1 2 − = ∑= − N i Ni x x
δ ,
s
R is moving range of mean value, =
∑
Rn
Rs S
1 .
Moving range Rs is defined adjacent the two observation data difference absolute value, therefore, can be seen as a capacity of two the sample range. Single value x control chart is to use the quality characteristics of individual samples directly to the production of numerical control, without going through the tedious calculation, easy to use, and has to find as soon as possible and to judge the abnormal production of the characteristics.
The s
R control chart control limits can be expressed by the following equation
= = = =
∑
= s n i s s s R D LCL R N R CL R D UCL 3 1 4 1 (3)Where D4andD3is the coefficient of the above
formula, R D S R δ 3 1
4= +
, R R D S δ 3 1
3= −
. Under normal
circumstances,
4
D and D3 Can be found in the
coefficient table [8].
The Moving range Rs control chart is to use quality characteristic data deviation to reflect and control the product quality characteristics of discrete degree, moving range is defined adjacent the two observation data difference absolute value. To sum up, the individual and moving range control chart ( x−Rs ) is used for the evaluation of uniformity. It can well reflect the uniformity of zinc coating thickness. Application of x−Rscontrol chart will be introduced in the following chapters.
3. THE DEVELOPMENT OF QUALITY
CONTROL SYSTEM
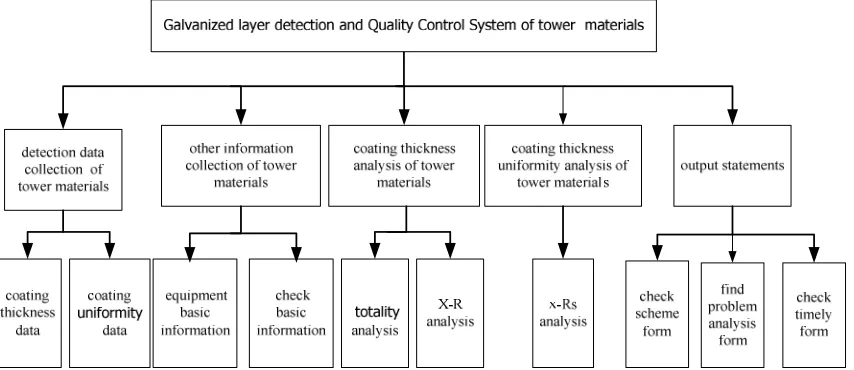
[image:4.612.96.523.536.721.2]In this section, the quality control system of zinc coating thickness and uniformity is developed in the development environment of c# and SQL server database. The system is developed and used, could improve the detection efficiency and accuracy, could realize the power grid construction department purchase quality monitoring and information management. The system is used to evaluation of superiors too. The structure model of the system which called coating thickness inspection of tower materials and quality control is shown in figure. 3.
816 (1) Detection Data Acquisition of Tower Materials: The analysis data of coating thickness and uniformity of tower materials which are imported in excel from the gauge are storied in the designated database. Coating thickness of tower materials are measured by the coating thickness gauge of QNix8500 produced in German in the article.
(2)Other Information Collection of Tower Materials: Other information acquisition module are included the equipment basic information and the check basic information and, which are prepared for output statements and are submitted to the specified database before checking.
(3) Coating Thickness Analysis of Tower Materials: The data which collected from angle steel tower of some thickness is drawled on the histogram chart, by judging the situation of the points on the chart, the coating thickness of plating pieces are analyzed. At the same time, CPL is calculated for the evaluation of supplier capability.
(4) Coating Thickness Uniformity Analysis of Tower Materials: The data which collected from plating piece is drawled on the control chart of
Rs
x− , by judging the situation of the point on the chart, the coating thickness uniformity of plating each piece are analyzed.
(5) Output Statements: Analysis results of coating thickness and uniformity of tower materials are output in the form of statements and printed in PDF format.
4. CASE ANALYSIS
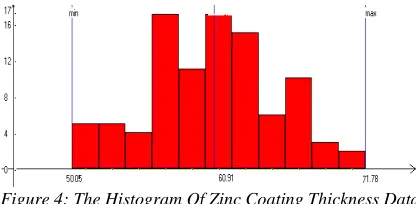
Taking someone supplier which provides a batch of (800 pieces) angle steel tower materials to power departments as an example, figure 4 is the histogram chart which the thickness value are from three to four millimeters of the selected twenty-five plating pieces, figure 5 and figure 6 is thex−Rs control chart which the long values are from zero to three meters of the selected three plating piece, figure.7 is the check conclusion.
4.1 Analysis of Zinc Coating Thickness
[image:5.612.315.519.95.234.2]In above case, a batch of angle steel tower materials has 800 pieces, according to table. 1, 25 plating pieces must be selected from 800 pieces, which the thickness value are from three to four millimeters of plating pieces. Each plating pieces is checked 12 points, and check data is stored in the system database, Check data of plating thickness is shown in table 3.
Table.3: The Check Data Of Plating Thickness
sample 1 2 3 4 … 12
1 71.3 62.5 60.6 60.8 … 59.3
2 54.1 66.3 63.5 59.2 … 56.4
3 69.6 54.6 55.0 52.5 … 62.5
4 56.4 52.6 49.1 64.2 … 52.6
5 62.5 52.0 63.6 63.4 … 57.8
6 64.1 59.7 58.1 68.0 … 65.6
7 63.4 55.8 56.1 53.9 … 60.3
8 61.0 57.4 62.2 65.6 … 61.8
9 71.3 55.6 50.1 55.0 … 59.0
…. … ..… … … … …
25 65.4 62.5 54.6 60.7 … 57.8
Because the standard of zinc coating thickness only has the lower requirements, so the unilateral lower limit calculation formula
PL
C is used. According to Check data of plating thickness in table 3, it can be calculated by the following equation.
57 . 1 1 . 1 * 3
55 2 . 60 ˆ
3 =
− = − =
σL
PL T x C
According to the judging standard of process capability index,
PL
[image:5.612.313.521.470.572.2]C is equal to 1.57, we can judge the ability of the supplier is to meet the requirements. Therefore, according to the value ofCPL, the supplier level can be graded reasonably. At the same time according to the calculated statistical data, the histogram will be designed out. The change trend of zinc coating thickness could be reflected intuitively.
Figure 4: The Histogram Of Zinc Coating Thickness Data
ISSN: 1992-8645 www.jatit.org E-ISSN: 1817-3195
817 data reasonably can be judged from the histogram chart.
4.2 Analysis of Zinc Coating Uniformity
In above case, a batch of angle steel tower materials has 800 pieces, according to table. 2, three plating pieces must be selected from 800 pieces, which the long value are from zero to three meters of plating pieces. Each plating pieces is checked 36 points, the distribution of points in the plating piece is shown in figure. 2, and check data is stored in the system database, Check data of plating thickness is shown in table. 4.
Table 4 : The Check Data Of Plating Uniformity
sample 1 2 3 4 … 36
1 63.4 55..8 56.1 53.9 … 60.3
2 65.4 62.5 54.6 60.7 … 57.8
3 62.5 52..0 63.6 63.4 … 57.8
According to Check data of plating thickness in Tab. 4, the x−Rscontrol chart can be designed by the quality control system. The x control chart control limits can be expressed by the following fig.5. The
S
[image:6.612.316.524.75.222.2]R control chart control limits can be expressed by the following figure.6.
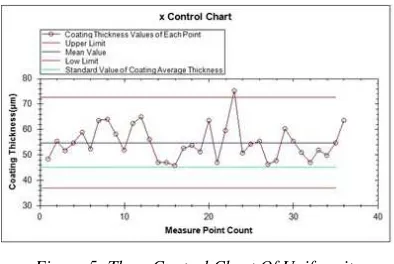
Figure 5: The xControl Chart Of Uniformity
From the x control chart of figure.5, as it can be seen from the distribution trend of the 36 points drawled on the chart, the mean values line of the 36 points which selected one angle steel tower piece are greater than the local thickness standard values, in the 36 points, only one point is not felled in the control limits. It can be seen from the judgement standard of the uniformity of the plating thickness, the uniformity is qualified.
Figure 6: The
S
R Control Chart Of Uniformity
From the S
R control chart of figure.6, by judging the situation of the 35 points on the chart, it is concluded that the 35 points are between the upper limit and the low limit and the wave of coating local thickness is normal.
At this time, the check conclusion of this case can be sum up. The measured value of coating average thickness is 55.7um, the requirements of the standard can be meet. According to the judging standard of process capability index, CPL is equal to 1.57, we can judge the ability of the supplier is to meet the requirements. From the x−Rs control chart and the judgement uniformity standard of plating thickness, the uniformity is qualified. So the thickness and uniformity values which are from three to four millimeters of the selected angle steel plating pieces are qualified.
5. CONCLUSION
The coating thickness and uniformity of tower materials are tested through the traditional method by the power department, the detection precision of this method is low efficiency and analysis results is not returned objectively to help superior evaluation. In this paper, zinc coating thickness detection and quality control system of tower materials based on statistical method are developed, through coating thickness and uniformity tested the test results are returned to the competent department timely, the analysis of test data is completed automatically by this system. Therefore the zinc coating quality of the tower materials caused safety issues is avoided effectively and contributed to superior evaluation reasonably.
ACKNOWLEDGEMENTS
[image:6.612.96.293.390.522.2]818 REFERENCES:
[1] TOHMYOH H, SUZUKI M. “Measurement of the coating thickness on the back side of double-sided coated structures by means of acoustic resonant spectroscopy”, Surface &
Coating Technology, Vol. 20, No. 4, 2009, pp.
85-91.
[2] Christian Petrilli. “The Basis of Coating Thickness Measurement”, Testing and Control, Vol. 17, No. 8, 2001, pp. 8-13.
[3] LIANG Jun, QIANG Ji Xin. “Multivariate statistical process monitoring and control: recent developments and applications to chemical industry”, Information Science, Vol. 11, No. 2, 2003, pp. 191-203.
[4] HAEKINS D M. “Self starting cusum charts for location and scale”, The Statistician, Vol.36, No. 23, 1997, pp. 299-315.
[5] Sevil Senturk, Nihal Erginel. “Development of fuzzy X− − R− and
− −
− S
X control charts using
α
-cuts”, Information Science, Vol.16, No.9, 2008, pp. 1-10.[6] SIMOGLOU A, MARTIN E B, MORRTS A J. “Multivariate statistical process control of an industrial fluidized-bed reactor”, Control Engineering Practice, Vol.8, No.8, 2000, pp.
893-909.
[7] Chan, L. K. Cheng, S. “A new measure of process capability: Cpm”, Journal of Quality
Technology, Vol.20, No.3, 2008, pp.162-175.
[8] M. Barletta, A. Gisario, S. Guarino. “Modelling of electrostatic fluidized bed (EFB) coating process using artificial neural networks”,
Engineering Applications of Artificial
Intelligence, Vol.20, No.6, 2007, pp.132-145.
[9] R. N. Vogt, M. N. Orr, J. R. Schifko. “Coating uniformity and device applicability of spin coated sol-gel PZT films”, Microelectronic
Engineering, Vol.29, No.4, 2005, pp.122-131.
[10] Zhou Chunguang, Zou Changliang, Wang Zhaojun. “Control chart based on the wavelet for the preliminary analysis”, Journal of
Applied Probability and Statistics, Vol.24, No.3,
2008, pp.274-288.
[11] Zhang Jiujun, Li Zhonghua. “A new adaptive control chart for monitoring process mean and variability”, Journal of Advanced Manufacturing Technology, Vol.60, No.9, 2012,