ISSN: 1992-8645 www.jatit.org E-ISSN: 1817-3195
PERFORMANCE MEASUREMENT OF PROJECT
MANAGEMENT BY USING FANP BALANCED SCORECARD
1HERMAWAN, 2AHMAD FAUZI, 3MOHAMMAD ANSHARI
1,2
Departement Of Information Technology, Faculty of Engineering Trunojoyo University of Madura, Indonesia
3
Departement Of Information Technology, Faculty of Science University Brunei Darussalam, Brunei
E-mail: [email protected], [email protected], 3 [email protected]
ABSTRACT
The Project management (PM) is the implementation of knowledge, processes, tools, and techniques which is needed to manage business processes to create unique product or service. The PM has complexly business process, for monitoring performance of all PM activity be completely and align with business strategy is needed high effort. For this reason, we propose method to measure project performance by using Balanced ScoreCard (BSC) strategy, where keys performance source of BSC is produced by Project Integration Management (PIM). Where the PIM is one of the domains in PM to consolidate other domains activities, they are cost, time, procurement, communication, and also risk management. Inorder to compute Key Performance Indicator (KPI) in many perspective quadrants of BSC, we need computation method to measure priority and weighting value of PIM performance, on this study we use Fuzzy Analytical Network Processing (FANP) to measure qualitative and quantitave by comparing weighting priority between many KPI’s in BSC. Furthermore in testing phase, we use data from The SAP Rollout Project in PT. Semen Indonesia Tbk., where from the final result we acquired weighting priority in many perspectives of BSC quadrants to support decission support system for this project. From this study, we have significant contribution to determining strategy to assessment KPI’s in BSC perspectives from the PM based on The Project Management Body Of Knowledge (PMBOK), and method to implement FANP to measure weighting priority for this KPI’s by modify input methode from quantitative values to qualitative grades.
Keywords: Project Management(PM), Project Integration Management(PIM), Balanced Scorecard(BSC), Fuzzy Analytic Network Process (FANP), Decission Support System (DSS)
1. INTRODUCTION
Today, business environment is highly volatile due to uncertainty condition, Therefore many companies are required to be competitively and efficiently in managing they resources. For this reason, many companies prefer to use temporary base resources. Project management business process is being adopted for enterprise resource management, within based on a temporary endeavour designed to produce a product or service that is specific and unique[1].
In our previous study, we have built enterprise management based on project management within prefer to Project Management
Body Of Knowledge (PMBOK) methodology.
PMBOK provides overall knowledge and methodologies to integrate, plan, execute, monitor
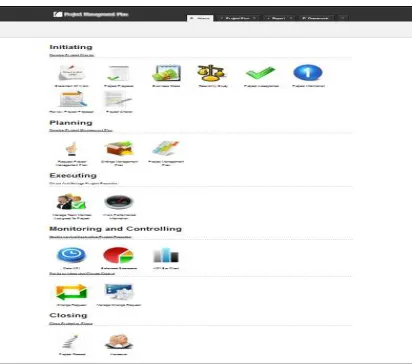
and complete a project management cycle. it is shown in the Figure 1, that the enterprise software for project management within adopted the PMBOK methodology [2].
On the IT implementation, enterprise information system does not just applied to operational data transactions, but it has also the capacity to do the measurement of the performance of business informations that have been carried out. Through the integration of new technologies, processes and business environments into decision support paradigm, it can be enable to improve performance. The Integrated Decision Support
System (IDSS) have been expanded and upgraded to
fulfill these requirement[3].
ISSN: 1992-8645 www.jatit.org E-ISSN: 1817-3195
[image:2.612.90.298.177.359.2]viewpoints as well as stakeholder benefits (e.g., customer satisfaction), product benefits(competitive advantage, financial rewards) and the future impact of the company's (value, personal growth, etc.) [4], and the multi-dimensional measurement implemented of the Balanced Scorecard strategy approach (Kaplan and Norton, 1990).
Figure 1: Enterprise Software for project management
based on PMBOK methodology [2]
By the using of BSC, it needs a method for measuring the weighting priority, where many studies has done to apply any various methodology, such as:
1. By the using of multicriteria decision
aiding methodology constructivist
(MCDA-C) method, Tadeu combine qualitative and quantitative measurements to support decision makers, which apply the model to guide the search for actions in order to select and prioritize projects put forward by managers [5].
2. The using of Hierarchy Analytical Processing (AHP) as well as used in the measurement of the complexity and quality of project implementation with qualitative approach by Vidal, it is able to highlight project complexity sources when building up the global complexity scale and the subscales [6].
3. In particularly, through an emphasis on measuring performance quantitatively, which used statistic approach of Principal
Component Analysis (PCA), Zaver
implemented it to determine the priority of
stages and activities, that have dominant influence on the project works [7].
Form the methods that have been studied yet there is gap for a comprehensive performance measurement by combining quantitative and qualitative measurements, especially in determining weighting priorities for KPI’s in the BSC strategy. Therefore this study proposes an integrated method for qualitative and quantitative measurements on KPI's BSC by using FANP. Furthermore the assessment to extracting of many source value of KPI‘s is adopting the international standardization of business process of project management, based on framework of PMBOK methodology, while in definitive scope only use one of Risk domain knowledge that is implemented by Goldy for maintenance policy selection in industrial unit, based on risk modeling assessment [8].
2. METHODOLOGY
2.1 Project Integration Management (PIM)
According to the PMBOK business process, performance measurement is integrated through the integration process within the PIM [1]. It is intended to direct and control in focus individual process that is monitored by the project manager to keep in accordance with the project planning. Which in practice, KPI’s measurement is doing on the Monitoring and Controlling Project Work activity.
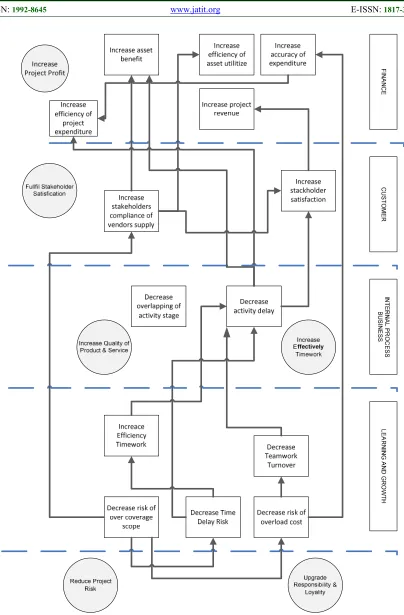
As shown in the context diagram at Figure 8 (in the supplement page), the mapping strategy of KPI’s objectives in accordance with the BSC perspective. From the each KPI’s also needs assessment of data source and formula for calculate many data transaction, which data sources are collected by PIM from others project management domains such as cost, time, procurement, communication, and risk management as shown in Table 5 (in the supplement page). This concept have been compared with other way assessment by using the value management approach [8].
2.2 FANP Qualitative and Quantitative measurement
ISSN: 1992-8645 www.jatit.org E-ISSN: 1817-3195
generalization of AHP, when using ANP method although it has been able to deal with problems that have sub-criteria, but the ANP still has not been able to handle qualitative assessment. Whereas in this case, the representation of the balanced scorecard KPI assessment is not only oriented to quantitative weighting, but also to qualitative which is represented as linguistically scale. Therefore, FANP was able to solve a decision other than the quantitative aspect as well as in qualitative form.
FANP method is extension of AHP and ANP priority method within Fuzzy logic weighting method. FANP was represented by Triangular Fuzzy Number (TFN) value Chang[9]. Where the left point, right point, and the midpoint of the linguistically variables are stretched for measuring the performance of the best alternative in every TFN criteria [10]. As Multicriteria Decision Making (MCDM), this method still can combined by other methods like TOPSIS [11]. In FANP, Extend Analysis is used to evaluate relatively criteria and also sub criteria power between fuzzy of pair wise of KPI’s.
[image:3.612.313.523.82.155.2]While the data sources from KPI’s is in quantitative value of the data transactions, we need to normalize them into qualitative grades, it is shown in Table 1. Where as one way to give qualitative grades by simple ABCDE, this method can also used to give qualitative output comparation as well as ABC grades[12].
Table 1: Conversion KPI’s From Quantitative Value Into Qualitative Grades.
KPI Grade
KPI>=0.85 A
0.85>KPI>=0.75 B 0.75>KPI>=0.65 C 0.65>KPI>=0.45 D
KPI<0.45 E
[image:3.612.321.519.219.598.2]To perform pair wise of weighting priority of KPI’s dependence between criteria and sub criteria in inner dependence, the grade levels converted to the weighting priority level with AHP evaluation 1 to 9 in odd numbers, it is shown in Table 2. This method is objectively than commonly by using quiz evaluation from stakeholders opinion. Its justification is shown in Table 3.
Table 3: Comparation Of KPI’s Pair Wise Priority Weighting
\ A B C D E
A 1 3 5 7 9
B 1/3 1 3 5 7
C 1/5 1/3 1 3 5
D 1/7 1/5 1/3 1 3 E 1/9 1/7 1/5 1/3 1
Table 3: Qualitative definition of KPI’s priority
weighting.
Weight Definition
1 Both KPI are equal important 3 One KPI moderat important than other 5 One KPI stronger important than other 7 One KPI very stronger than other 9 One KPI extreme stronger than other
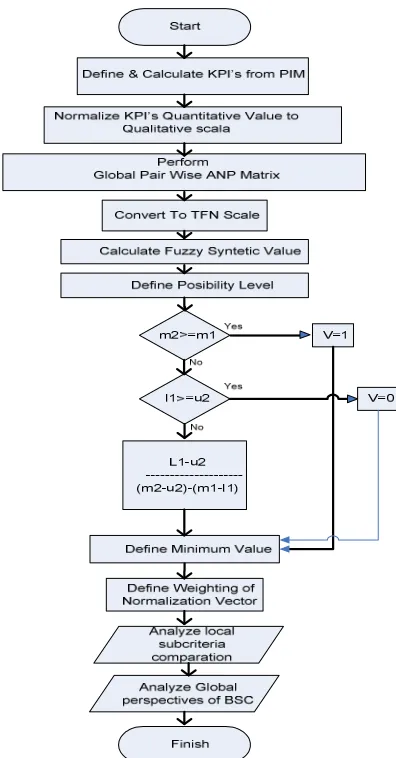
In next stages, we manage the data according to the standard FANP, where the complete process of FANP in BSC perspective is shown in flowchart at Figure 2.
Figure 2: Flowchart of FANP-BSC Process[10]
3. RESULT and DISCUSS
[image:3.612.138.252.462.532.2]ISSN: 1992-8645 www.jatit.org E-ISSN: 1817-3195
contained in the Finance, while the weakest performance is found in the Customer.
Table 4: Evaluation of weighting priority on KPI’s of BSC perspectives by using FANP
Criteria of
Perspective Sub Criteria Weight
Weight
Type Total
Financial ROA 0.0 0.00 +
0.66
CPI 0.40 0.26 +
TATO 0.20 0.14 +
SPI 0.40 0.26 +
0.66 ROE 0.0 0.00 +
Internal Business
Process POD 1 0.23
-
0.23
0.23 POMS 0 0.00 -
Learning
Growth ET 0.00 0.00
-
0.11
PLT 0.00 0.01 -
POCR 0.36 0.04 -
POTR 0.39 0.04 -
0.11 POSR 0.25 0.02 -
Customer CS 0.50 0.00 -
0.00
0.00 NOMV 0.50 0.00 +
Figure 3: Graph of BSC Multi-Perspective Performance
[image:4.612.84.523.39.706.2]3.1.Financial Perspective
Figure 4. KPI performance in the BSC Financial Perspective
Table 5. Performance Evaluation of Financial Perspective
KPI Value Validation
ROA 0 The project has not been able to deliver financial profits appropriated with the asset utilization CPI 0,26 The project was able to
perform products and services appropriated with expenditure cost
TATO 0,14 The project was able to use assets efficiently
SPI 0,26 Project defrayal appropriated with activity workbase
ROE 0 The project has not been able to deliver financial revenue
3.2.Internal Process
Perspective
Figure 5: KPI performance in BSC Internal Process Perspective
Table 6. Performance Evaluation of Internal Process Perspective
KPI Value Validation
POD 0.23 Many delay occurs over works activity
POMS 0.00 Sequence of activities is agree with workbase
3.3. Learning and Growth Perspective
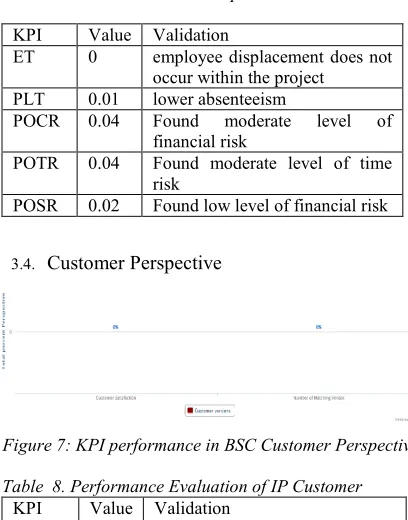
[image:4.612.93.298.587.694.2]ISSN: 1992-8645 www.jatit.org E-ISSN: 1817-3195
Table 7. Performance Evaluation of Learning and Growth Perspective
3.4. Customer Perspective
Figure 7: KPI performance in BSC Customer Perspective
Table 8. Performance Evaluation of IP Customer
KPI Value Validation
CS 0 Yet ready customer services NOMV 0 Yet vendors complain
Within finance performance achieve over 66%, So it can be concluded that the implementation of the SAP project at PT. Semen Indonesia Tbk. focuses on the perspective of Finance, where indicated the high priority of the using of capital and assets, but the direct profits of the products is still low, because The SAP products and its services is products and services that is consumed for internal needs and not be a commercial product for sale to external customer.
Furthermore on the Internal business reached 23% at a moderate rate where workbases planning and activities are well defined, but in practically are still have a high level of delay. While on the learning and growth 10.76%, shows the activity of socialization and technical support is still low but in execution is prevalently on all areas. And the last indicated to service customer stakeholder value 0%, because this project is an internal project, so the customer is only internal managerial PT. Semen Indonesia Tbk., and there a complaint against the service management of external stakeholders is still yet. Results of performance of the balanced scorecard analysis on this study, furthermore can be used as a preference in knowledge management system[13], which determining the strategic policy for TheDecision Support System [14].
4. CONCLUSION
The results of this study concluded, The BSC analyzing can develop strategy model to measure performance from multi domain perspective of project management, which used to support any stakeholders especially project managers that are involve in the project management to manage and improve quality of project business processes.
5. RELATED WORKS
Furthermore, to increase capability of this information system, we need to develop knowledge management system to support the IDSS.
REFRENCES:
[1] R.Duncan Wiliam, “A Guide To The Project Management Body of Knowledge PMBOK 4” [Book]. - Canada : PMBOK, 2008.
[2] Hermawan, Riyanarto Sarno, “Developing Distributed System with Service Resource Oriented Architecture”, TELKOMNIKA, Vol.10, No.2, June 2012, pp. 389-399.
[3] Shaofeng Liu et al., Integration of decision support systems to improve decision support performance, Springer-Verlag London feb. 2009.
[4] Corlane Barclay, ”Towards an integrated measurement of IS project performance: The project performance scorecard”, ACM Journal Information Systems Frontiers Vol. 10, Issue 3, July 2008, pp. 331-345.
[5] Rogério Tadeu et al., “A Performance Measurement Framework in Portfolio Management: A constructivist case”, Journal of Management History, Vol. 49, Issue 4, Toronto Canada (2012).
[6] L.A. Vidal et al., Measuring project complexity using the Analytic Hierarchy Process, International Journal of Project Management, Elsevier Vol. 29, Issue 6, August 2011, pp. 718-727.
[7] Zafer ALTIN et al., “a Quantitative Model Proposal For The Assesment Of Project Performance: The Bridge Model“, The Journal of Social Sciences, Turkey, Volume 13, issue 2, 2015.
[8] Amel Ben Hadj, Bahia Bejar Ghadhab, “Performance improvement of the software development project using the Value KPI Value Validation
ET 0 employee displacement does not occur within the project
PLT 0.01 lower absenteeism
POCR 0.04 Found moderate level of financial risk
POTR 0.04 Found moderate level of time risk
ISSN: 1992-8645 www.jatit.org E-ISSN: 1817-3195
Management approach”, International Journal of Computer Science Issues (IJCSI), Vol. 8, Issue 3, No. 2, May 2011.
[9] Che-Wei Chang et al.,“A measurement model for experts knowledge-based systems algorithm using fuzzy analytic network process“, Expert Systems with Applications, Elsevier Vol.38 (2011), pp. 12009-12017. [10]Erginel Nihal, Senturk Sevil. “Rankings of the
GSM Operators with Fuzzy ANP”, Proceedings of the world Congress on
Engineering, London-UK, 2011, Vol.3.
[11]Chen, J.K., Chen I.S., “Using a novel conjunctive MCDMapproach based on DEMATEL, fuzzy ANP, and TOPSIS as an innovation support system for Taiwanese higher education”, Expert Systems with Applications, vol. 37, pp. 1981-1990.
[12]Safak Kiris, “Multi-Criteria Inventory Classification by Using a Fuzzy Analytic Network Process (ANP) Approach”,
INFORMATICA, Vilnius University Turkey,
Vol. 24, No. 2, 2013, pp.199–217.
[13]Narasimha Bolloju et al., Integrating knowledge management into enterprise environments for the next generation decision support, Elsevier - Decision Support Systems Vol. 33 (2002), pp. 163– 176.
ISSN: 1992-8645 www.jatit.org E-ISSN: 1817-3195
ISSN: 1992-8645 www.jatit.org E-ISSN: 1817-3195
Table 1, The Data Sources and Formulas To Develop the KPI’s-BSC from many project domains which are integrated within the PIM domain.
No Perspective KPI Formula Data Source
1 Finance Return Of Assets
(ROA) ev, earned value
ac, actual cost
(cost management) Cost Performance
Index (CPI)
ni, net income (cost management) ta, total assets (asset management) Total Asset Turn Over
(TATO)
income, project payment ev, earned value (cost management) Schedule Performance
Index (SPI)
ev, earned value pv, planned value (cost management) Return of Equity
(ROE)
ni, net income se, shareholder equity (cost management)
2 Customer Customer Satisfaction
(CS)
nc, numbers of complain ns, numbers of customers (communication management)
NoMV nav, numbers of accepted vendor
nv, numbers of vendors (Procurement Management)
3 Internal
Process Business
PoD nDelay, numbers of activity delay
nAcivity, numbers of activity (Time Management)
PoMS nMS, numbers of miss activity sequence
nAcivity, numbers of activity (Time Management)
4 Learning and
Growth
ET nTurnOver, numbers of turn over workers
nAcivity, numbers of activity (Time Management) Percentage of Loss
Time (PLT)
dL, loss day for all employee nE, numbers of employee
nDay, numbers of planning day for one project activities
(Time Management) Percentage of Cost
Risk (PoCR)
nCR, numbers of risk cost nR, numbers or total risk (Risk Management)
Percentage of Time Risk (PoTR)
nTR, numbers of time risk nR, numbers or total risk (Risk Management) Percentage of Scope
Risk (PoSR)