2016 Joint International Conference on Artificial Intelligence and Computer Engineering (AICE 2016) and International Conference on Network and Communication Security (NCS 2016)
ISBN: 978-1-60595-362-5
Fast Detection Method of Rice Storage Quality
Based on Machine Olfaction
Li-Li WU
*, Ai-Ying LIN
College of Sciences, Henan Agricultural University, Zhengzhou, Henan, China [email protected]
*Corresponding author
Keywords: Machine Olfaction, Principal Component Analysis, Back Propagation Network, Stochastic Resonance, Classification.
Abstract. A fast detection method of rice storage quality was studied in this paper. The smell quality detection of stored rice was as a research object, and the odor data was collected by the gas sensor array. The method of principal component analysis was used for feature dimension reduction. Finally the BP network and stochastic resonance algorithm were used for classification respectively. The test results showed that the correct recognition rate was 93.33% by using the classification method of stochastic resonance. The machine olfaction system proposed in this paper can achieve the purpose of testing the rice storage quality non-destructively, rapidly and accurately, which provides a new way for food quality nondestructive testing research.
Introduction
Rice is one of the world's most important food crops, which yield accounts for 1/3 of the world grain output. However the annual loss of rice reached millions of tons, which was caused by bug, mildew and quality deterioration. How to reduce the loss of rice storage has been an international problem. One reason for the serious loss of rice in the process of storage is that it can't be found in time. Therefore, how to quickly detect the food problem and take corresponding measures to reduce the loss of rice is one of the keys of grain storage.
At present the detection of rice storage quality in our country mainly rely on manual, and this method has obvious disadvantages in the aspects of objectivity, accuracy and rapidity. Therefore a new method to detect the quality of rice storage is urgently needed to overcome the problems existing in manual inspection.
Experiments and Preprocess
Experimental Materials
The rice quality of different temperature storage condition was detected and analyzed by machine olfaction in the experiment. The experimental sample was the Yuanyang Rice produced in 2013, which was provided by Henan Academy of Agricultural Sciences. Rice samples were 300g, which were divided into 50g and put into 6 biochemical incubators under different storage conditions. The storage temperature of No.1 sample was 5 C, No.2 was 10 C, No.3 was 15 C, No.4 was 20 C, No.5 was 25 C and No.6 was 5 C. The relative humidity of all the incubators was 20%, and the measurement was started after 180 days.
Experimental Device
[image:2.612.187.425.326.398.2]In the process of storage, the quality of the rice will change and produce some volatile substances, and these volatile substances often have a specific odor. These odor components mainly have three sources: one is the intermediate products or final products of rice itself in the metabolic process, such as alcohols, aldehydes, ketones etc; two is the stored grain pests, which will release some special odor substances in their metabolic process; three is the microorganism in the rice, which are mainly mold, and mold will produce some volatile ingredient in the metabolic process. The combination of these three factors together affect the smell of rice during storage[5].
[image:2.612.232.377.435.526.2]Figure 1. Block diagram of electronic nose system.
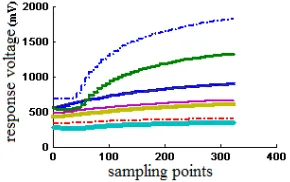
Figure 2. Original response curves of sensor array to the No.6 rice sample.
Table 1. Gas sensor array.
Sensor Type of sensor Sensitive performance description
1 MQ-2 propane, hydrogen and liquefied petroleum gas
2 MQ-3 ethanol
3 MQ-5 methane, propane, butane
4 MQ-7 carbon monoxide
5 MQ-135 ammonia, sulfide, benzene series
6 MQ-136 hydrogen sulfide
7 MQ-137 ammonia
8 MQ-138 toluene, ethanol, acetone, formaldehyde,
hydrogen, etc
[image:2.612.98.517.572.701.2]produced by Zhengzhou Wei Sheng Electronics Technology Co., Ltd. The performance of each sensor was described as shown in TableⅠ, which had different responses to sulfide, alkanes, alcohols etc. The working environment of detection system was clean air, and nitrogen was used as carrier gas. The heating voltage of the sensor was 5V, the operating voltage was 5V, and the load resistance was 4.7KΩ. Figure 2 showed the original response curves of the 8 sensors to the No.6 rice samples. Obviously, these sample data were very divergent, which was distributed in 200 ~ 2000mV and was not conducive to the subsequent classification. Therefore, it was necessary to preprocess the original data.
Data Preprocessing
In the practical application the range of the sample data collected by each sensor was not completely consistent, and some of them even differed greatly, which brought a lot of inconvenience to pattern recognition. When the artificial neural network (ANN) was used for pattern recognition, these scattered samples would decrease the convergence rate of the network, increase the difficulty of the network training, and lead to the failure of network training [2]. Therefore, the signal preprocessing method could effectively decrease the recognition complexity, reduce the error, and improve the recognition performance of the signal processing system.
The purpose of data preprocessing was to realize the drift compensation, data smoothing and reduce the signal fluctuation, etc by transform. The original data collected by the sensor array was used to benchmark, smooth and filter, and the data obtained were normalized by Eq.1.
min
max min
ij ij ij ij ij
X R R R R . (1)
HereXij was the normalized response value of the sensor i in the gas j, Rij was the output voltage
value of the sensor i in the gas j. Rijmax and Rijmin were the maximum and minimum values of the
sensor response in a complete cycle.
After normalization processing, the output of each sensor was in the [0, 1], so each element of the response vector was in the same order of magnitude, which ensured the validity of the data and reduced the recognition difficulty.
Feature Dimension Reduction and Extraction Based on PCA
The process of feature extraction is a transformation process, which transforms the raw data of high dimensional space into the low dimensional data. In feature extraction, the feature dimensions of all data are reduced by linear or nonlinear transformation. The purpose of the transformation is to use less data to replace the original high-dimensional feature.
[image:3.612.85.527.607.703.2]Principal component analysis (PCA) is one of the most widely used methods of linear feature extraction at present. It makes the projection data can represent the original data in the minimum mean square error by looking for a projection direction [6].
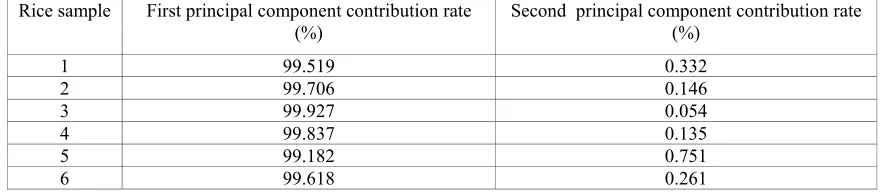
Table 2. The contribution rate of the first two principal components by PCA processing.
Rice sample First principal component contribution rate (%)
Second principal component contribution rate (%)
1 99.519 0.332
2 99.706 0.146
3 99.927 0.054
4 99.837 0.135
5 99.182 0.751
6 99.618 0.261
included in the previous main component may be mostly noise. Table 2 showed the contribution rate of the first two principal components for 6 different kinds of storage quality after PCA dimension reduction. Obviously, the average contribution rate of the first principal component of each category was more than 99%, so the data was compressed to 1 dimension, and the first principal component data was used to replace the original 8 dimensional data for subsequent identification.
Detection Method
Classification Method Based on Back Propagation Network
The output signal of the machine olfactory system is a complex time varying signal. It cannot be approximated by some simple mathematical functions, which makes a lot of signal processing methods can not handle the machine olfactory signal. Artificial neural network (ANN) is a commonly used model in the pattern recognition algorithm, which has the characteristics of self-organization, non- linear dynamic processing and fault- tolerance, and is especially suitable for dealing with various kinds of nonlinear classification problems. In the practical application of artificial neural network, back propagation (BP) network is widely used in function approximation, pattern recognition, data compression, etc. 80%~90% artificial neural network model has adopted the BP network or its change form. It is also the core part of the feed forward network, which reflects the essence of ANN [7].
There had 6 types of data processed by PCA dimension reduction. In each type of data 80 sample points were selected as training samples, and 40 sample points as a test samples. Using BP network to identify the quality of rice storage, the 8 dimensional input vectors and the 6 dimensional output vectors were established. In BP network, the hidden layer of S type excitation function was adopted, and the number of neurons in the hidden layer was 16 (the correct recognition rate is the highest). The Levenberg-Marguardt optimization algorithm was used in the network training function, the network maximum training step size was set to 5000, and the target error was 0.0001.
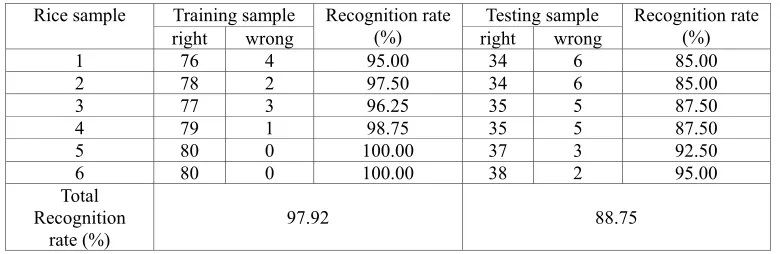
[image:4.612.112.502.513.640.2]The rapid determination results of rice samples by BP network were shown in table 3. When the training samples were identified by the BP network, the classification results were good. However, when the test samples were classified, the identification results were not very satisfactory by modifying the number of hidden layer units and the weight learning algorithm. These showed that the generalization ability of BP network was low in the case of small samples.
Table 3. Classification of BP network.
Rice sample Training sample Recognition rate
(%) Testing sample Recognition rate (%)
right wrong right wrong
1 76 4 95.00 34 6 85.00
2 78 2 97.50 34 6 85.00
3 77 3 96.25 35 5 87.50
4 79 1 98.75 35 5 87.50
5 80 0 100.00 37 3 92.50
6 80 0 100.00 38 2 95.00
Total Recognition
rate (%) 97.92 88.75
Classification Method Based on Stochastic Resonance
The stochastic resonance system for classification was described by the FitzHugh-Nagum (FHN) model, which was shown as Eq.2.
( )(1 ) ( ) ( )
dv
v v a v w A S t t
dt dw
v w b
dt
. (2)
Here, vwas the neuron membrane voltage, which was a fast changing signal. w was a slowly
varying recovery variable. ε was a time constant, which determined the firing rate of neurons. A was a critical threshold constant. In the formula (2), ε=0.05,a=0.5,b=0.15,A=0.11mV. ( )t was the zero
mean Gauss white noise, whose autocorrelation function was ( ) (0)t 2D( )t , and D was the
noise intensity. S(t) was a non periodic input signal.
The measure of the stochastic resonance system was usually used to calculate the correlation coefficient, and the formula was shown in Eq. 3, which described the matching degree between the random input and the output signal in the system.
2 2
[ ( ) ][ ( ) ] cov( , ) var( ) var( ) [ ( ) ] [ ( ) ]
xy
x t x y t y x y
x y
x t x y t y
. (3)
Here, x(t) was the input signal, y(t) was the output signal. x and y were the statistical mean of x
and y, respectively.
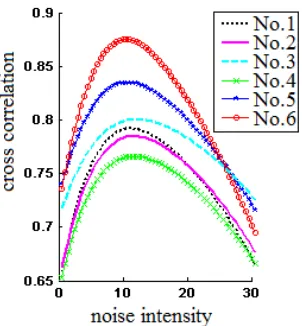
The same training samples and test samples with the BP network were used in the stochastic resonance systems. Firstly, the training samples of each class were added together with the noise signals of different intensities, and they were used as the input signals of the SR system. In different noise intensities, cross-correlation coefficient was used to indicate the degree of similarity between each class of output and input, which was the mean value by calculating 100 times. Fig. 3 showed the relationship between noise intensity and cross correlation coefficient of 6 kinds of rice samples with different storage quality. Under different noise intensity, the cross correlation coefficient curve of SR system had a single peak, that is to say, the maximum cross correlation coefficient of each kind was different from each other.
Figure 3. Curve of cross-correlation coefficients with different noise intensity.
Table 4. Classification of Stochastic resonance.
Rice sample Training sample Recognition rate (%)
Testing sample Recognition rate (%)
right wrong right wrong
1 79 1 98.75 36 4 90.00
2 79 1 98.75 36 4 90.00
3 80 0 100 38 2 95.00
4 80 0 100 37 3 92.50
5 80 0 100 38 2 95.00
6 80 0 100 39 1 97.50
Total Recognition
rate (%) 99.58 93.33
Summary
In this paper, 6 kinds of rice samples were collected from different temperature storage conditions by using the machine olfactory system. These data were preprocessed and reduced by PCA, and then they were input to the BP neural network and stochastic resonance system to identify the type respectively. Due to the low generalization ability of BP network in the case of small samples, the correct recognition rate for the 6 types of rice was not high, only 88.75%. When the same samples were processed by the method of stochastic resonance classification, the maximum correlation coefficient was used as the classification feature, and achieved a satisfactory result, up to 93.33%. In this paper, the detection of rice quality in different temperature conditions was studied. The quality analysis of rice under different storage conditions such as humidity and oxygen concentration will be further studied.
Acknowledgement
The authors acknowledge the financial support of the scientific and technological project of Henan Province (142102110054).
References
[image:6.612.118.496.292.427.2][2] S. Balasubramanian, S. Panigrahi, B. Kottapalli, et al, Evaluation of an artificial olfactory system for grain quality discrimination, LWT, vol. 40, pp. 1815-1825, 2007.
[3] Wu Lili, Zheng Dan and Zheng Baozhou, et.al, Study of Zanthoxylurn Bungeanum Varieties Discriminating Method by Electronic Nose Technology, Chinese Journal of Sensors and Actuators. vol. 26, pp. 1473-1477, 2013.
[4] Antihus Hernandez Gomez, Jun Wang, Guixian Hu, et al, Monitoring storage shelf life of tomato using electronic nose technique, Journal of Food Engineering. vol. 85, pp. 625-631, 2008.
[5] Xie Tongping, Research on the rice storage quality and quick determinant technology of electronic nose, Master Degree thesis. Nanjing, China: Nianjing University of Finance and Economics, 2012, 1.
[6] K.H. Esbensen, P. Geladi, Principal Component Analysis: Concept, Geometrical Interpretation, Mathematical Background, Algorithms, History, Practice Comprehensive Chemometrics, 2009: 211-226.
[7] Xiu Chunbo, Artifical intelligence theory, Beijing: China Machine Press, 2011.
[8] Thomas Wellens, Vyacheslav Shatokhin, Andreas Buchleitner, “Stochastic resonance,” Reports on Progress in Physics, vol. 67, pp. 45-105, 2004.
[9] Wu Lili, Hui Guo hua, Lin Aiying, et al, “Study on early moldy grain identification based on aperiodic stochastic resonance,” Chinese Journal of Scientific Instrument, vol. 32, pp. 742 – 747, 2011.