Journal of Engineered Fibers and Fabrics 34 http://www.jeffjournal.org Volume 6, Issue 4 - 2011
Development of a Parametric Design Method for
Various Woven Fabric Structures
Sungmin Kim
Chonnam National University, Gwangju, Chonnam KOREA Correspondence to:
Sungmin Kim email: [email protected]
ABSTRACT
An integrated woven fabric system has been developed. A series of parametric design rules have been defined by analyzing famous woven structures. An expandable script language and its compiler have been developed to generate scalable weave diagrams using those rules. A calculation algorithm has also been developed to generate draft and peg plans based on the weave diagrams. Finally, a two-dimensional realistic fabric image rendering function using the actual image of various yarns, a three-dimensional fabric modeling method based on B-Spline approximation, and a pseudo three-dimensional mapping method for simulated images of final products were all integrated into the system.
INTRODUCTION
Fabric design has been evolved in various ways according to the region, time, and cultural environment. Traditionally, there have been three major methods to make colorful fabric. One is printing, another is dying, and the third is weaving with dyed yarn. Recently, digital printing technology has made virtually any kind of complex design possible. A high-end fabric is usually made of dyed yarn because it looks better than any other fabrics made by other methods. However, it has been very difficult to design a yarn dyed fabric because it is hard to predict the final appearance of fabric before costly weaving process due to its complex woven structure. Therefore, the computer-aided woven fabric design had been the first topic in the automation in textile industry and it has been developed to be one of the most effective processes nowadays.
There have been many studies on the automatic design of complex woven fabric structures. Moore and Pourdeyhimi emphasized on the importance of computer-aided fabric design and proposed a series of basic methodologies [1, 2]. Chen et. al. developed a CAD system to design complex two and three-dimensional woven structures using a matrix system. [3-6], Lin et. al. tried to visualize the internal
structure of fabric three-dimensionally using B-Spline approximation method [7, 8]. Ozdemir et. al. rendered the realistic image of fabric using actual image of various yarns [9]. Several commercial textile CAD systems have also been developed and are widely used such as 4D Box, Evolution, PrimaVison, TexPro, Weave Design, and so on [10-14]. However, most of those systems had a built in fabric structure generator that it has been impossible to add newly developed fabric structure information to them without modifying the whole system. In this study, a script based fabric design language has been developed to solve this problem. Script language is composed of several intuitive commands and parameters. Therefore, the definition of any new woven structure can be easily added to the fabric design database even by the user by simply adding a few lines to the script file. The shape and size of any parameterized woven structure can be modified easily by providing appropriate parameters.
Finally, a comprehensive weave CAD system framework has been developed including an automatic draft and peg plan generator, a two and three-dimensional fabric image renderer, and a virtual simulation function for simulated final products.
THEORY AND ALGORITHM Parametric Design of Weave Diagram
A fabric structure is formed by the intersection of warp and weft threads and it can be described using a weave diagram as shown in Figure 1. The dimension of a weave diagram is that of the repeat unit of a weave design. Each black box in a diagram denotes the position where a warp floats over a weft and vice versa.
Journal of Engineered Fibers and Fabrics 35 http://www.jeffjournal.org Volume 6, Issue 4 - 2011
Such a weave diagram can be easily represented by a matrix of which the elements are only 0 and 1 for calculation. However, as numerous woven structures can be derived from the same basic structure by changing the pattern and/or the size of repeat unit that it is impossible to incorporate all the possible woven structures into a design system as matrices.
In this study, a parametric design method which is widely used in current computer aided design systems was introduced to solve this problem. For example, the structures shown in Figure 2(a) are all plain weaves with different sizes and those shown in Figure 2(b) are same twill weaves with different line widths. In this case, the size of repeat unit and twill line width can be called as design parameters. Any kind and size of woven structures can be designed in a parametric way as long as the design parameters representing the structures are found and the underlying design rule is analyzed.
FIGURE 2. Examples of Variations in Fabric Structures.
For this, a script based programming language and its compiler have been developed to describe the complex design rule of various weave diagrams. The script language is composed of several commands which can modify the matrix representing the woven structure using the parameters provided by the users. Script compiler supports fundamental arithmetic operations and algebraic expressions just as other common programming language compilers. Complex calculations with nested brackets and user defined variables can also be possible as the compiler is based on the inverse polish calculation method [15]. The syntax and function of script language commands are as shown in Table I.
This script language is easily expandable that additional commands can be implemented for the need of more complex woven structures such as three-dimensional or multi-layer ones. The automatically designed initial structures can be modified further into more sophisticated ones using a series of dedicated user interfaces.
Generation of Draft and Peg Plans
Once a weave diagram is designed, the number of harness and draft plan which are required to thread warps into appropriate heddles can be calculate automatically as shown in Figure 3.
A peg plan is also required for weaving where the sequential up-down action of each harness per one weft insertion is described. As it is easy to see in a weave diagram which warps float or sink in every weft insertion, pen plan can be easily generated by cross-checking the weave diagram and draft plan.
TABLE I. Syntax and Function of Script Language Commands for Fabric Design.
Command Parame te rs Function
GRID Row, C olumn P repare blank matrix REC TAN GLE Left, Top, Width,
Height
F ill specified region of matrix with 1 (black point) LIN E45 Row, C olumn, Length Draw a 45 degree line of give n
length starting from (row,colum n) LIN E- 45 Row, C olumn, Length Draw a - 45 degree line of give n
length
starting from (row,colum n) DILATE Dilatio n ratio Dilate black point in the matrix
with specified ratio PUTP IXEL Row, C olumn,
Row step, C olumn step
Draw points starting from (row,column) with the interva l of (row step, column step) M IRRO R C olumn M irror the part of matrix
right to the specified column
FLIP Row F lip the part of matrix
lower than the specified row S YM RIGHT - S ymmetr ize the matrix to the right
to enlarge the matrix SYM BO TTO M - S ymmetr ize the matrix to the
bottom to enlarge the matrix IN SERTWARP C olumn Insert a new warp after the
specified column IN SERTW EF T Row Insert a new weft below the
Journal of Engineered Fibers and Fabrics 36 http://www.jeffjournal.org Volume 6, Issue 4 - 2011 for i=1 to n-1 for j=i+1 to n Compare i th and j th columns
Assign a harness with warp i and j Set warp i and j as assigned Increase the harness number are i th and j th warps
not assigned ? Initialize harness number to 1
Set all warps as free
No Yes Same Different n warps Harness Compare
FIGURE 3. Generation of Draft Plan.
Simulation of Woven Fabric
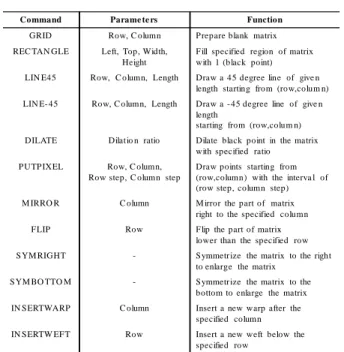
In this study, two kinds of fabric renderers have been developed to simulate woven fabrics. The two-dimensional rendering method used the actual images of warp and weft threads to simulate the subtle characteristics of fabric surface as shown in Figure 4. Each warp and weft thread can have different colors and a special shadow effect is applied around the intersection points of warp and weft for realism. Also users can modify the thickness and density of warp and/or weft to simulate various configurations of fabric.
The three-dimensional modeling method was also used to enable users to observe the complex internal structure of a fabric. For this, the spatial path of each thread is approximated by a B-Spline curve based on the weave diagram. Then a skinning method along the path was used to make the yarn model. The cross sectional shape of each yarn can be either circular or elliptic. A three-dimensional fabric model is expected to be useful in the prediction of fabric physical properties such as heat conductivity or air permeability using finite element analysis method
FIGURE 4. 2-D Rendering of Fabric Images.
FIGURE 5. 3-D Rendering of Fabric Models.
Virtual Drape Simulation
One of the most important things to be considered in fabric design is the verification of its visual appearance on the final products such as garment or upholstery.
However, it had been possible only after a costly weaving process that computer simulation became an essential process in fabric design. In this study, a virtual drape simulation function has been developed where users can verify the fabric design by mapping it onto the photos of final products made of white fabrics. In this method, multiple regions can be defined on a photo for different fabrics and a grid guide is assigned to each region to map the fabric image according to the curved surface of the product. Some examples of simulated results are as shown in Figure 6.
FIGURE 6. Examples of Virtual Drape Simulation.
RESULTS AND DISCUSSION
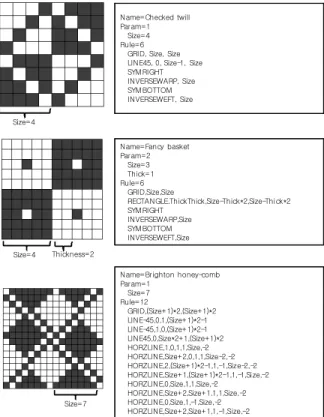
A script file type database has been generated for a total of 16 woven structures. Some examples of the structures and corresponding design scripts are as shown in Figure 7. As can be seen in the figure, each structure is designed by a few lines of scripts with simple arithmetic and algebraic calculations.
Journal of Engineered Fibers and Fabrics 37 http://www.jeffjournal.org Volume 6, Issue 4 - 2011 Name=Checked twill Param=1 Size=4 Rule=6
GRID, Size, Size LINE45, 0, Size-1, Size SYM RIGHT INVERSEWARP, Size SYM BOTTOM INVERSEWEFT, Size Size=4 Size=4 Thickness=2 Name=Fancy basket Param=2 Size=3 Thick=1 Rule=6 GRID,Size,Size RECTANGLE,ThickThick,Size-Thick*2,Size-Thick*2 SYM RIGHT INVERSEWARP,Size SYM BOTTOM INVERSEWEFT,Size Size=7 Name=Brighton honey-comb Param=1 Size=7 Rule=12 GRID,(Size+1)*2,(Size+1)*2 LINE-45,0,1,(Size+1)*2-1 LINE-45,1,0,(Size+1)*2-1 LINE45,0,Size*2+1,(Size+1)*2 HORZLINE,1,0,1,1,Size,-2 HORZLINE,Size+2,0,1,1,Size-2,-2 HORZLINE,2,(Size+1)*2-1,1,-1,Size-2,-2 HORZLINE,Size+1,(Size+1)*2-1,1,-1,Size,-2 HORZLINE,0,Size,1,1,Size,-2 HORZLINE,Size+2,Size+1,1,1,Size,-2 HORZLINE,0,Size,1,-1,Size,-2 HORZLINE,Size+2,Size+1,1,-1,Size,-2
FIGURE 7. Examples of Fabric Design Scripts.
Some examples of rendered images of fabrics with different parameters are as shown in Figure 8.
FIGURE 8. Examples of Rendered Fabrics.
The original image, the grid for three-dimensional effect, and the results of virtual drape simulation are as shown in Figure 9.
Original Image Region Definition
Grid Definition Fabric Mapping
FIGURE 9. Schematic Diagram of Virtual Drape Simulation.
The procedures of virtual drape simulation can be described briefly as follows. First, capture a photograph of a model in white garments. Then define several regions on the image where mutually different colors can be mapped. Finally, define a quadrilateral grid on each region and deform the grid approximately according to the curved shape of garment as shown in Figure 9. Once the grid is defined, a texture image can be mapped on each region using isoparametric mapping technique with respect to the deformed grid as shown in Figure 10. The color of each pixel on the texture image is multiplied by the normalized intensity of the underlying pixel to make a natural shade.
Initial grid Deformed grid
(0,0) (1,0)
(0,1)
(0,0)
(1,0)
(0,1)
Journal of Engineered Fibers and Fabrics 38 http://www.jeffjournal.org Volume 6, Issue 4 - 2011
CONCLUSION
In this study, a comprehensive woven fabric structure design system has been developed including the functions such as the automatic weave diagram generation, the automatic calculation of draft and peg plan, the realistic rendering of two and three-dimensional fabric images, and the virtual drape simulation of final products. The difference of this system from others is that a script language has been developed to manipulate the weave diagrams instead of integrating the codes for the generation of woven structure into the system itself. Therefore any new structure can be added to the database simply by converting its design rule into a few lines of script. The size and/or pattern of a repeat unit can be modified easily by providing the script with appropriate parameters. This system could be a more practical weave CAD system as well as a reverse engineering system if the automatic woven fabric structure recognition system would be integrated which is another topic of my research group. The CAD system developed in this study can be downloaded from my website and can be used for educational purpose for free [16].
REFERENCES
[1] Moore, R. and Miller, L., "Woven-fabric design: a changing role!” Journal of the Textile Institute, 80(3), 1989, pp. 337-350.
[2] Pourdeyhimi, B., "Programming technique in computer-aided design of woven fabrics", Journal of the Textile Institute, 80(3), 1989, pp. 391-402.
[3] Chen, X. et al., "Automatic generation of weaves for the CAM of 2D and 3D woven textile structures", Journal of the Textile Institute, 87(2), 1996, pp. 356-370.
[4] Chen, X. and Potiyaraj, P., "CAD/CAM for complex woven fabrics part I: backed cloths", Journal of the Textile Institute, 89(3), 1998, pp. 532-545.
[5] Chen, X. and Potiyaraj, P., "CAD/CAM for complex woven fabrics part II: multi-layer fabrics", Journal of the Textile Institute, 90(1) , 1999, pp. 73-90.
[6] Chen, X. and Potiyaraj, P., "CAD/CAM of orthogonal and angle-Interlock woven structures for industrial applications", Textile Research Journal, 69(9), 1999, pp. 648-655. [7] Lin, H. Y. and Newton, A., "Computer
representation of woven fabric by using B-splines", Journal of the Textile Institute, 90(1), 1999, pp. 59-72.
[8] Farin, G., "Curves and surfaces for CAGD - A practical guide fifth edition", Morgan Kaufmann, London, 2002.
[9] Ozdemir, H. and Baser, G., "Computer simulation of woven fabric appearances based on digital video camera recordings of moving yarns", Textile Research Journal, 78(2), 2008, pp. 148-157.
[10] 4D Box, www.4d-box.com. [11] Evolution, www.digifab.com. [12] PrimaVison, http://www.lectra.com. [13] TexPro, www.texclub.com.
[14] Weave Design, http://www. pointcarre.com. [15] Hamblin, C. L., "Translation to and from Polish
Notation", The Computer Journal, 5(3), 1962, pp. 210-213.
[16] CNU-WeaveCAD,
http://latam.jnu.ac.kr/r_weavecad.asp AUTHORS’ ADDRESSES
Sungmin Kim
Chonnam National University Department of Polymer and Fiber System Engineering 300 Yongbong-dong Puk-gu Gwangju, Chonnam 500757 KOREA