Grid-ODF: Detecting Outliers Effectively and
Efficiently in Large Multi-dimensional Databases
Ji Zhang1 Hai Wang2 Wei Wang3
1Department of Computer Science, University of Toronto,
Toronto, Ontario, M5S 3G4, Canada
2Sobey School of Business, Saint Mary's University,
Halifax, Nova Scotia, Canada B3H 3C3
3Nanjing Normal University, Nanjing, Jiangsu, P.R. China 210000 [email protected]
Abstract:
Outlier detection is an important task in data mining that enjoys a wide range of applications such as detections of credit card fraud, criminal activity and exceptional patterns in databases. In recent years, there have been numerous research work in outlier detection and the new notions such as distance-based outliers and density-based local outliers have been proposed. However, the existing outlier detection algorithms suffer the drawbacks that they are inefficient in dealing with large multi-dimensional datasets and most of them are only able to capture certain kinds of outliers. In this paper, we will propose a novel outlier mining algorithm, called Grid-ODF, that takes into account both the local and global perspectives of outliers for effective detection. The notion ofOutlying Degree Factor (ODF), that reflects the factors of both the density and distance, is introduced to rank outliers. A grid structure partitioning the data space is employed to enable Grid-ODF to be implemented efficiently. Experimental results show that Grid-ODF outperforms existing outlier detection algorithms such as LOF and KNN-distance in terms of effectiveness and efficiency.
1. Introduction
With an increasing amount of data acquired and stored in large databases, KDD technologies have become crucial to discover useful knowledge and patterns from such large databases. Outliers are important entities that often contain useful information and exceptional behavior in the system. In recent years, outlier detection has been seen as an important task in data mining that enjoys a wide range of applications such as detections of credit card fraud, criminal activity and exceptional patterns in databases. Outlier detection problem can be typically formulated as follows: given a set of data points or objects, find a specific number of objects that are considerably dissimilar, exceptional and inconsistent with respect to the remaining data [HK00].
In this paper, we introduce a novel approach to find the top_n outliers in a large multi-dimensional database. A new measurement of outlying factor of data points, called
Outlying Degree Factor (ODF), is proposed to measure the outlier-ness of points from both the global and local perspectives. Specifically, the technical contributions of this paper are as follows:
(1) This paper proposes a novel outlier formulation that takes into account of the mechanisms used in detecting both global and local outliers. ODF captures not only the local information of the data but also the difference between the data and some globally dense regions in the data space. The measurements of density and distance are both incorporated in ODF to rank outliers. An involvement of two viewing perspectives (global and local) and two measurements (density and distance) in our outlier formulation will synergistically make it more robust in detecting outliers than its predecessors that rely on a standalone mechanism;
(2) The technique of grid-based data space partitioning is utilized to enable Grid-ODF to achieve a notable efficiency;
(3) Last but not least, we present the experimental results showing that our algorithm is both efficient and effective in detecting outliers compared to LOF and k-nearest neighbor distance methods.
Roadmap
The reminder of this paper is organized as follows. In Section 2, we present a survey of related work in outlier detection algorithms. Section 3 discuses the observations in human perception of outliers, which serves as the basis of the formal definitions of outlier in this paper. In Section 4, we present our formal definitions of outliers. Grid-based data partition is introduced in Section 5, followed by the discussion on our outlier detection algorithm. Experimental results are presented in section 7. Section 8 concludes this paper.
2. Related Work
An outlier is an observation that deviates so much from other observations so that it arouses suspicious that it is generated by a different mechanism [Haw80]. Literatures on outlier detection algorithms have been abundant in recent years and can be classified into following major categories based on the techniques used, i.e. distribution-based
methods, distance-based methods, density-based methods and clustering-based methods.
Distribution-based methods [Haw80, BL94] rely on the statistical approaches that assume a distribution or probability model to fit the dataset. Over one hundred discordancy/outlier testes have been developed for different circumstances, depending on the parameter of dataset (such as the assumed data distribution) and parameter of distribution (such as mean and variance), and the expected number of outliers [KN98, HK00]. However, distribution-based methods suffer some key drawbacks. At first, they cannot be applied in multi-dimensional scenario because they are univariate in nature. In addition, a lack of any prior knowledge regarding the underlying distribution of the dataset makes the distribution-based methods difficult to use in practical applications. Finally, the quality of results cannot be guaranteed because they are largely depended on the distribution chosen to fit the data.
the objects in the datasets having the distance larger than dmin from this object. In other words, the cardinality of the points having distance smaller than dmin is no more than (100-pct)% of the size of dataset. In [RRK00], the notion of distance-based outlier was extended and the distance to the kth nearest neighbors of a point p, denoted as Dk(p), is proposed to rank the point so that outliers can be more efficiently discovered and ranked. Unlike distribution-based methods, distance-based methods do not rely on any assumed distribution to fit the data. Because they only examine the neighborhood for each object in the outlier detection, distance-based methods achieve better efficiency than distribution-based and depth-based methods. But, as [BKNS00] has pointed out, DB-Outliers has a limited ability in detecting outliers and cannot work well in some complex structure. Recently, a density-based formulation scheme of outlier was proposed in [BKNS00]. This formulation ranks the outlying degree of the points using Local Outlier Factor (LOF). LOF of an object intuitively reflects the density contrast between its density and those of its neighborhood. Because LOF ranks points only considering the neighborhood density of the points, thus it may miss the potential outliers whose densities are close to those of their neighbors. [JTH01] improved the efficiency of algorithm of [BKNS00] by proposing an efficient micro-cluster-based local outlier mining algorithm, but it still use LOF to mine outliers in dataset.
The final category of outlier detection algorithm is clustering-based. So far, they are numerous studies on the clustering and a number of them are equipped with some mechanisms to detect outliers, such as CLARANS[NH94], DBSCAN[EKSX96], BIRCH[ZRL96], WaveCluster[SCZ99], DenClue[HK98] and CLIQUE[AGGR99]. Strictly speaking, clustering algorithms should not be considered as outlier detection methods, because their objective is only to group the objects in dataset such that clustering functions can be optimized rather than detecting outliers. The aim to eliminate outliers in dataset in clustering is only to dampen their adverse effect on the final clustering result.
3. Observations in Human Perception of Outliers
In the general sense, outliers can be viewed from either the local or global perspective. In the local perspective, human tend to examine the point’s immediate neighborhood and view it as an outlier if the density of its neighborhood is low. The global observation takes into consideration of the fact that the dense regions, where the data points are densely populated in the data space, also exert influence on the degree to which a point is outlying: a point will be perceived as an outlier globally by human being if this point is far from the dense regions displayed by the dataset. Recent outlier detection approaches mainly study the outliers from the local perspective, failing to reflect the global observation in their outlier modeling. Now, we will discuss in details the two factors that are taken into consideration when deciding the outlying degree of a point:
[image:3.595.327.438.617.690.2]
Figure 1. Two points with
[image:3.595.160.271.618.688.2](1) The neighboring density of the point
The majority of existing outlier detection approaches rely on the local characteristics of the point to decide the degree to which the point is an outlier, such as the DB(pc,dmin )-outlier, K-neatest neighbor distance and LOF. The neighboring density of the point serves as a good indicator of its outlying degree. The lower the neighboring density of the point p, the higher the outlying degree it has, otherwise it is not. In Figure 1, two square boxes of equal size are used to delimit the neighborhood of points p1 and p2. Because the neighboring density of p1 is less than that of p2, so the outlying degree of p1 is larger than p2.
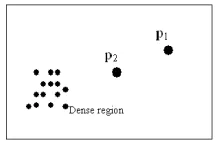
(2) The distance between the point and the dense regions
The distance between the point and the dense regions reflects the similarity between this point and the dense regions. Intuitively, the larger such distance is, the more remarkably
p is deviated from the main population of the data points and thereforethe higher outlying degree it has, otherwise it is not. In Figure 2, we can see a dense region and two outlying points, p1 and p2. The distance between a point and the dense region is defined as the distance between this point and the gradational center of the dense region. Because the distance between p1 and the dense region is larger than that between p2 and the dense region, so the outlying degree of p1 is larger than p2.
4. Formal Definitions of Top-
k
Outliers
In this section, we develop a formal definition of outlier based on observations discussed in the previous section, which successfully takes into consideration of the local and global factors when quantizing the outlying degree of points. In our work, we will use grid structure, with cells of equal volume, to partition the data space (will be discussed in details in Section 5), thus the notion of cell is involved in the definition of outliers presented in this section.
Definition 1. Density of a Grid Cell
The density of a grid cell, denoted as Den(C), measures the denseness of this cell. It is measured by the total number of points belong to the cell in the data space. A cell is dense if its density is high with respect to a human specified density threshold, say D. Specifically, let c be a cell in the multi-dimensional cube, C is a dense cell if Den(c)
≥
D.Definition 2: Neighborhood Density Factor (NDF)
The Neighborhood Density of a point p, denoted as NDF(p), measures the denseness of
p’s neighborhood. In our work, NDF(p) is quantitized using the number of points falling into the grid cell to which p belongs.
Definition 3: Distance Factor (DF)
The Distance Factor (DF) of point p with respect to a dense cell dc measures the distance between p and dc, indicating how far away is point p from dense cell dc. The Distance Factor of p with respect to dc is defined as the distance between p and the centriod of all the points residing in dc, i.e.
DF(p,dc)=Dist(p, Centriod(dc))
Definition 4. k-Distance Factor (k_DF)
Dense regions can be viewed as the union of a few dense cells, and DF(p) with respect to a dense region can thus be defined as the average of DFs of p with respect to the k
nearest dense cells of p, i.e. dc1, dc2,…,dck. They are computed as
k_DF(p)= k dc p DF k i i
∑
=1 ) , ( ( 7) where k is input as a human-specified parameter. The concept of k nearest dense cells,unlike kth nearest neighboring point used in [RRK00], enables the measurement of outlier to reflect some global characteristics of the dataset.
Definition 5. Normalized NDF (N_NDF) and Normalized k_DF (N_ k_DF)
NDF(p) and k_DF(p) are normalized in order to make them comparable with each other in the computation of ODF(p). Specifically, given the minimum and maximum values of
NDF and k_DF among all the points examined in the dataset, NDF(p) and k_DF(p) can be normalized as
N _NDF(p)= ) ( ) ( ) ( )) ( ( min max min NDF NDF NDF p NDF −
− N_k_DF(p)=
) _ ( ) _ ( ) _ ( )) ( _ ( min max min DF k DF k DF k p DF k − −
Definition 6. Outlying Degree Factor (ODF)
Combining the two factors of NDF and N_k_DF, Outlying Degree Factor (ODF) of a point p is defined as
ODF(p)= ) ( _ ) ( _ _ p NDF N p DF k N
ODF(p) captures the degree to which we call p an outlier. The higher ODF(p) is, the higher outlying degree of p is and vice versa.
The top-k outliers are therefore defined as those points that have the k highest ODF values in the database.
5. Grid-based Data Space Partition
In order to implement the computation of ODF of points in the database efficiently, we introduce the concept of grid structure to partition the data space. The main idea of grid-based data space partition is to super-impose a multi-dimensional cube in the data space, with equal-volumed cells. It is characterized by the following advantages:
(1) NDF(p) can be obtained instantly without the involvement of indexing techniques; (2) The dense regions can be efficiently identified, thus the computation of k_DF(p) can
be very fast;
(3) Based on the density of grid cells, we will be able to select the top_n outliers only from a specified number of points viewed as outliers candidates, rather than the whole dataset.
candidates based on the ranking of their ODF values. The number of outlier candidates is normally a few times (e.g. 9 or 10) as the number of final outliers to be found (i.e.
top_n) in order to provide a sufficiently large pool for outlier selection. Let us suppose that the size of outlier candidates is m*top_n, where the m is a positive number provided by users. To generate m*top_n outlier candidates, all the cells containing points are sorted in ascending order based on their densities, and then the points in the first t cells in the sorting list that satisfies the following inequality are selected as the m* top_n
outliers candidates:
∑
−=
1
1
) (
t
i i
C
Den
≤
m * top_n≤
∑
=
t
i
i C Den
1
) (
Intuitively, these m*top_n outlier candidates are the points residing the t sparsest cells. t
obtained from above inequality is the minimum number of cells that generates at least m * top_n outlier candidates.
6. Algorithm of Grid-ODF
In this section, we will present the details on the algorithm of Grid-ODF. Grid-ODF detects outliers in the following 5 major steps:
6.1 Assigning points
Each point in the dataset is read in sequentially and assigned into the grid. A linear scan of all cells in a multi-dimensional cube is often practically infeasible in terms of space and time due to the exponential growth in the number of cells as the number of dimension increases. To address this problem, we employ hash method for point assignment. Without physically creating the multi-dimensional cube in main memory, Grid-ODF maps points into cells and hash the cells into a hash table. This is advantageous as referring a grid cell through the hash table only takes a constant time.
6.2 Sorting occupied grid cells
The occupied cells are those cells that contain at least one data point. All the occupied cells are sorted in ascending order based on their density values.
6.3 Producing the outlier candidates
Given top_n and m, the points residing in the first t cells in the sorting list in the second step that satisfies the inequality given in Section 5 will be chosen to be outlier candidates. In ding so, Gird-ODF will examine the sorted list of primary cells starting from the cell having the smallest density, and terminate this step when the aggregation of the points in the cells that have been visited reaches m*top_n.
6.4 Generating the dense cells
Given a density threshold D, the dense cells are found in the cell list if the density of the cell is larger than or equal to D. These dense cells are fixed under a specific density threshold throughout the outlier detection process.
6.5 Computing ODFs and ranking top_n outliers
and k_DFmax used to normalize NDF and k_DF are obtained from all the outlier candidates, rather than from all the points in the dataset, to further speed up the detection process.
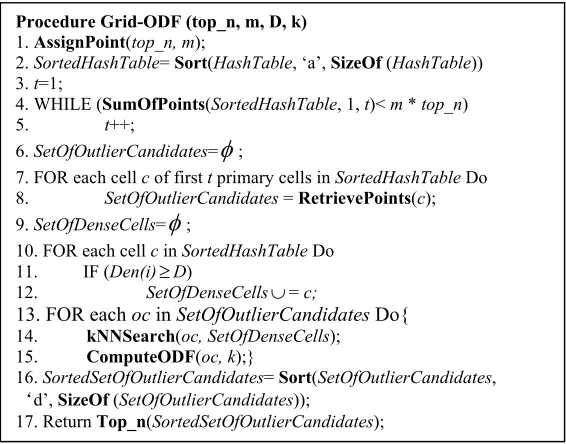
The detailed algorithm of Grid-ODF is given in Figure 3. In Grid-ODF, Step 2 performs the sorting of the hash table in an ascending order based on the densities of the cells. The sorting result is stored in SortedHashTable. In the while loop over Step 3-5, t, the number of cells that containing outlier candidates, is initialized as 1 at first, t is self-incremented in the subsequent while loop. The while loop is terminated only when there have obtained at least m * top_n outlier candidates. The Step 6-8 produce detailed outlier candidates using all the points in the t cells in the SortedHashTable, and the steps of 9-12 find the dense cells if their respective density is no less than the density threshold, D. The outlier candidates and dense primary cells are stored in SetOfOutlierCandidates and
SetOfDenseCells, respectively. Finally, the ODFs of the points in the
SetOfOutlierCandidates are computed (Steps 13-15), and the points are sorted in descending order based on their ODF values (Step 16). The points with the top_n largest
ODF values are returned to the user (Step 17).
Procedure Grid-ODF (top_n, m, D, k)
1. AssignPoint(top_n, m);
2. SortedHashTable= Sort(HashTable, ‘a’, SizeOf (HashTable)) 3. t=1;
4. WHILE (SumOfPoints(SortedHashTable, 1, t)< m * top_n) 5. t++;
6. SetOfOutlierCandidates=
φ
;7. FOR each cell c of first t primary cells in SortedHashTable Do 8. SetOfOutlierCandidates = RetrievePoints(c); 9. SetOfDenseCells=
φ
;10. FOR each cell c in SortedHashTable Do 11. IF (Den(i) D≥ )
12. SetOfDenseCells∪= c;
13. FOR each oc in SetOfOutlierCandidates Do{
14. kNNSearch(oc, SetOfDenseCells); 15. ComputeODF(oc, k);}
16. SortedSetOfOutlierCandidates= Sort(SetOfOutlierCandidates,
‘d’, SizeOf (SetOfOutlierCandidates));
[image:7.595.159.442.336.558.2]17. Return Top_n(SortedSetOfOutlierCandidates);
Figure 3. Algorithm of Grid-ODF
7. Experimental Results
We run experiments to evaluate the robustness of Grid-ODF and compare its performance against two of its competitors, namely LOF and k-nearest neighbor distance (called KNN-distance for short) methods. LOF is the latest local density outlier detection algorithm and KNN-distance is the representative of distance-based algorithm. In our experiment, we implement Grid-ODF, LOF and KNN-distance methods using C++ 6.0 on the same 900MHz Pentium III PC with 512 RAM under Windows 2000.
To evaluate the quality of outlier detection result, we need some validation criteria to serve as the benchmarks. The criteria used in our work are Standard Deviation of Clusters (SDC) and Precision of outliers detected.
(1) Standard Deviation of Clusters (SDC)
In statistics, the standard deviation is a summarized measure of the differences of each observation from the mean. We draw on the notion of standard deviation in our work to measure the compactness of the data clusters after outliers have been removed. Generally, after a specific number of outliers are detected and removed from the dataset, the remaining dataset will be characterized by a smaller standard deviation for the clusters in the dataset. SDC is defined as the average standard deviation of all the points with respect to clusters in the dataset. The lower SDC is, the better qualities of the detected outliers are. To compute SDC, the data should be clustered. In our experiment, we use BIRCH to cluster the dataset. For details regarding BIRCH, interested readers please refer to [ZRL96].
1
)) ( ,
( 2
,
−
= ∈
∑
∈N
C Centriod p
Dist
SDC pi Dataset pi Cj
j i
(2) Precision of Outliers Detected
Precision is a commonly used metric used in information retrieval to test the accuracy of the retrieved items by the systems. Here, we use the notion of precision to test the accuracy of outliers detected by different outlier detection algorithms. Precision of outlier detected is defined as:
% 100 * _
Pr Re
n top N ecision = levant
where NRelevant denotes the number of outliers been correctly detected. The higher precision is, the better qualities of the detected outliers are.
7.2 Effectiveness Evaluation
By using validation criteria of SDC and precision, we will evaluate the effectiveness of Grid-ODF, LOF and KNN-distance methods in this section. We first perform top_n
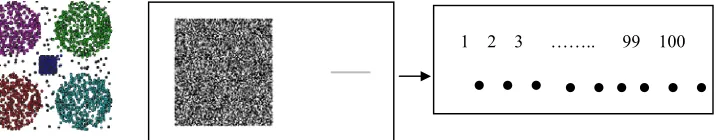
outlier detection in two 2-d synthetic dataset using Grid-ODF, LOF and KNN-distance, and then compute SDC of the first dataset after top_n outliers have been removed and precision of the detected outliers from the second dataset. This first synthetic dataset (Dataset 1) contains five clusters: four circle-shaped clusters aligned in the periphery and a square-shaped cluster in the center (see Figure 4). The size of this dataset is 20,000 and there is a presence of outliers with 1% of the dataset size. The second dataset (Dataset 2) is characterized by a square cluster of 100,00 points and 100 outliers aligned in a horizontal line (see Figure 5). The top_n is increased from 10 to 100.
[image:8.595.139.497.612.682.2]
1 2 3 …….. 99 100
Figure 6 shows the results of the comparative studies of these three algorithms in terms of SDC in Dataset 1. Because it takes into account of both factors of density and distance in its outlier formulation, Grid-ODF outperforms LOF and KNN-distance in terms of SDC (the value of SDC of Grid-ODF is always less than that of LOF and KNN-distance for any given top_n from 10 to 100). This experiment verifies that Grid-ODF achieves better detection of top_n outliers compared to LOF and KNN-distance in terms of compactness enhancement of data points in the data space.
Secondly, we will study the precision of the three algorithms in detecting outliers from Dataset 2. The parameter MinPts used in LOF and parameter k used in KNN-distance are both set at 30 (a commonly used parameter value). Recall that the number of relevant outliers detected (i.e. Nrelevant) is required to compute the precision. An advantage of Dataset 2 is that the outlying degree ranking of the top 100 points can be easily decided and the top 100 outliers are the points in the set of {100th, 99th, 98th,…3rd,2nd, 1st} aligned
[image:9.595.311.451.385.500.2]in the line, with the descending order of outlying degree. This can be used to compare the results of the outlier detection algorithms and obtain the value of Nrelevant. From Figure 7, we can see that Grid-ODF achieves the highest precision in almost all cases. The average precision of Grid-ODF is 85.9%, which remarkably higher than 60.4% of LOF and 59.9% of KNN-distance.
Figure 6. SDC of Grid-ODF, LOF and KNN-distance
Figure 7. Precision of Grid-ODF, LOF and KNN-distance
7.3 Efficiency Evaluation
[image:9.595.141.299.385.504.2]expensive because the number of dense cells is often much smaller. In Figure 8, we also investigate the scalability of Grid-ODF with regard to dimensionality. The dimensionality is set at 2 and 20 respectively. From the figure, we can see that the curve of Grid-ODF exhibits a linear progression even in higher dimensional scenario, showing that Grid-ODF is well dimensionally scalable.
Figure 8. Runtime of Grid-ODF, LOF and KNN-distance
8. Conclusions
In this paper, we have proposed a novel outlier mining algorithm, called Grid-ODF, that takes the advantage of both the local and global perspectives in detecting outliers. The observations on how human perceive outliers is presented attempting to make our formulation of outliers match the natural way human perceive outliers. Taking into account of these observations, the notion of Outlying Degree Factor (ODF), that integrates the factors of both density and distance, is introduced to rank outliers. We have also illustrated how to efficiently implement Grid-ODF by using the technique of grid-based data space partition. Experimental results show that Grid-ODF outperforms existing outlier detection algorithms such as LOF and KNN-distance in terms of both effectiveness and efficiency.
References
[AGGR99] R. Agrawal, J. Gehrke, D. Gunopulos, and P. Raghavan. Automatic Subspace Clustering of High Dimensional Data Mining Application. In proceeding of ACM SIGMOD’99, Philadelphia, PA, USA, 1999.
[BL94] V. Barnett and T. Lewis. Outliers in Statistical Data. John Wiley, 3rd edition, 1994.
[BKNS00] M. Breuning, H-P, Kriegel, R. Ng, and J. Sander. LOF: Identifying Density-Based Local Outliers. In Proceeding of 2000 ACM International Conference on Management of Data (SIGMOD’00 ), Dallas, Texas, 2000. [EKSX96] M. Ester, H-P Kriegel, J. Sander, and X.Xu. A Density-based Algorithm for
Discovering Clusters in Large Spatial Databases with Noise. In proceedings of 2nd International Conference on Knowledge Discovery and Data Mining (KDD’96), Portland, Oregon, USA, 1996.
[HK00] J. Han and M. Kamber. Data Mining: Concepts and Techniques. Morgan Kaufman Publishers, 2000.
[HK98] A. Hinneburg, and D.A. Keim. An Efficient Approach to Cluster in Large Multimedia Databases with Noise. KDD’98, 1998.
[JTH01] W. Jin, A. K. H. Tung , J. Han. Finding Top_n Local Outliers in Large Database. In Proceeding of 7th ACM SIGKDD International Conference on Knowledge Discovery and Data Mining (SIGKDD’01), San Francisco, CA, August, 2001.
[KN98] E. M. Knorr and R. T. Ng. Algorithms for Mining Distance-based Outliers in Large Dataset. In Proceeding of 1998 International Conference on Very Large Database (VLDB’98), pages 392-403, New York, NY, August 1998. [KN99] E. M. Knorr and R. T. Ng. Finding Intentional Knowledge of
Distance-based Outliers. In Proceeding of 1999 International Conference on Very Large Database (VLDB’99), pages 211-222, Edinburgh, Scotland, 1999. [NH94] R.Ng and J.Han. Efficient and Effective Clustering Methods for Spatial
Data Mining. In proceedings of the 20th VLDB Conference, pages 144-155, 1994.
[PS88] F. Preparata and M. Shamos. Computational Geometry: an Introduction. Springer-Verlag, 1988.
[RRK00] S. Ramaswamy, R. Rastogi, and S. Kyuseok. Efficient Algorithms for Mining Outliers from Large Data Sets. In Proceeding of 2000 ACM International Conference on Management of Data (SIGMOD’00 ), Dallas, Texas, 2000.
[RR96] I. Ruts and P. Rousseeuw. Computing Depth Contours of Bivariate Point Clouds. Computational Statistics and Data Analysis. 23: 153-168, 1996. [SCZ99] G. Sheikholeslami, S. Chatterjee, and A. Zhang. WaveCluster: A Wavelet
based Clustering Approach for Spatial Data in Very Large Database. VLDB Journal, vol.8 (3-4), 289-304, 1999.