Abstract: White blood cells (leucocytes)are main constituents of blood, plays a major role in immune system. They rescuing our body from foreign materials and infectious diseases. All five types of WBCs are origin from multipotent cell bone marrow also called hematopoietic stem cells. These five types are grouped into granulocytes and agranulocytes. Leukemia a blood cancer occur due to abnormal development of leukocytes(WBCs). In united states 62130 people receive leukemia diagnosis in 2017 and 24500 deaths occurs by this disease its effects are even more in undeveloped countries. Counting and identifying of white cells in images of microscope is so tedious , time taking and the results depends on experience of hematologist. The proposed algorithm is a combination of spectral-spatial method for segmenting cytoplasm and nucleus of WBCs from the microscopic, spectral and hyperspectral images. Here we use an Integrated method of improved spectral angle mapper(ISAM) with Gram-Schmidt orthogonalization process and k-means segmentation process. The resulting spatial spectral information of WBCs gives an accuracy of above 95% for both nuclei and cytoplasm.
Keywords: white blood cell, improved spectral angle mapper, orthonormal set
I. INTRODUCTION
Analysis of microscopic blood cells is a powerful tool of diagnose the blood related diseases. Among three main constituents of blood cells, Leukocyteshavenucleus. Its diameter range is 6µm to 20µm, and they play major part in immune condition of the body. They fight against cancer cells and other toxic materials. Hematologist set a valuable information by identifying and inspecting the WBCs in peripheral blood smear. So it is easy to diagnose the disease like blood cancer i.e. leukemia and such diseases of WBC. But blood study manually under microscope is a delayed, subjective and tedious, results is mainly based on the skill of the technician and his experience.
Rapid development in the field of information science, tends to automate of WBC analysis depends on digital image processing, identification of pattern approaches. This computer-aided method is used in pointing out, and computation of white cells of cytological blood images.
Revised Manuscript Received on May 22, 2019.
PuttamadeGowda. J, Research Scholar, Dept. of Electronics Engg, Jain University, Bengaluru
Prasanna Kumar S C, Professor, Dept. of Electronics & Instrumentation, R V College of Engg. Bengaluru
In fast one to one and half decades many researcher can develop different algorithm for segment and identify different parameters about WBCs from microscopic blood smear images.
II. RELATED WORK
Many research works are going on segmentation and detection of WBC from blood images. In Hayan T madhloom et.al [1] work localization and segmentation of lymphoblast by morphological reconstruction process. Subrajeet mohapatra et.al [2] propose image segmentation using shadowed C-means(SCM) clustering method. They compare the tested result with other classifier like Navie Bayesian, KNN, MLP, RBIN and SVM.
Qing Li et.al[3] separate the cytoplasm and nucleusof WBC from spectral and hyperspectral images using pixel-wise ISAM segmentation then they apply majority voting method for within snakes regions.
Doriniet.al [4], uses three different methods for separating cytoplasm and nucleus of WBCs. To remove background they use bottom-hat transform, flood-fill operation for remove RBCs and for extracting segmented nucleus they use Watershed transform algorithm. For extracting the same Baidya Nath shah et.al[5] apply PCA followed by active contour (snake) algorithm.
In S.Mohapatra et.al [6],for obtaining WBC they use a fuzzy based color segmentation process, use contour signature and Hausddorff dimention for classifying nucleus. In our work[7] for extracting nucleus we use a combined technic of fuzzy c with snake and get the better result than above work and also count the number of WBC in a given image.
S.H.Rezafotighi et al [8], and M. Mohamed [9] et al applies Gram-Schmidt orthogonalization algorithm for segmenting the nuclei of WBC. In our second work[10] ,[11] we use the same technic and get a orthonormal image and using K-means segmentation we get nuclei of white blood cells and classify according to their charecteristics. Like different researcher uses different technics for extracting WBC from its imges. M.Y.Mashor et al [12], adopts global contrast stretching algorithm and use HSI color segmentation process for improving the quality of image.
Segmentation of White Blood Cells using
Integrated Process of Improved Spectral Angle
Mapper, Gram-Schmidt Orthoganalization with
K-Means Clustering
By using watershed algorithm and optimal threshold system E.A.Mohamed et al [13] segmenting the nuclei of lymphocyte.LeYuet.al [14] choose HIS color-space succeeded by threshold segmentation for detecting nucleus and for detecting cytoplasm by using region growing for color information.
M.Y.Mashor, F.U.Francis et.al[15]apply partial contrast stretching procedure for image enhancement succeeded by image segmentation. For extract WBCs features and screening the image using MLP.
M.Y.Mashor [16]applies two procedures, In their initial part enhance white blood cell region they use contract enhancement method on suspected leukemia images and in next part they apply HSI color space image segmentation process.
Monica Madhukar, Anyony.T.C et al [17] shows microscopic images by exposing color correlation, contrast enhancement followed by K-means clustering method on resultant images, from this they detecting nucleus.
Fabio Scotti[18]apply Fuzzy K-means clustering on microscopic image there by eliminating unwanted images and enhance the required image of WBC.
D.C.Haung et al [20]by using Otsu‟s threshold method for extracting nucleus of white cells, for texture measurement they use co-occurrence matrix. In their work they clearly differentiate five types of leucocytes by considering available features from principal component analysis(PCA).
The five types of leucocytes are.
Neutrophils:-very popular among all five types, counts of 50-70% of all white cells, circulatory, short lived having minute light granules. These are multi-lobed nucleus and each lobe is interconnected by a thin strands. Strands are made of nuclear material.
Eosinophil:-granulocytes cells, large granules, pink or red in color.These cells having two lobes in each nucleus, their counts are less than 5% count of leukocytes.
Basophils:-these cells having large number of granules,. When stained they appear purple or deep blue in color. Their presence is less than 1% of white cells.
Lymphocytes:- these agranular cells having well developed cytoplasm, when stained looked pale blue. The nucleus covers whole cell surrounded by a small rim of cytoplasm. Their counts are 25-35% of leukocytes.
Monocytes:- they have large nucleus, and agranular cells. Nucleus have „U‟ shape or kidney been shape, they have abundant cytoplasm of light blue in color and their counts are 3-4% of WBCs.
III. METHODOLOGY
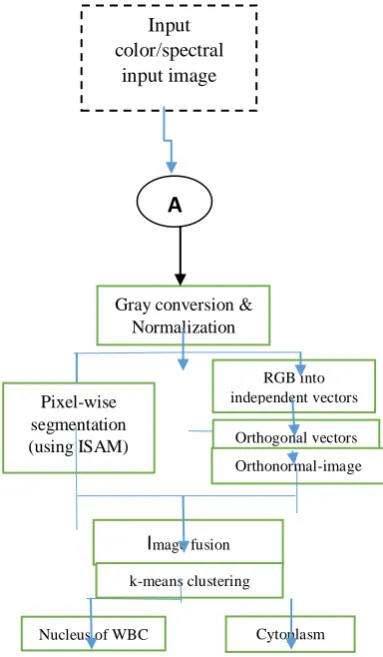
Fig.1 shows the architecture of proposed system, initially the image is converted into gray-scale in preprocessing, followed by noise will filtered using median filters and normalization is takes place.
A.Pre-processing.
[image:2.595.321.513.52.381.2]B. Gray conversion:- Processing time of RGB input color image is more compared to its equalent gray image. So it is necessary for convert RGB to gray.
Fig. 1 algorithm of segmentation of WBC nucleus and cytoplasm
Filtering:-Median filter filters every pixel in an image from its neighboring pixels. Then decides the pixel belongs to surrounding or not. This filter replaces each pixel value by median value of neighboring pixel, thereby sorting neighborhood pixels in numerical order. Middle most sorted value is taken by pixel value retained it as median value. A window will formed by neighboring pixels. Windows takes different shapes and centered around desired pixels.
A median value is calculated by
𝑚𝑒 𝑌 =
𝑌(𝑚 +1)= 𝑌(𝑛) 𝑓𝑜𝑟 𝑁 = 2𝑚 + 1 1
2 𝑌(𝑚 )+ 𝑌(𝑚 +1) 𝑓𝑜𝑟 𝑁 = 2𝑚 (1)
Then normalization is done as in our previous paper. Improved Spectral Angle Mapper :-
After getting Normalized molecular spectral images of the blood smear, to determine spectral similarity of these spectrum by calculating the angle between this with reference spectrum. In spectral image each selected pixel naming as unknown spectrum „a‟ and reference spectrum „b‟ taken from spectral library. The spectral angle between these two spectrums is calculated by
θ(a,b)=arccos[<𝑎,𝑏> 𝑎 𝑏 ]
= arcos{ 𝑎𝑖 𝑛 −1 𝑖=0 𝑏𝑖 𝑛 −1𝑖=0𝑎𝑖2 𝑛 −1𝑖=0𝑏𝑖2
} ………..(2)
Gray conversion & Normalization
Pixel-wise segmentation (using ISAM)
RGB into independent vectors
Orthogonal vectors
orthoganalizaton Orthonormal-image
Image fusion k-means clustering
Nucleus of WBC Cytoplasm
A
Input color/spectral
To rectifying noise there by reducing the wavelength shift error, Spectral angle calculated between test and reference spectrum, we adopt Improved Spectral Angle Mapper (ISAM) method in which, we calculate spectral angle by move backward and forward 2 bands respectively. Then select maximum angle as the spectral angle between two vectors.
Gram-Schmidt orthoganalization
process:-This process takes a linearly independent, finite set S={b1,
b2, ………bk} for k<n and generating an
orthonormal set S‟= {d1, d2, ………dk} both are
same span and inner product space generally called Euclidean space Rn.
The projection operator is defined as Projd b =
<𝑑.𝑏 >
<𝑑 .𝑑>.d = <d,b> 𝑑
<𝑑,𝑑 >……….. (3)
Where <d.b> …….. inner product of d & b. The operator projects „b‟ vector orthogonally on to „d‟ vector.
It works as follows
d1 = b1 e1 =
𝑑1 𝑑1
d2 = b2 - 𝑝𝑟𝑜𝑗𝑑1b2 e2 =
𝑑2 𝑑2
d3 = b3 - 𝑝𝑟𝑜𝑗𝑑1b3- 𝑝𝑟𝑜𝑗𝑑2b3e3 =
𝑑3 𝑑3 ..
dn = bk - 𝑘−1𝑗 =1𝑝𝑟𝑜𝑗𝑑𝑗 bkek =
𝑑𝑘 𝑑𝑘
here d1, d2, ……….dn is orthonormal
vectors and e1, e2 ……….ek forms a orthonormal
set. Using this method, from linearly independent set S={b1, b2, ………bk} we select one vector „ bk „
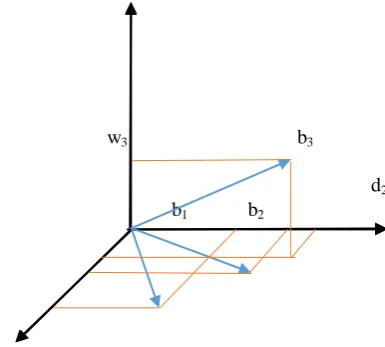
which is maximum orthogonal and remove all other vectors which are minimum orthogonal over N-dimensional space. The required vector Wk is given by
Wk = bk - 𝑘−1𝑗 =1𝑝𝑟𝑜𝑗𝑏𝑗 bk
So the result ‟ Wk„ from inner product of set „s‟ is
< 𝑏𝑗. 𝑤𝑘 > = 0 𝑗𝜖 1,2 … … 𝑛 𝑎𝑛𝑑 𝑗 ∉ 𝑘 < 𝑏𝑘 . 𝑤𝑘 > = 𝑘 𝑘 ≠ 0
…(4)
In fig. below shows the relation between w3& b1, b2 and b3
is graphically shown in 3-D spaces d3
w3 b3
d2
b1 b2
Segmentation of image by K-means clustering:
Clustering means divides the data as a similar groups. Among different types of clustering we choose a partitional clustering, in which the integrated squared Euclidian distances of the samples in a cluster and center of the cluster
is known as with in cluster variation. This cluster variation criterion is used for our work.
The steps followed in k-means clustering are 1. Set the groupof cluster K and centroid µm.
2. Every pixel is assigned to the group of closest centroid.
3. Centroids is again calculate once all pixels were assigned.
4. Repeat steps 2 and 3until no change of centroidsoccur. Algorithm of minimization is given by
Q = 𝑘𝑚 =1 𝑛𝑖=1 𝑣𝑖𝑚− µ𝑚 2
Where vim is the ith sample of mth class of km and µmmth
cluster center defined as mean of viϵ km. .
IV. RESULTS AND DISCUSSION
The blood smear hyperspectral or microscopic spectral images are taken as input images. Initially these images required filter and normalization. Then suitable spectral image as explained by ISAM procedure as explained above. After that select a ortho-normal vector by using Gram-Schmidt orthoganalizing procedure to above image. Then by applying K-means clustering on these orthonormal image we get a perfectly accurate cytoplasm and nucleus of white blood cells.d1
a) input image
b) grayscale image
[image:3.595.51.244.534.707.2]c) ISAM image
d) ortho-normal image
e) K-means clustered image
f) Nucleus of WBC
[image:4.595.96.244.49.304.2]g) Cytoplasm of WBC
Fig. 3 Test image with Intermediate Results
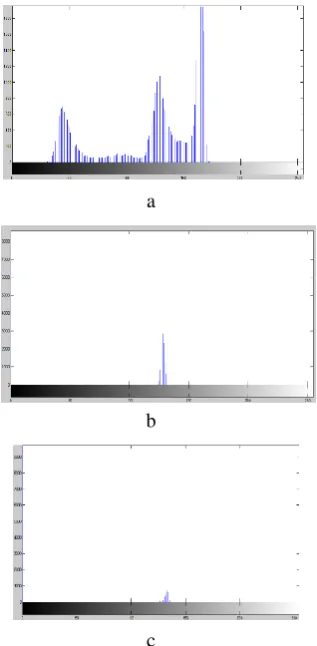
In the above result we can clearly separate the nucleus and cytoplasm of white blood cell of input image. The fig.3(a) is input image , fig3(b) is its grayscale equalent fig 3(c) shows resultant image of ISAM method, fig 3(d) is an ortho-normal image selected from Gram-Schmidt orthogonalization process fig 3(e)shows the K-means clustered image whereas fig 3(f) and 3(g) shows Nucleus and cytoplasm of WBC respectively. The result can be clearly explained by Histogram shown in fig 4. Histogram of input image is shown in fig 4(a) with histogram of nucleus and cytoplasm is shown by fig 4(b) and 4(c)respectively.
a
b
[image:4.595.351.510.199.523.2]c
Fig. 4 histogram of a) input grayscale image b) nucleus of WBC & c) cytoplasm of WBC
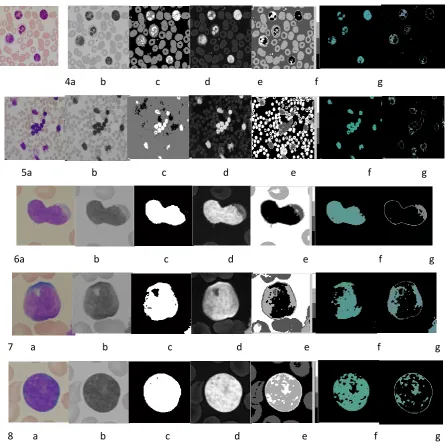
2a b c d e f g
4a b c d e f g
5a b c d e f g
6a b c d e f g
7 a b c d e f g
8 a b c d e f g Fig. 5 Result from the proposed system for different images. a-original input images. b- gray scale imagesc- image from ISAM process. d- ortho-normal image selected from Gram-schmidth. e- k-means clustered image f- Ncleus
of WBC g- Cytoplasm of WBC. Method evaluation:-
Presence of Blast cell can be identified in input image by these steps: a)Identification of WBCs in an image.b) Lymphocyte selection. c) classified as tumor cell. The proposed benchmark has following test.
Cell test :- each single cell tested as blast or not.
Image level : - the image test is positive if we findat least one blast cell in an image.
For all Benchmark the following terms are used.
True positive(TP) : Number of correctly classified positive element by test.
True negative(TN) : number of correctly classified negative element by the test.
False positive(FP, type 1 error.) : the number of element by the test classified as positive but they are not.
False Negative(FN, type2 error): the number of elements by the test classified as negative but they are not. Using above definitions we process the following parameters: accuracy, Error rate, specificity, sensitivity,
[image:5.595.73.519.46.490.2]false positive and false negative rate. The performance evaluation is tabulated as below.
Table. 1 Performance Evaluation
parameters Formula Result in
% Accuracy (TN+TP)/(TN+TP+FP+FN) 98.38 Error rate (FN+FP)/(TN+TP+FP+FN) 1.62
Sensitivity TP/(FN+TP) 96.23
Specificity TN/(FP+TN) 98.10
False Negativerate
FNR=FN/(TP+FN) 3.25
False positiverate
V. CONCLUSION
For diagnose the disease in medical field segmentation of WBC plays a vital role. It is common test to know the condition of WBC of the patient for provide him a proper treatment. Segmentation manually requires more resources and the results depends on the experience of the hematologist. So these automated segmentation will proposed in this Improved Spectral Angle Mapper, Gram-Schmidt orthoganlization, K-means segmentation process are used to get the spatial and spectral characteristics of the images by that we get a more better result than previous work.
REFERENCES
1. Madhloom HT, Kareem SA, Arifflin H “An Imageprocessing application for the localization and segmentation of lympoblast cell using peripheral blood images“ Journal of medical system 2012 Aug:36(4)-2149-58, Doi:10.1007/s 10916-011-9679-0.
2. Subrajeet Mohapatra, Kundan kumar, Dipti patra, “ Fast leukocytes imagesegmetation shadowed sets” in International journal of computational biology and drug design” 5(1):49-65. March 2012 DOI: 10.1504/IJCBDD 2012-045951.
3. Qingly Li, Hongying Liu, Fangmin Guo “A CombinedSpatial-Spectral Method for Automated White blood cells Segmentation” Optics and Laser Technology 54(2013) 225-231, ELSEVIER.
4. Leyza Baldo, Dorini, and N.J.Leite, “Semiautomatic White Blood Cell Segmentation Based on Multiscale Analysis” ,IEEE Journal of BIOMEDICAL AND HEALTH informatics, vol.17, No.1, January 2013, pp-250-257.
5. Baidya nath shah, Nilanjan Ray, and Hong Zhang, “Snake Validation: A PCA Based outlier detection method.” IEEE signal processing letters, vol.16, No.6, june-2009, pp. 549-553.
6. S.Mohapatra, Dipti patra and S.S.Samanta, “Fuzzy Based Blood Image Segmentation for Automated Leukemia Detection‟ IEEE 2011. 7. Puttamadegowda J, Dr. Prasannakumar S C “White blood cell
Segmentation using Fuzzy C Means and Snake” 2016 International conference on Computational system and International System for Sustainable Solution 2016 IEEE 47-52.
8. S.H.Rezotofigi, R.Sharifian, R.A.Zoroofi, “A New Approach to White Cell Nucleus Segmentation Based on Gram-Schmidt Orthogonalization.” International conference on Digital Image Processing.2009 IEEE, PP-107-111.
9. Mostafa Mohamed, B.Far, “A Fast Technique for White blood cells Nuclei Automatic Segmentation Based on Gram-Schmidt Orthogonalization”, 2012 IEEE 24th International Conference on tools with Artificial intelligence, pp-947-952.
10.Puttamadegowda J, Prasanna kumar S C, “segmentation of white blood cell using K-means and Gram-schmidt orthogonalization” Indian journal of science and technology Vol 10(6), DOI: 10.17485/ijst2017/v10i6/111137,feb-2017.
11.Puttamadegowda J, Prasanna kumar S C “ WBC segmentation using Gram-Schmidt Orthogonalization and Improved Spectral angle Mapper” Journal of advanced research in dynamical and Control System” vol 9. Sp-12/2017.
12.N.H.Abd.Halim, M.Y, Mashor, and H.Rosline, “Nucleus segmentation technique for acute leukemia”. 2011 IEEE 7th International Colloquium on Signal processing and its applications, pp.192-197. 13.E.A.Mohammed, H.Mohamed, B.H.Far,”Chronic Lymphocytic
leukemia cell Segmentation from Microscopic Blood imagesusing watershed algorithm and optimal Thresholding”, 2013, 26th IEEE Canadian conference of Electrical and Computer engineering”. 14.JunDuan, and Le Yu “A WBC Segmentation Based on HIS
colorspace”, proceedings of IEEE IC-BNMT 2011, pp-629-632. 15.E.U.Francis, M.Y.Mashor, R.Hassan “Screening of Bone marrow slide
images for Leukemia using multilayer perceptron”, 2011 IEEE Symposium on industrial electronics and applications, pp-643-648. 16.Aimi Salihah, M.Y.Mashor, N.H.Harun, H.Rosaline, „Improving colour
Image Segmentation on Acute Myelogenous Leukemia using Contrast Enhancement Techniques”, 2010 IEEE EMBS conference on Biomedical Engineering & sciences, Kuala Lumpur, pp.- 246- 251. 17.Monica Madhukar, S.Agaian, Antony.T.C, “Deterministic model for
Acute Myelogenous Leukemia Classification”, 2012 IEEE
International conference on systems, man and Cybermetics, Seoul, Korea, pp-433-438.
18. Fabio Scotti “Robust Segmentation and Measurements Techniques of white cells in Blood Microscopic Images”, IMTC 2006 Instrumentation and Measurement Technology Conference, Italy, IEEE 2006, pp-43-48. 19. R.C.Gonzaleza, R.E.Woods, and S.C.Eddins “Digital Image Processing Using Matlab”, Pearson prentice hall, Pearson Education, Inc., New Jersey, USA 2004.