ESTIMATION OF DECITABINE IN PHARMACEUTICAL DOSAGE
FORM BY RP-HPLC METHOD
Dissertation work submitted to The Tamilnadu Dr. M.G.R Medical University, Chennai in partial fulfilment for the award of degree of
MASTER OF PHARMACY
IN
Pharmaceutical Analysis
Submitted by
PRABAHARAN.P
Reg. No: 261330662
Under the guidance of
Institutional Guide: Industrial Guide:
Dr.W.D.SAM SOLOMON,M. Pharm Ph.D., Dr.HASHIM.K.M
Professor & Head Director,U Win Life Sciences
Department of Pharmaceutical Analysis, Moonampadi,Malappuram
RVS College of Pharmaceutica l Sciences, Kerala-676505
Sulur, Coimbatore – 641 402
May – 2017
DEPARTMENT OF PHARMACEUTICAL ANALYSIS,
RVS COLLEGE OF PHARMACEUTICAL SCIENCES,
Date : 11thFeb 2017
CERTIFICATE
This is to certify that MR.PRABAHARAN. P who is studying Second Year M.Pharmacy Analysis in RVS college of Pharmacy, is doing his Project in our Laboratory u win life Sciences Malapuram, Kerala with specification of METHOD DEVELOPMENT AND VALIDATION FOR THE
ESTIMATION OF DECITABINE IN PHARMACEUTICAL DOSAGE
This is to certify that the dissertation work entitled “Method Development and validation for the estimation of Decitabine in pharmaceutical dosage form by RP-HPLC” is a bonafide work of Mr.PRABAHARAN. P carried out in U Win Life sciences,malappuram,,kerala under my guidance and supervision of Dr.Hashim .K.M,Director,U Win life sciences for the partial fulfillment of the award of degree of Master of Pharmacy in Pharmaceutical Analysis, RVS college of Pharmaceutical Sciences, Sulur, Coimbatore, affiliated to The Tamilnadu Dr. M.G.R Medical University, Chennai.
Dr.W.D.SAM SOLOMON,M.Pharm,PhD
Date:
Certificate
This is to certify that the dissertation work entitled “Method Development and validation for the estimation of Decitabine in pharmaceutical dosage form by RP-HPLC” is a bonafide work of Mr.PRABAHARAN. P carried out in U Win Life science,malappuram,,kerala under my guidance and supervision of Dr.Hashim .K.M, Director ,U Win life sciences and the guidance of Dr.W.D.Sam Solomon in the department of Pharmaceutical Analysis, for the partial fulfillment of the award of degree of Master of Pharmacy in Pharmaceutical Analysis, RVS college of Pharmaceutical Sciences, Sulur, Coimbatore, affiliated to The Tamilnadu Dr. M.G.R Medical University, Chennai.
Dr.R. VENKATANARAYANAN,M.Pharm,Ph.D
Date:
This is to certify that the dissertation entitled Method Development and validation for the estimation of Decitabine in pharmaceutical dosage form by RP-HPLC” is a bonafide work of Mr.PRABAHARAN. P ,RVS College of Pharmaceutical Sciences, Sulur,Coimbatore, for the partial fulfillment of the University rules and regulations for the award of Master of Pharmacy in Pharmaceutical Analysis under my guidance and supervision during the academic year 2016-17
Dr.W.D.SAM SOLOMON,M.Pharm,PhD
Evaluation Certificate
Dissertation title : “Method Development and validation for the estimation of
Decitabine in pharmaceutical dosage form by RP-HPLC”
Name of the Candidate : Mr.PRABAHARAN.P
Course of study : Master of Pharmacy in Pharmaceutical Analysis
Institution Name : RVS college of Pharmaceutical Sciences, Sulur,
Coimbatore
INTERNAL EXAMINER EXTERNAL EXAMINER
Date: Date:
The secret of success is undaunted ardour, motivation, dedication, confidence on self and above all the blessings of God. I bow in reverence to the Almighty for bestowing upon me all this kindness that has helped me throughout the journey of my life. Success is an outcome of collaborated efforts aimed at achieving different goals. I hereby take this opportunity to acknowledge all those who have helped me in the completion of this dissertation work.
First and foremost I thank to my God for my successful completion of this work.
I sincerely acknowledge my deep sense of gratitude and hearty thanks toDr. W.D. Sam Solomon, M.Pharm., PhD., Professor and HOD, Department of Pharmaceutical Analysis, RVS College of Pharmaceutical Sciences, Sulur, Coimbatore, for his valuable guidance encouragement and continued support throughout the course of this work.
I express my sincere thanks to Dr. HASHIM.K.M,Director, U Win Life Sciences for providing the facilities to carry out my project work in this esteemed organization.
I am highly indebted to Dr. R. Venkatanarayanan, M.Pharm.,Ph.D.,
Principal, RVS College of Pharmaceutical Sciences, Sulur, Coimbatore, for providing necessary laboratory facilities, encouragement and continued support throughout the course of this work.
With great pleasure I am thankful to Dr.Vijaianand,M.Pharm., PhD,
I express my sincere thanks to Mr.P.Kumar Nallasivan, M.pharm
professor, Department of Pharmaceutical Analysis for their valuable advices,help and support during my academic and project work.
I express my thanks to my friends for their help and moral support in the successful completion of this project work.
I convey my sincere thanks to all the staff members of RVS college of pharmaceutical Analysis who have contributed to my thesis work.
Words have no power to pay regards to my most beloved parents,who sacrificed a lot for my welfare and brought me up to this esteemed stage.I expressed my love and gratitude to my father and other family members for their endless love and sincere prayers through the duration of my studies
PRABAHARAN.P
Sl.NO TOPIC PAGE NO
LIST OF TABLES
LIST OF FIGURES
LIST OF ABBREVIATIONS
1. INTRODUCTION
1.1 High Performance Liquid Chromatography 1
1.2 Types Of HPLC 3
1.3 Instrumentation of HPLC 8
1. 4 Introduction to Method Development 16
1.5 Method Development Using HPLC 17
1.6 Parameters Affecting Changes in
Chromatograph 24
2. REVIEW OF LITERATURE
2.1 Literature Review 41
2.2 Drug Profile 43
3. AIM AND PLAN OF WORK
3.1 Aim and Objective 44
3.2 Plan of Work
4 MATERIALS AND METHODS 45
5. RESULT AND DISCUSSION 47
6. SUMMARY & CONCLUSION 72
RVS College of Pharmaceutical Sciences
.
LIST OF TABLES
SL NO. TITLE Page
no
1 Types of HPLC based on polarity of stationary phase and
mobile phase.
4
2 Commonly used detectors and their application 14
3 Acceptance Limits for System Suitability Test. 24
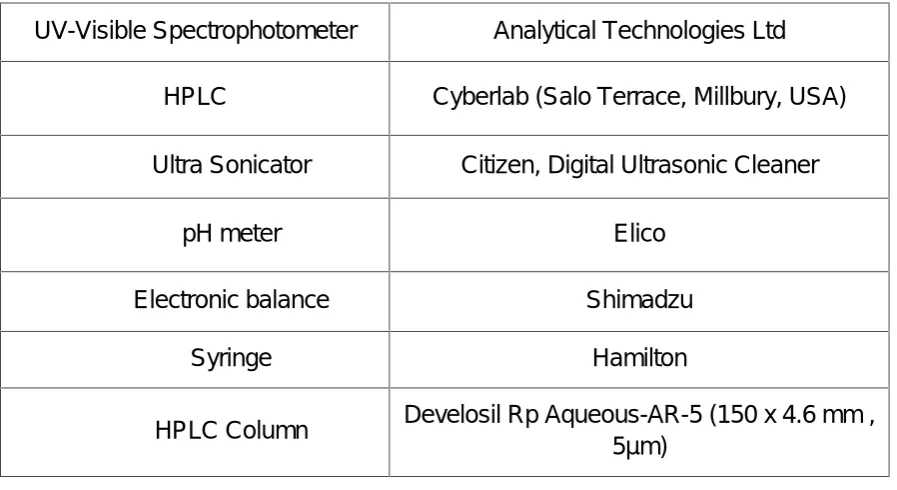
4 Instruments used 37
5 Chemicals and Solvents used. 45
6 Drugs used. 45
7 Solubility studies 46
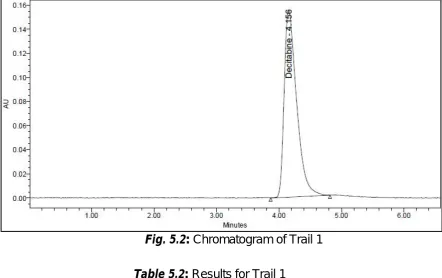
8 Results for Trail 1 47
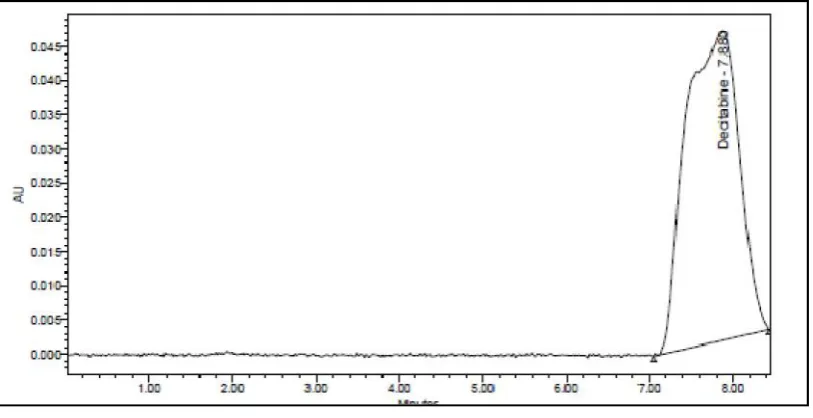
9 Results for Trail 2 49
10 Results for system precision 50
11 Linearity Preparations 51
12 Results for preparation 52
13 Results for preparation 54
14 Results for preparation 54
15 Results for preparation
16 Results for preparation 55
17 Linearity data of Decitabine 57
18 Observation for linearity 59
19 Results for standard 60
20 Results for formulation 61
22 Results for 100% Recovery 62
23 Results for 150% Recovery 62
24 Results for Recovery of Decitabine 63
25 Chromatogram of mobile phase composition 987:13 63
26 Results of mobile phase composition 987:13 64
27 Results of mobile phase composition 983:17 65
28 Results of wavelength from 244 to 246 nm 69
29 Results of wavelength from 244 to 242 nm 69
RVS College of Pharmaceutical Sciences
.
LIST OF FIGURS
SL .NO TITLE Page NO.
1 Schematic diagram of instrumentation of HPLC 9
2 Flow Path of a Manual Injector. 11
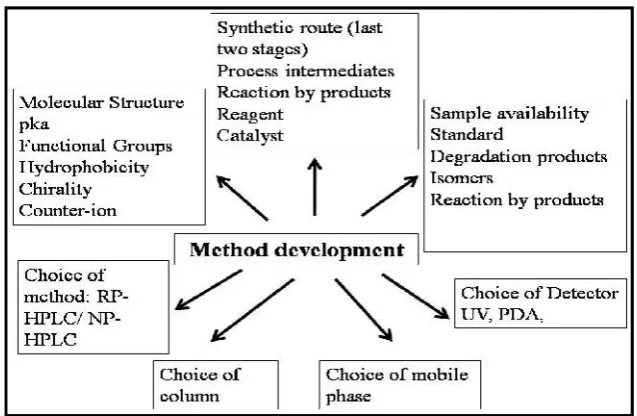
3 Outline of the process involved in method development 23
4 Flow rates for column with different internal diameter 27
5 Pictorial Representation of number of theoretical plates. 28
6 Pictorial Representation of Resolution 29
7 Pictorial representation of selectivity factor 30
8 Pictorial representation of peak asymmetry 30
9 Pictorial representation of peak asymmetry 31
10 Chemical structure of Decitabine 43
11 UV-VIS Spectrum of Decitabine 48
12 Chromatogram of Trail 1 49
13 Chromatogram of Trail 2 50
14 Chromatogram of Trail 3 51
15 Results for Trail 3 54
16 Chromatogram of Decitabine 56
17 Results for Decitabine 58
18 Results of assay 60
19 Results for system suitability of decitabine 61
20 List of Chromatograms for system precision 61
22 Results for method precision 62
23 Chromatogram of linearity for preparation 63
24 Chromatogram of linearity for preparation 65
25 Chromatogram of linearity for preparation 65
26 Chromatogram of linearity for preparation 66
27 Graph for Linearity data of Decitabine 63
28 Chromatogram of standard 65
29 Chromatogram of formulation 65
30 Chromatogram of 50% recovery 66
31 Chromatogram of 100% recovery 67
32 Chromatogram of 150% Recovery 67
33 Chromatogram of mobile phase composition 983:17 68
34 Chromatogram of wavelength from 244 to 246 nm 69
RVS College of Pharmaceutical Sciences
.
LIST OF ABBREVIATIONS USED
% Percentage
0
C Degree Celsius
AMA Antimicrobial agent
ANDA Abbreviated New Drug Applications
ARM absorbance ratio method
BLA Biologics License Applications
CAS No Chemical Abstract service Number
CV Coefficient of variation
D0 Zero order
D1 First Derivative
D2 Second serivative
FDA Food and Drug ADMINISTRATION
GFC Gel Filtration chromatography
GPC Gel permeation chromatography
HILIC Hydrophilic interaction chromatography
HPTLC High Performance Thin layer Chromatography ICH International Conference on Harmonisation
L Lit
LIN Linezolid
LOD Limit of Detection
LOQ Limit of Qualification
M Molarity
mg Milligram
mM Millimole
NPC Normal phase chromatography
ng/ul Nano Gram per micro litre
NDA New Drug Applications
No. number
ODS Octa Decyl Silence
OPA Ortho Phosphoric Acid
PDA Photo Array Detector
ppm Parts per million
QC Quality control
R2 Correlation coefficient
Rf Retention factor
RPC Reverse phase chromatography
RP-HPLC Reverse phase High performance Liquid chromatography
RS Reference Standard
RSD Relative standard Deviation
S Slope
Sec Second
SEC Size exclusion chromatography
SFC Super critical fluid chromatography
V/v volume by volume
µI Microlitre
µg/ml Microgram per Millilitre
Chapter-I INTRODUCTION
Page 1
Chapter 1: INTRODUCTION
A drug includes all medicines intended for internal or external use for or in the diagnosis, treatment, mitigation or prevention of disease or disorder in human beings or animals, and manufactured exclusively in accordance with the formulae mentioned in authoritative books.1
Pharmaceutical analysis is a branch of chemistry involving a process of identification, determination, quantification, purification and separation of components in a mixture or determination of chemical structure of compounds. There are two main types of analysis – Qualitative and Quantitative analysis.
Qualitative analysis is performed to establish composition of a substance. It is done to determine the presence of a compound or substance in a given sample or not. The various qualitative tests are detection of evolved gas, limit tests, color change reactions, determination of melting point and boiling point, mass spectroscopy, determination of nuclear half life etc.
Quantitative analysis techniques are mainly used to determine the amount or concentration of analyte in a sample and expressed as a numerical value in appropriate units. These techniques are based on suitable chemical reaction and either measuring the amount of reagent added to complete the reaction or measuring the amount of reaction product obtained the characteristic movement of a substance through a defined medium under controlled conditions, electrical measurement or measurement of spectroscopic properties of the compound.2
1.1 High Performance Liquid Chromatography
separated species appeared as colored bands on the column hence the name of the process (Greek chroma meaning “color” and graphein meaning “writing”).3
Chromatography is defined as a non- destructive procedure for resolving multi-component mixture of trace, minor, or major constituents into its individual fractions. In chromatography, the sample is dissolved in the mobile phase which may be a gas, liquid, or a supercritical fluid. The principle involved in HPLC is that when a mixture containing different compounds is introduced into the mobile phase and allowed to flow over a stationary phase, the individual compounds travel at different speeds and get separated based on the relative affinities to the stationary phase and the mobile phase. The compounds are separated based on the polarity of the stationary phase and the mobile phase.
Chromatography is of various types based on the physical state of the stationary and the mobile phase:
1. Solid - Liquid type: The stationary phase is a solid and the mobile phase is a liquid. Ex: Thin layer chromatography, High performance liquid chromatography (HPLC).
2. Liquid - Liquid type: The stationary phase is a liquid and the mobile phase is also a liquid. Ex: Paper Chromatography, HPLC.
3. Liquid - Gas Type: The stationary phase is a liquid and the mobile phase is a gas. Ex: Gas chromatography.
Chapter-I INTRODUCTION
Page 3
1.2 Types Of HPLC
HPLC is classified into various types
a) Based on polarity of stationary and mobile phase
Normal Phase Chromatography
Reverse Phase Chromatography b) Based on the principle of separation
Adsorption Chromatography
Partition Chromatography
Ion Pair Chromatography
Size Exclusion Chromatography
Chiral Phase Chromatography c) Based on elution technique
Isocratic Elution
Gradient Elution d) Based on scale of operation
Analytical HPLC
Preparative HPLC
1.2.1.a Based on the polarity of the stationary phase and the mobile phase, it is of two types:
Normal Phase (NP) HPLC
In this type, the stationary phase is polar and the mobile phase is non-polar, polar compounds are retained for a longer periods because of more affinity towards the stationary phase, hence non-polar compounds travel faster and are eluted first.
Reverse Phase (RP) HPLC
Table 1.1:Types of HPLC based on polarity of stationary phase and mobile phase.
1.2.1.b Based on the principle of separation, chromatography is divided into various types,
Adsorption chromatography
It is one of the oldest types of chromatography. The principle involved is adsorption. Adsorption is a surface phenomenon in which the separation mechanism depends on the difference in the polarity of various drug molecules. The more polar a molecule, the more strongly it will be adsorbed by a polar stationary phase. Similarly the more non-polar a molecule, the more strongly it will be adsorbed by a non-polar stationary phase.7, 8
During a surface adsorption chromatography process, a competition for stationary phase adsorption sites exists between the materials to be separated and the mobile phase. In a mixture, molecules of low polarity spend proportionally more time in the mobile phase than those molecules that are highly polar, which are retained for a longer period of time. Therefore the components of a mixture are eluted in order of increasing polarity.9
Partition Chromatography
The principle involved is partition in which the solute molecules distribute themselves between the mobile and the stationary phases. In partition chromatography the stationary phase is a non-volatile liquid which is held as a thin layer (or film) on the surface of an inert solid. The mixture to be separated is carried by a gas or a liquid as the mobile phase. With the use of
Types Normal Phase Reverse Phase
Stationary phase Polar Non polar
Mobile phase Non polar Polar
Compound eluted first Non polar Polar
Chapter-I INTRODUCTION
Page 5 be removed or dissolved. Therefore, the stationary liquid phase has to be chemically bonded to the solid bonding support such as silica gel, cellulose powder, or kieselguhr (hydrated silica). The solute molecules in the mobile phase move through the system at rates determined by their relative solubilities in the stationary and mobile phases.9, 10
Ion Exchange Chromatography
Ion Exchange Chromatography is based on the reversible interaction between a charged protein and an oppositely charged chromatography medium. Biomolecules such as proteins, peptides, nucleic acids with even small differences in net surface charge can be separated, and very high resolution is obtained by choosing the optimal ion exchanger and separation conditions. The net surface charge of a protein varies according to the surrounding pH. Typically, when the pH is above its isoelectric point, a protein will bind to a positively charged anion exchanger. Below its isoelectric point, a protein will bind to a negatively charged cation exchanger.
Anion and cation exchangers are classified as strong or weak, depending on how much the ionization state of the functional groups vary with pH. A strong ion exchanger has the same charge density on its surface over a broad pH range, whereas the charge density of a weak ion exchanger changes with pH. The selectivity and the capacity of a weak ion exchanger are different at different pH values. 11, 12
Size Exclusion Chromatography
Size Exclusion Chromatography is used extensively in the biochemical industry to remove small molecules and inorganic salts from valuable higher molecular weight products such as peptides, proteins and enzymes.
Chiral Phase Chromatography
In this type of chromatography, optical isomers are separated using chiral stationary phases. Two approaches for chiral separation are available, indirect, which utilizes derivatizing agents, and direct, which uses chiral stationary phases or chiral mobile phase additives.
In the indirect method, a racemic mixture is made to react with a chiral reagent to form a pair of diastereomers and then chromatographed using an achiral column. Because diastereomers possess different physiochemical properties, they can be separated in an achiral environment.
Direct separation of enantiomers on an achiral column using a chiral mobile phase additive is applied only in HPLC. In this method, enantiomeric separation is accomplished by the formation of a pair of transient diastereomeric complexes between racemic analyte and the chiral mobile phase additive. Chiral discrimination is due to differences in the stabilities of the diastereomeric complexes, solvation in the mobile phase, and/or binding of the complexes to the solid support.14
1.2.1.c Based on elution technique, chromatographic methods are of two types,
Isocratic Elution
Chapter-I INTRODUCTION
Page 7 Gradient Elution
A steady change of the mobile phase composition during the chromatographic run is called gradient elution. This is widely used technique when a sample contains components of a wide range of polarities. For a reverse phase gradient, the solvent starts out relatively polar and slowly becomes more non-polar. The gradient elution offers the most complete separation of the peaks, without taking much time. A sample containing compounds of a wide range of polarities can be separated by a gradient elution in a shorter time period without a loss of resolution in the earlier peaks or excessive broadening of later peaks.15, 16
Gradient elution also increases quasi-efficiency of the column. In the isocratic elution, the longer a component is retained, the wider its peak. In gradient elution, the tail of the peak is always under the influence of the stronger mobile phase when compared to the peak front. Thus, molecules on the tail of the chromatographic peak will move faster. This will tend to compress zone and narrow the resultant peak.16
1.2.1.dBased on the scale of operation, chromatography is of two types,
Analytical HPLC
In Analytical HPLC, quantitative and qualitative determination of a compound is done. It is the most widely used technique. In this method, the sample amount applied to the column is typically in the μg range or lower quantities. The mass ratio of compound to the stationary phase on the column is less than 1: 100000. Under these conditions good separations with sharp and symmetrical peaks are achieved. Recovery of samples is not possible as small quantities of the sample are used.17
Preparative HPLC
Preparative HPLC is used for the isolation and purification of valuable products in the chemical and pharmaceutical industry as well as in biotechnology and biochemistry. It starts in the µg range for isolation of enzymes in biotechnology (micro purification). For identification and structure elucidation of unknown compounds in synthesis or natural product chemistry it is necessary to obtain pure compounds in amounts ranging from one to a few milligrams. Larger amounts, in gram quantity, are necessary for standards, reference compounds and compounds for toxicological and pharmacological testing. Industrial scale or production scale preparative HPLC, that is, kg quantities of compound, is often done nowadays for valuable pharmaceutical products.17
1.3 Instrumentation of HPLC
The main components of HPLC are as given below and are schematically represented in Fig 1.1
1. Solvent Reservoir
2. Solvent Delivery System (Pump)
3. Injection Port/ Autosampler
4. Column
5. Detector
Chapter-I INTRODUCTION
[image:24.595.144.508.69.297.2]Page 9 Fig. 1.1:Schematic diagram of instrumentation of HPLC.18 1.3.1 Solvent Reservoir
Solvent Reservoirs are used to store mobile phase. Scott Duran bottles are commonly used as solvent reservoirs. The solvent reservoir must be made of inert material such as glass and must be smooth so as to avoid growth of microorganisms on its walls. It may be transparent or can be amber colored. A graduated bottle gives a rough estimate of mobile-phase volume in the bottle. Solvent reservoirs are placed above HPLC system (at higher level) in a tray. They should never be kept directly above the system as any spillage of solvent on the system may damage electronic parts of HPLC.
1.3.2 Solvent Delivery System (Pump)
Pumps are an important component of the HPLC system. It delivers a constant flow of mobile phase such that the separation of components of mixture takes place in a reasonable time. There are different types of pumps:
a) Reciprocating Pumps
b) Displacement Pumps
c) Pneumatic Pumps
Chapter-I INTRODUCTION
Page 9 Fig. 1.1:Schematic diagram of instrumentation of HPLC. 18 1.3.1 Solvent Reservoir
Solvent Reservoirs are used to store mobile phase. Scott Duran bottles are commonly used as solvent reservoirs. The solvent reservoir must be made of inert material such as glass and must be smooth so as to avoid growth of microorganisms on its walls. It may be transparent or can be amber colored. A graduated bottle gives a rough estimate of mobile-phase volume in the bottle. Solvent reservoirs are placed above HPLC system (at higher level) in a tray. They should never be kept directly above the system as any spillage of solvent on the system may damage electronic parts of HPLC.
1.3.2 Solvent Delivery System (Pump)
Pumps are an important component of the HPLC system. It delivers a constant flow of mobile phase such that the separation of components of mixture takes place in a reasonable time. There are different types of pumps:
a) Reciprocating Pumps
b) Displacement Pumps
In reciprocating pumps, a motor driven reciprocating piston controls the flow of mobile phase with the help of two ball check valves that opens and closes with the piston movement. The flow is thus not continuous and as damping of flow is necessary, it is accomplished using pulse dampers which are a long coiled capillary tube. Reciprocating pumps are most widely used in HPLC systems.
Displacement pumps, also known as syringe pump is composed of a one directional motor driven plunger that pushes the mobile phase present in a syringe like chamber. The volume of displacement pumps is limited. A constant flow rate is usually obtained with syringe like pumps.
Pneumatic pumps are the simplest where the mobile phase is pushed out of the mobile phase container by the pressure of a pressurized gas. The flow is dependent on the back pressure of the column and usually the flow is limited to pressures below 2000 psi.20
1.3.3 Injection Port or Auto sampler
Chapter-I INTRODUCTION
Page 11 Automatic injection improves laboratory productivity and eliminates personal errors. Present day advanced HPLC systems are equipped with an auto injector along with an auto sampler. The software programs help filling of the loop and delivery of the sample to the column. The computer controls the sequence of samples for injection from vials kept in numbered positions of the auto sampler. It is important to adopt precautions to ensure consistency of results.22
Fig. 1.2:Flow Path of a Manual Injector.23 1.3.4 HPLC Column
The HPLC column is referred to as the heart of the process. The stationary phase of the column is used in separating the individual fractions of a sample mixture by using various physical and chemical parameters. Columns for analytical HPLC are of various sizes ranging from 10 - 25 mm in length and 2.6 – 4.6 mm internal diameter (i.d). Columns for preparative HPLC are in size range of 50 – 250 mm long and i.d greater than 4.6 mm. The columns are generally constructed of stainless steel SS-316 grade to cope with high back pressure (caused by the small particles of the stationary phase) and are glass lined to prevent metal catalysis of solvent- solute reactions at high column pressures (due to force of pumping of the mobile phase through the columns). Columns made of glass are used for the separation of Biomolecules and columns made of PEEK polymer are biocompatible and chemically inert to most solvents.24
Chapter-I INTRODUCTION
Page 11 Automatic injection improves laboratory productivity and eliminates personal errors. Present day advanced HPLC systems are equipped with an auto injector along with an auto sampler. The software programs help filling of the loop and delivery of the sample to the column. The computer controls the sequence of samples for injection from vials kept in numbered positions of the auto sampler. It is important to adopt precautions to ensure consistency of results.22
Fig. 1.2:Flow Path of a Manual Injector.23 1.3.4 HPLC Column
Stationary phase
Separation of pharmaceuticals is usually achieved by partition of compounds in the test solution between the mobile and the stationary phases. HPLC systems consisting of polar stationary phases and non-polar mobile phases are described as normal-phase chromatography; those with non-polar stationary phases and polar mobile phases are called reversed-phase chromatography.
There are many types of stationary phases used in HPLC including:
- Unmodified silica, alumina, or porous graphite, used in normal-phase chromatography, where separation is based on differences in adsorption;
- A variety of chemically modified supports prepared from polymers, silica, or porous graphite, used in reverse-phase HPLC, where separation is based principally on partition of the molecules between the mobile phase and the stationary phase;
- Resins or polymers with acid or basic groups, used in ion-exchange chromatography, where separation is based on competition between the ions to be separated and those in the mobile phase;
- Porous silica or polymers, used in size-exclusion chromatography, where separation is based on the relative molecular mass of the molecules.
Chapter-I INTRODUCTION
Page 13 For the separation of enantiomers, special chemically modified stationary phases (chiral chromatography) are available, e.g. cyclodextrins, albumins, etc.
Generally, silica-based reverse-phase columns are generally considered to be stable in mobile phases with an apparent pH in the range 2.0 - 8.0, but the column manufacturer's instructions should be consulted before using the column. Columns containing particles of polymeric materials such as styrene divinyl benzene copolymer are stable over a wider pH range.
For analytical separations the particle size of the most commonly used stationary phases varies between 3 μm and 10 μm. The particles may be spherical or irregular, of different porosities and specific surface area. In the case of reversed-phase, the extent of bonding of the stationary phase is expressed as the carbon-loading. Furthermore, stationary phases may be "end-capped", i.e. the number of residual silanol groups is reduced by methylation. These parameters contribute to the chromatographic behavior of a particular stationary phase. Tailing of peaks, particularly for basic substances, can occur when residual silanol groups are present.25
1.3.5 Detector
Table 1.2:Commonly used detectors and their application. 26, 27 Detector Analyte detected Solvent requirement s Uses UV-Visible Any compounds with chromophor e
Non UV
absorbing solvents
Wavelength at which maximum absorption occurs can be selected. Has a high degree of selectivity and is useful for many applications. Photo diode array (PDA) detector Any compound with chromophor e
Non UV
absorbing solvents
Detects an entire spectrum simultaneously. Useful for analysis of related substances and impurities.
Fluores-cence
Fluorescent compounds
Non UV
absorbing solvents
Highly selective and sensitive. Wavelength at which fluorescence occurs is selected. Often used to analyze derivatised samples after treatment with DANSYL chloride to form fluorescent compounds.
Refractive index (RI)
Compound
with a
different RI to that of the mobile
phase
Cannot run mobile phase gradients
Virtually it is a universal detector but has limited sensitivity. Used for the detection of sugars.
Conduct-ivity
Charged or polar
compounds
Mobile phase
must be
conducting
Excellent detector for ion exchange methods.
Electro-chemical
Readily oxidized or reduced compounds
Mobile phase
must be
conducting
Very sensitive and selective. Used for detection of Biological compounds. Evaporativ e light scattering detector (ELSD) All compounds are detected virtually
Volatile
solvents and volatile
buffers must be used.
Universal detector, Highly sensitive but not selective. But can be use for gradient analysis. Used for the detection of lipids, sugar and high molecular weight analytes.
Optical rotation
Optically active
Mobile phase should be an
Chapter-I INTRODUCTION
Page 15 Mass
Spectro-meter (MS)
Broad range of
compounds
Volatile
solvents and volatile
buffers must be used
Compounds are detected by difference in mass numbers. Highly sensitive and a two dimensional analytical tool. Used to quantify low detection limit of molecular and elemental compounds
1.3.6 Data Collection devices
Signals from the detector may be collected on chart recorders or electronic integrators that vary in complexity and in their ability to process, store and reprocess chromatographic data. The data storage capacity of these devices is usually limited
Modern data stations are computer based and have a large storage capacity to collect process and store data for possible subsequent reprocessing. Analytical reports can often be customized to the needs of the analyst.
METHOD DEVELOPMENT AND VALIDATION
1. 4 Introduction to Method Development
The number of drugs introduced into the market is increasing every year. These drugs may be either new entities or partial structural modification of the existing one. Often a time lag exists from the date of introduction of a drug into the market to the date of its inclusion in pharmacopoeias. This happens because of the possible uncertainties in the continuous and wider usage of these drugs, reports of new toxicities (resulting in their withdrawal from the market), development of patient resistance and introduction of better drugs by competitors. Under these conditions, standards and analytical procedures for these drugs may not be available in the pharmacopoeias. It becomes necessary, therefore to develop newer analytical methods for such drugs.28, 29
Analytical methods should be used within good manufacturing practice (GMP) and good laboratory practice (GLP) environments, and must be developed using the protocols set out in the International Conference on Harmonization (ICH) guidelines (Q2A and Q2B).30, 31
Chapter-I INTRODUCTION
Page 17 determination of the capability of the method to separate and quantify degradation products, while providing insight into the main mechanisms of degradation. Once a stability-indicating method is in place, the formulated drug product can then be subjected to heat and light in order to evaluate potential degradation of the API in the presence of formulation excipients. 32
1.4.1 Need for the Development of a New Method
Several reasons are available for the development of a new method of analysis.
There may not be a suitable method for a particular analyte in the specific sample matrix.
Existing methods may be too erroneous, artefact and/or contamination prone, or they may be unreliable (having poor accuracy or precision).
Existing methods may be too expensive, time consuming, or energy intensive, or they may not be easily automated.
Existing methods may not provide adequate sensitivity or analyte selectivity in samples of interest.
Newer instrumentation and techniques may have evolved that provide opportunities for improved methods, including analyte identification or detection limits, greater accuracy or precision, or better return on investment.
There may be a need for alternative method to confirm, for legal or scientific reasons, analytical data originally obtained by existing methods.33
1.5 Method Development Using HPLC
different solvents, concentration range of each component, nature of sample etc. Prior to method development there must be some technical information i.e. chromatography method selection according to the sample properties, the sample when analyzed with HPLC, the condition where all compounds elute in a reasonable time, optimization of HPLC method with regard to analysis time, resolution, selectivity and sensitivity.28
1.5.1 Analyte Standard Characterization
All the information about the analyte is gathered regarding the structure, physical and chemical properties, toxicity, purity, hygroscopicity, solubility and stability. The availability of the 100% pure standard analyte is determined along with its storage and disposal information. If multiple components are to be analyzed in a sample matrix, the number of components to be analyzed is noted and the availability of the standard for each component is checked.29, 33
1.5.2 Literature Search and Prior Methodology
The available literature is searched for all types of information related to the analyte. Availability of information regarding the synthesis, physical and chemical properties, solubility or relevant analytical methods is determined. Books, periodicals, regulatory agency compendia, such as IP, USP/NF, BP etc. should be referred. Chemical Abstracts Service (CAS) automated/ computerized literature searches also should be used.
Information pertaining to prior analytical work on the analyte has to be determined within the company and compile the available data, results, reports, memos and publications.33
1.5.3 Choosing a Suitable Method
Chapter-I INTRODUCTION
Page 19 If no previous methods exist for the analyte in the literature, work from analogy to investigate compounds that are similar in structure and properties. Usually a compound with analytical method exists that is similar to the analyte of interest.33
1.5.4 Optimization a) Choice of method
The most commonly used chromatographic methods are normal phase chromatography, reverse phase chromatography, reverse phase ion-pair chromatography and ion-exchange chromatography. In the selection of suitable chromatographic method for organic compounds, first reversed phase should be tried, if not successful, normal phase should be tried, then reverse phase ion-pair chromatography should be tried, ion-exchange chromatography at the end.29
b) Choice of Mobile Phase
In reversed phase chromatography the selection of mobile phase is very important for the analysis of the drug. We can use acetonitrile frequently as it is suitable for the entire UV range, methanol and Isopropanol are not suitable below wavelength of 210 nm, acetic acid is suitable above a wavelength of 240 nm, for the preparation of buffers, both K2HPO4 and KH2PO4can be used in entire UV range, freshly distilled THF is suitable for HPLC above a wave length of 240 nm, TEA is suitable above 240 nm, ammonium acetate can be used above 215 nm, EDTA can be used in entire UV range, sodium phosphate is suitable above 210 nm.29
run. The initial mobile phase composition can be estimated on the basis of where the compounds of interest were eluted, at what mobile composition.
Changing the polarity of the mobile phase can alter the elution of drug molecules. The elution strength of a mobile phase depends upon its polarity, the stronger the polarity, higher is the elution. Ionic samples (acidic or basic) can be separated, if they are present in un-dissociated form. Dissociation of ionic samples may be suppressed by proper selection of pH.
The pH of the mobile phase has to be selected in such a way that the compounds are not ionized. If the retention times are too short, the decrease of the organic phase concentration in the mobile phase can be in steps of 5%. If the retention times are too long, an increase in 5% steps of the organic phase concentrations is needed.
When separating acid or bases, buffered mobile phase is required to maintain consistency in retention time and selectivity. Buffered salts reduce peak tailing for basic compounds by effectively masking silanol groups and also reduce potential ion-exchange interactions with a protonated silanol groups. As potassium is a stronger counter ion than sodium, it provides improved results compared to sodium (Na+). Potassium phosphate is used for preparation of buffers of various pH. If band tailing is observed for basic amphoteric compounds few drops of diluted triethylamine or ammonium acetate is added, for acidic or amphoteric compounds, few drops of diluted triethylamine or ammonium acetate is tried. For neutral compounds, the aqueous eluent used in method development is water, for weak to medium acidic compounds, 100 mM H3PO4buffer of pH 2.3, for weak to medium basic or acidic compounds in ionized form 100 mM H3PO4 buffer of pH 4.0, 50 mM H3PO4buffer of pH 7.5 are used. Unknown sample should be analyzed first with water, then with an acidic and a neutral buffer.
Chapter-I INTRODUCTION
Page 21 the previously used mobile phase, if not intermediate solvent may be used, the one that is miscible with previous mobile phase and new mobile phase.
c) Choice of Column
Columns being the heart of HPLC for optimum separation, Stable, high performance column with good selectivity, efficiency is essential requirement for rugged and reproducible method. These characteristics are dependent on the columns manufacturer’s production of good quality columns and packing materials.
Column length
Longer columns are chosen for increased resolution.
Shorter columns are chosen for shorter analysis time, lower back pressure, fast equilibration and less solvent consumption.
Column internal diameter
Wider diameter columns are chosen for greater sample loading.
Narrow columns are chosen for more sensitivity and reduced mobile phase consumption.
Particle shape
Columns with spherical particle shapes are preferred when lower back pressure column stability and greater efficiency is required.
Columns with irregular particle shapes are preferred when large surface area and high capacity is required.
Particle size
Columns with larger particle size of 5 – 10 μm are preferred for structurally different compounds.
Columns with large particle of 15 – 20 μm are used for preparative separations.
Surface area
Columns with high surface area packing are selected for more capacity, greater resolution and longer retention.
Columns with low surface area packing are selected for quicker equilibration time.
Carbon load
Columns with high carbon load are chosen for greater column capacities and resolution.
Columns with low carbon load for faster analysis time.
End capping
Columns with end capped packing are selected to eliminate unpredictable secondary interactions with base material
Columns with non-end capped packing are selected for selectivity differences for polar compounds by controlling secondary interactions. 29
d) Choice of Detector
Chapter-I INTRODUCTION
Page 23 1.5.5 Further Optimization
After the selection of a suitable method, mobile phase, column and detector, further optimization can be done to obtain a well developed method.
For shorter analysis time
Change to isocratic method. The suitable mobile phase composition is estimated from the gradient run.
Use of shorter column, if proper resolution is obtained.
For better resolution
Use of longer column.
Use of stationary phase with smaller particles (3 – 4 μm).
For better selectivity and sensitivity
Other stationary phases e.g. phenyl, CN etc.
pH control with ion-forming compounds
Use of methanol or THF instead of acetonitrile.
Detection at the absorption maximum of the substance
[image:38.595.156.475.524.732.2] All factors which leads to narrower and higher peaks as gradient elution, smaller particle, micro bore columns.35
1.6 Parameters Affecting Changes in Chromatograph
The various parameters affecting the changes in chromatographic conditions are
1. Flow rate 2. Temperature 3. pH
4. Ion pair reagent 5. Column efficiency 6. Capacity factor 7. Resolution 8. Retention time 9. Peak asymmetry
1.6.1 Effect of Flow Rate
The efficiency of a HPLC column varies with flow rate. It is sometimes useful and readily utilized to increase the resolution. A faster flow rate of the eluent minimizes the time required to run a column and thereby minimizes diffusion, resulting in a better separation (less band broadening). However, the maximum flow rate is limited because a finite time is required for analyte to equilibrate between stationary phase and mobile phase. A slower flow rate will decrease the column back pressure and a corresponding increase in the run time is observed.36, 37
Table 1.3:Flow rates for column with different internal diameter.36
Internal diameter of column (mm)
Standard flow rate (μL/ min)
4.6 1000
2.1 200
Chapter-I INTRODUCTION
Page 25 1.6.2 Effect of Temperature
Elevated temperatures decrease viscosity and increase solubility and diffusivity. Retention, peak shape, column efficiency, and total analysis time are affected by temperature because both the thermodynamics and kinetics of adsorption processes are functions of temperature. Additionally, temperature control results in improved reproducibility. In liquid chromatography temperature is used in the optimization of a separation. At higher temperature, peaks will be sharper and elute earlier. System pressure is affected by temperature. The viscosity of the mobile phase decreases with increasing temperature. For example if the HPLC system pressure is too high for a given solvent system temperature of the column may be raised to 40 0C or even 60 0C. Higher temperature will lead to a shorter column lifetime and some columns may not be able to tolerate 60 0C. The combination of smaller diameter packing with shorter column lengths at elevated temperatures facilitates efficient and fast separations, meeting the high throughput performance requirements of the pharmaceutical industry.38, 39
1.6.3 Role of pH
For some preparations the effect of changing pH is minimal. However for acids and bases, a small change in pH is significant. Changing the pH changes the degree of ionization of molecules in solution, affecting polarity of the solution thereby changing the retention times in an HPLC separation. In a sample mixture, the retention time of the components of the mixture are also changed to different extents. Hence it affects the degree of selectivity, where the peaks become further apart or at a particular pH they may co-elute and then the peak elution order will change. Selection of a proper buffer pH is necessary to reproducibly separate ionizable compounds by RP-HPLC. Selection of an improper pH for ionizable analytes leads to asymmetric peaks that are broad, tall or split.
recommended for a good peak shape. From Henderson- Hasselback equation,
It can be determined that 99% of the analyte is in a single form, Good peak shape is possible only when an analyte is in a single form.40, 41, 42
1.6.4 Role of Ion-Pair Reagent
Most of these compounds are ionic or polar; hence the use of reversed phase-high performance liquid chromatography (RP-HPLC) is somewhat restricted. Initially when deciding to select RP-HPLC or RP-HPLC with ion-pairing, the nature of the analyte of interest is considered. If the sample is neutral, RP-HPLC is used first; and if the sample is ionic, RP-HPLC with ion pairing is used. Thus RP-HPLC and RP-HPLC with ion pairing are similar except that the latter consists of an ion-pair reagent in the mobile phase to improve the selectively of ionic samples. The ionic pair reagents are large ionic molecules having a charge opposite to the analyte of interest, as well as a hydrophobic region to interact with the stationary phase. The counter-ion combines with the ions of the eluent, becoming ion pairs in the stationary phase. This results in different retention, thus facilitating separation of analytes.
The use of an ion-pair reagent is suggested only when separation is not adequate with reversed-phase HPLC. This is because using an ion-pair reagent introduces additional experimental parameters that need to be controlled, such as selection of a suitable ion-pair reagent to use and its concentration. Because of this added variable, reversed-phase HPLC should be utilized on any ionic analyte first before trying ion-pair reversed–phase HPLC. The approach used in RP-HPLC to separate charged analytes is ionic suppression. This technique is based on the pH adjustment of the mobile phase to result in a non-ionized analyte. However, this requires extensive
Chapter-I INTRODUCTION
Page 27 method development and is only suitable for single compounds or simple mixtures where the pKa’s of the analytes lie close together. 43
1.6.5 Column Efficiency (N)
The efficiency of a chromatographic column is given terms of number of theoretical plates (plate number),N
Where,
t
r- retention time measured from the time of injection,w
- peak width peak width obtained by drawing tangents to the sides of the Gaussian curve at the inflection points and extrapolating the tangents to intercept the baseline as in fig 2.3Efficiency of the column is also expressed as height equivalent to
theoretical plate, (or plate height) HETP (or
h
)Where, L-length of the column,
N- number of theoretical plates.4, 29, 44
Fig. 1.4:Pictorial Representation of number of theoretical plates. 44
= 16
1.6.6 Capacity Factor (k’)
It is measure of the position of a sample peak in the chromatogram, being specific for a given compound, a parameter which specifies the extent of delay of substance to be separated.
Where,
t
r– retention time of the solute,t
m – retention time of the unretained compound by the column packing. Fig 2.4 shows capacity factor of a solute.k’ depends at stationary phase, mobile phase, temperature and quality of column packing. For good chromatographic performance with isocratic separation, k’ value should be in the range of 1-10. If k’ < 1.0, the bands are inadequately separated from excessively unretained material, if k’ > 10 separation takes too long and bands broadened, if k’ > 30, satisfactory isocratic separation using present column and mobile phase is not obtained and gradient elution should be tried.4, 29, 44
Fig.1.5:Pictorial representation of capacity factor. 44 1.6.7 Resolution (Rs)
The ability of the column to separate two solutes. In a chromatogram it is the distance of separation of two peaks.
= −
Chapter-I INTRODUCTION
Page 29 Where,
t
r1,
t
r2– retention time of two immediately adjacent peaks,w
1,w
2–
peak widths of two immediately adjacent peaks as shown in fig 2.5. 4, 29, 44Fig.1.6:Pictorial Representation of Resolution.44 1.6.8 Selectivity factor (α) / Relative Retention
This describes the relative position of two adjacent peaks. Ideally, it is calculated using the capacity factor because the peaks separation depends on the components interaction with the stationary phase.
Where,
k’
a,k’
b–
capacity factors of peak a and peak b respectively.The value of the separation factor is always greater than unity. The separation factor is also identical to the ratio of the corresponding distribution constants. If the capacity factor is used, the separation factor should be consistent for a given column, mobile phase composition and specified temperature, regardless of the instrument used. 4, 29, 44 Fig 2.6 shows a pictorial representation of measurement of selectivity factor
Fig.1.7:Pictorial representation of selectivity factor. 44 1.6.9 Peak Asymmetry (As)
It is also known as tailing factor. The asymmetry factor for a peak can be calculated using the following formula.
Where,
W
0.05– peak width at 5% height from the base line,f
– distance between maximum and leading edge of the peak as in Fig 2.7It is also calculated from
Where,b- distance from the point at peak maxima to the trailing edge,
a – distance from the leading edge of the peak to the peak maxima (both measured at 10% height of the baseline) as shown in Fig 2.8. 29, 45
= 2.
Chapter-I INTRODUCTION
Page 31 Fig.1.9:Pictorial representation of peak asymmetry.44
1.7 Introduction to Method Validation
Validation is an integral part of quality assurance; it involves the systematic study of systems, facilities and processes aimed at determining whether they perform their intended functions adequately and consistently as specified. Validation in itself does not improve processes but confirms that the processes have been properly developed and are under control. 45
The required validation parameters, also termed analytical performance characteristics or analytical figs of merit. Methods should be validated or revalidated
Before their introduction and routine use;
Whenever the conditions change for which the method has been validated, e.g., instrument with different characteristics.
Wherever the method is changed and the change is outside the original scope of the method.45
The validation of analytical procedures is directed to the four most common types of analytical procedures: Identification tests; Quantitative tests for impurities' content; Limit tests for the control of impurities; Quantitative tests of the active moiety in samples of drug substance or drug product or other selected component(s) in the drug product.30
1.8 Method Validation (ICH Guidelines)
1. Accuracy, 2. Precision,
Repeatability,
Intermediate precision. 3. Specificity / Selectivity,
4. Limit of Detection, 5. Limit of Quantitation, 6. Linearity,
7. Range, 8. Robustness, 9. System Suitability.
Chapter-I INTRODUCTION
Page 33 1.8.1 Accuracy
The accuracy of an analytical procedure expresses the closeness of agreement between the value which is accepted either as a conventional true value or an accepted reference value and the value found. Accuracy should be established across the specified range of the analytical procedure.32
Accuracy is measured as the percentage of the analyte recovered by assay, spiking samples in a blind study.
Accuracy studies for drug substance and drug product are recommended to be performed at the 80, 100 and 120% levels of label claim as stated in the Guidelines for Submitting Samples and Analytical Data for Methods Validation
Accuracy should be assessed using a minimum of 9 determinations over a minimum of 3 concentration levels covering the specified range (e.g., 3 concentrations /3 replicates each of the total analytical procedure). Accuracy should be reported as percent recovery by the assay of known added amount of analyte in the sample or as the difference between the mean and the accepted true value together with the confidence intervals.33, 34, 35
The acceptance criterion for accuracy is the Relative Standard Deviation (RSD) for all the recovery values should not be more than 2.0%.
1.8.2 Precision
The precision of an analytical procedure expresses the closeness of agreement (degree of scatter) between a series of measurements obtained from multiple sampling of the same homogeneous sample under the prescribed conditions. Precision may be considered at three levels: repeatability, intermediate precision and reproducibility.32
The relative standard deviation (RSD) for the assay of six sample preparations should not be more than 2.0%.
1.8.3 Specificity
Specificity is the ability to assess accurately the analyte in the presence of components which may be expected to be present in the sample matrix. Typically these might include impurities, degradants, matrix, etc. it is a measure of the degree of interference from such other things such as other active ingredients, excipients, impurities, and degradation products, ensuring that a peak response is due to a single component only.32
Specificity is divided into two separate categories: identification and assay/ impurity tests. For identification purpose, specificity is demonstrated by the ability to discriminate between compounds of closely related structures or comparison to a known reference standard. For assay/ impurity tests, specificity is demonstrated by the resolution of the two closely eluting compounds. These compounds are usually the major component or the active ingredient and an impurity.30, 31, 32
1.8.4 Limit of Detection (LOD)
The detection limit of an individual analytical procedure is the lowest amount of analyte in a sample which can be detected but not necessarily quantitated as an exact value. It is a limit test that specifies whether or not an analyte is above or below a certain value.
Chapter-I INTRODUCTION
Page 35 Where,
SD- standard deviation S- Slope
The standard deviation of the response can be determined based on the standard deviation of the blank, on the residual standard deviation of the regression line, or the standard deviation of y-intercepts of regression lines. The method used to determine LOD should be documented and supported, and an appropriate number of samples should be analyzed at the limit to validate the level.30, 31, 32
1.8.5 Limit of Quantitation (LOQ)
The limit of quantitation (LOQ) is defined as the lowest concentration of an analyte in a sample that can be determined with acceptable precision and accuracy under the stated operational conditions of the method.
The ICH has recognized the 10-to-1 signal –to-noise ratio as typical, and as for LOD, lists the same two additional options that can be used to determine LOQ: visual non-instrumental methods and a means of calculation. The calculation method is again based on the standard deviation (SD) of the response and the slope (S) of the calibration curve according to the formula,
Where,
SD- standard deviation S- Slope
Again, the standard deviation of the response can be determined based on the standard deviation of the blank, on the residual standard deviation of the regression line, or the standard deviation of y-intercepts of regression lines. As with LOD, the method used to determine LOQ should be
= 3.3
documented and supported, and an appropriate number of samples should be analyzed at the limit to validate the level.30, 31, 32
1.8.6 Linearity and Range
Linearity is the ability of the method to elicit test results that are directly proportional to analyte concentration within a given range. Linearity is generally reported as the variance of the slope of the regression line. Range is the (inclusive) interval between the upper and lower levels of analyte that have been demonstrated to be determined with precision, accuracy, and linearity using the method. The range is normally expressed in the same units as the test results obtained by the method.
A minimum of five concentration levels, along with certain minimum specified ranges are to be determined. For assay tests, the minimum specified range is 80-120% of the target concentration. For impurity tests, the minimum range is from the reporting level of each impurity to 120% of the specification.30, 31, 32
The relationship between the concentration (in %) of drug in sample and area of should be linear in the specified range and the correlation should not be less than 0.9.
1.8.7 Robustness
Robustness is the capacity of a method to remain unaffected by small deliberate variations in method parameters. The robustness of a method is evaluated varying method parameters such as percent organic solvent, pH, ionic strength, or temperature and determining the effect (if any) on the results of the method.30, 31, 32
Chapter-I INTRODUCTION
Page 37 1.8.8 System Suitability
System suitability tests are an integral part of gas and liquid chromatographic methods. They are used to verify that the resolution and reproducibility of the chromatographic system are adequate for the analysis to be done. The tests are based on the concept that the equipment, electronics, analytical operations and samples to be analyzed constitute an integral system that can be evaluated as a whole. 47
System suitability is the checking of a system to ensure system performance before or drying the analysis unknowns. Parameters such as plate count, tailing factor, resolution and reproducibility (% RSD retention time and area for repetitive injections) are determined and compared against the specifications set for the method. These parameters are measured during the analysis of a system suitability sample that is a mixture of main components and expected by-products.32
Table 1.4:Acceptance Limits for System Suitability Test. 32
Parameter Limit
Capacity Factor k’> 2
Injection precision RSD < 1% for n ≥ 5
Resolution
R
s > 2 Tailing factorA
s≤ 2 Theoretical plates N > 20001.9 Definitions and Formulas Used in Method Validation
1.9.1 Mean/ Average (xi)
Where, x1, x2, x3.. = Values of individual results n = Number of individual results
1.9.2 Standard Deviation (SD)
It is the root mean square deviation of values from their average.
Where
= Sum of observationsx
i = Mean or arithmetic average (x / n)x
= Individual observed valuex – x
i = Deviation of a value from the meann
= Number of observations1.9.3 Relative Standard Deviation (RSD)
It is defined as standard deviation expressed as the percentage of mean.
= + + …
Chapter-I INTRODUCTION
Page 39
= × 100
Where
SD
= Standard deviationx
i = Mean or arithmetic average (x / n)1.9.4 Correlation Co-Efficient (R)
The correlation coefficient is used to indicate the relationship of two random variables. It provides a measure of the strength and direction of the correlation varying from -1 to +1. Positive values indicate that the two variables are positively correlated, meaning the two variables vary in the same direction. Negative values indicate that the two variables are negatively correlated, meaning the two variables vary in the contrary direction. Values close to +1 or -1 reveal the two variables are highly related.
Where
n
= number of observationsx
= first valuey = second value
xy = sum of products of first and second value
x = sum of first values
y = sum of second values
x2 = sum of squares of first value = (∑ ) − (∑ )(∑ )
y2 = sum of squares of second value 1.9.5 Linear Regression
A regression is a statistical analysis assessing the association between two variables. It is used to find the relationship between two variables.
The equation of straight line is
Where b = slope
a = intercept
Where n = number of observations x = first value
y = second value
xy = sum of products of first and second value
x = sum of first values
y = sum of second values
x2 = sum of squares of first value
y2 = sum of squares of second value
y = a + bx
Slope (b) =[n(Σxy)-(Σx) (Σy)]/[n(Σx2) -(Σx)2)