VALIDATION OF SELECTED CORTICOSTEROIDS
IN RAT PLASMA USING RP-HPLC METHOD
Thesis Submitted to
The Tamil Nadu Dr. M.G.R. Medical University
Chennai – 32
for the Award of the Degree of
Doctor of Philosophy
by
NATHE KIRAN RAMESH
(Reg.No: 141540002)
Under the Guidance of
Dr. W.D. Sam Solomon,
M.Pharm., Ph.D.,Professor and Head,
Department of Pharmaceutical Chemistry,
Sr.No
Title
Page No.
1
Introduction
1-33
2
Aim and objective
34
3
Review of Literature
35-36
4
Drug profile
37-39
5
Materials and methods
40-52
6
Result and Analysis
53-177
7
Discussion
178-179
8
Summary and conclusion
180-181
9
Impact of the Study
182
Sr.
No.
Fig. No.
contents
Page
No.
1
1.1
Isocratic LC system
21
2
1.2
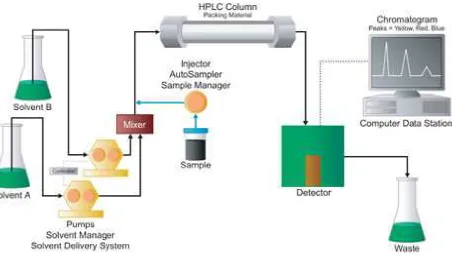
High pressure gradient system
22
3
1.3
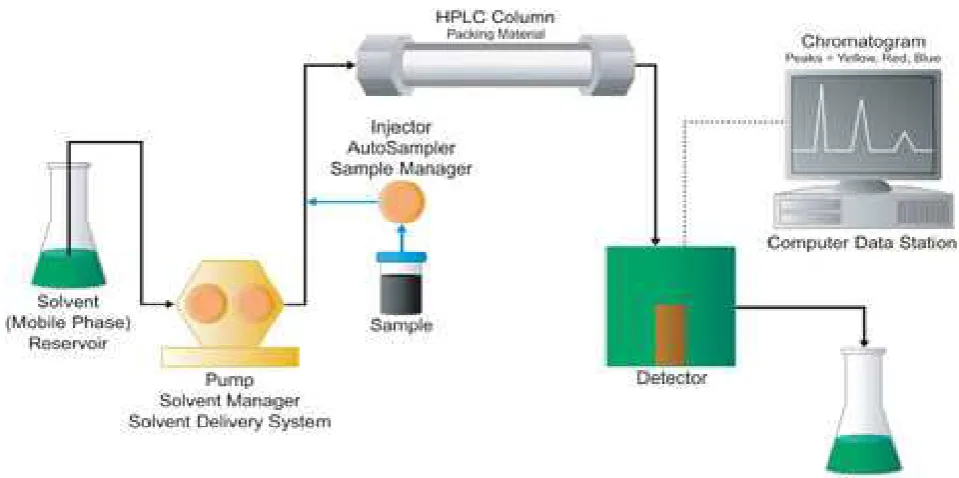
Schematic diagram of HPLC instrument
23
4
1.4
A typical HPLC system
24
5
1.5
HPLC column dimensions
26
6
1.6
Column hardware examples
27
7
1.7
Instrumentation of mass spectrometry
29
8
5.1
Working RP-HPLC system
42
9
6.1
Linearity graph for Betamethasone
63
10
6.2
Coefficient Variance graph for Betamethasone
78
11
6.3
Degradation graph for Bench top stability for
Betamethasone
89
12
6.4
Degradation graph for Freeze thaw stability
93
13
6.5
Degradation graph for plane solution stability
98
14
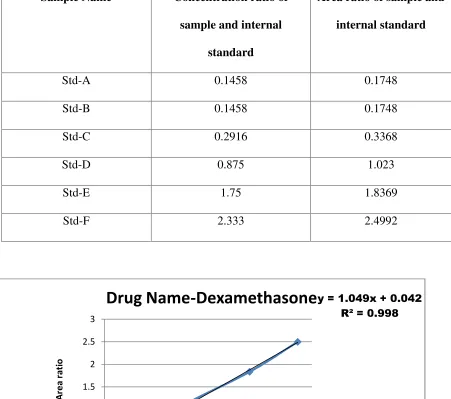
6.6
Linearity graph for Dexamethasone
18
6.10
Degradation graph for plane solution stability
136
19
6.11
Linearity graph for Dexamethasone
114
20
6.12
Coefficient Variance graph for Betamethasone
157
21
6.13
Degradation graph for Bench top stability for
Betamethasone
168
Sr.No. Table
No.
contents
Page
No.
1
1.1
List of detectors
27
2
5.1
Summary for older methods for Betamethasone
44
3
5.2
Summary for optimized methods for Betamethasone
44
4
5.3
Concentration ranges for Betamethasone
45
5
5.4
Summary for older methods for Dexamethasone
46
6
5.5
Summary for optimized methods for Dexamethasone
47
7
5.6
Concentration ranges for Betamethasone
48
8
5.7
Summary for older methods for Prednisolone
49
9
5.8
Summary for optimized methods for Prednisolone
50
10
5.9
Concentration ranges for Prednisolone
51
11
6.1
Observation table for linearity for Betamethasone
63
12
6.2
Observation table for Accuracy and Precision for
Betamethasone
77
13
6.3
Observation table for coefficient varience for
Betamethasone
78
14
6.4
Observation table for linearity for Dexamethasone
106
15
6.5
Observation table for Accuracy and Precision for
Dexamethasone
17
6.7
Observation table for linearity for Prednisolone
144
18
6.8
Observation table for Accuracy and Precision for
Prednisolone
156
19
6.9
Observation table for coefficient variance for
Prednisolone
157
S. No. Abbreviation Remarks
1 API Active Pharmaceutical Ingredient
2 FPD Fine Partial Dose/Diameter
3 IP Induction Port
4 HLB Hydrophilic-Lipophilic Balance
5 HPLC High Performance Liquid Chromatography
6 IND Investigational New Drug
7 µm Micrometer
8 RSD Relative Standard Deviation
INTRODUCTION
This dissertation deals with the studies carried out by the writer in this laboratory on the development of bioanalytical method used for the study of validation parameters of selected corticosteroids in rat plasma by RP-HPLC method. Before discussing the experimental results, a brief introduction to bioanalytical methods of analysis, biopharmaceutical analysis, analysis of drugs in biological media, preliminary treatment of biological samples, estimation procedures for drugs and metabolites from biological samples, estimation of drugs in biological sample by RP-HPLC or LC-MS/MS methods.
1.1 Biopharmaceutical Analysis
1.1.1Need for Biopharmaceutical Analysis
Methods for measurement of drugs in biological media are increasingly important problems related to following studies which are highly dependent on biopharmaceutical analytical methods.
Bioavailability and Bioequivalence Studies
New Drug Development
Clinical Pharmacokinetics
Research in Basic Biomedical and Pharmaceutical Sciences
Therapeutic drug monitoring
1.1.2Analysis of drugs in various biological media
The most common samples obtained for biopharmaceutical analysis are blood and urine. Faeces are also utilized, especially if the drug or metabolite is poorly absorbed or extensively excreted in the bile. Other media that can be utilized include saliva, breath, and tissue.
Whereas a drug identification or drug abuse problem may be solved with only one type of biological sample.
Detection of a drug or its metabolite in biological media is usually complicated by the matrix. Because of this, various types of cleanup procedures involving techniques such as solvent extraction and chromatography are employed to effectively separate drug components from endogenous biological material. The ultimate sensitivity and selectivity of the assay method may be limited by the efficiency of the clean up methodology.
Whole blood is usually collected by venipuncture with either a hypodermic syringe or a Vacutainers apparatus. The volume of blood collected at any one sampling time is usually limited to 5 to 15 ml (depending on the assay sensitivity and the total number of samples taken for a given study). If the blood is allowed to clot and is then centrifuged, about 30 to 50% of the original volume is collected as serum (upper level). Thus, plasma generally is preferred because of its greater yield from blood. The greater the yield, the greater the amount of drug and the fewer the problems with sensitivity. Blood, serum, or plasma samples can be utilized for drug studies and may require protein denaturation steps before further manipulation.
If plasma or serum is used for the analytical procedure, the fresh whole blood should be centrifuged immediately at 3000rpm for approximately 5 to 10 min, and the supernatant should be transferred by means of a suitable device, such as a Pasteur pipette, to a clean container of appropriate size for storage. The remaining blood cells can then be discarded or stored for further studies such as drug binding.
Saliva and breath are biological media obtained from humans when constant ratio between plasma and salivary levels of certain drugs exists via non invasive sampling techniques. Saliva is advantageous in drug studies done with children. Although the concentrations of drugs in saliva are rarely equal to those in plasma, a constant ratio (over an effective therapeutic range) permits calculation of plasma levels based on salivary analysis.
Separation or isolation of drugs and metabolites from biological samples is performed in order to partially purify a sample. In this manner, an analyst can obtain the selectivity and sensitivity needed to detect a particular compound and can do so with minimum interference from components of the more complex biological matrix. The number of steps in a separation procedure should be kept to a minimum to prevent loss of drug or metabolite. Sometimes, the separation steps are preceded by a sample pretreatment.
1.1.3Storage requirements for biological samples
In order to avoid decomposition or other potential chemical changes in the drugs to be analyzed, biological samples should be frozen immediately upon collection and thawed before analysis. When drugs are susceptible to plasma esterase, the addition of esterase inhibitors, such as sodium fluoride, to blood samples immediately after collection helps to prevent drug decomposition.
When collecting and storing biological samples, the analyst should be aware of facts that from tubing
or storage vessels that can contaminate the sample. For example, plastic ware frequently contains the
high boiling liquid bis (2-ethylhexyl) phthalate; similarly, the plunger plugs of Vacutainers are known
to contain tri-butoxyethyl phosphate, which can interfere in certain drug analysis.
1.1.4Bioavailability studies
the processes by which the active ingredients or moieties are released from an oral dosage form and move to the site of action.
BA studies provide pharmacokinetic information related to distribution, elimination, the effects of nutrients on absorption of the drug, dose proportionality, linearity in pharmacokinetics of the active moieties and, where appropriate, inactive moieties.
BA data may also provide information indirectly about the properties of a drug substance prior to entry into the systemic circulation, such as permeability and the influence of pre systemic enzymes and/or transporters (e.g., p-glycoprotein).
1.1.5Preliminary treatment of biological fluids
In most cases, preliminary treatment of a sample is needed before the analyst can proceed to the measurement step. Analyses are required for drug in samples as diverse as plasma, urine, feces, saliva, bile, sweat, and seminal fluid. Each of these samples has its own set of factors that must be considered before an appropriate pretreatment method can be selected. Such factors as texture and chemical composition of the sample, degree of drug-protein binding, chemical stability of the drug, and types of interferences can affect the final measurement step.
1.1.6Extraction procedures for biological fluids and samples
After pre treating biological material, the next step is usually the extraction of the drugs from the biological matrix. All separation procedures use one or more treatments of matrix-containing solute with some fluid. If the components are a liquid (extracting solvents) and a solid (e.g., lyophilized feces), it is an example of liquid-solid extraction. If the extraction involves two liquid phases, it is an example of liquid-liquid extraction.
1.1.7Liquid-Solid extraction (Solid phase extraction)
extraction (usually via adsorption) of drugs from liquid samples are XAD-2 resin, charcoal, alumina, silica gel, and aluminum silicate. Sometimes the drugs are contained in a solid phase, such as in lyophilized specimens. Liquid-solid extraction is often particularly suitable for polar compounds that would otherwise tend to remain in the aqueous phase. The method could also be useful for amphoteric compounds that cannot be extracted easily from water.
Factors governing the adsorption and elution of drugs from the resin column include solvent polarity; flow rate of the solvent through the column, and the degree of contact the solvent has with the resin beads. In the adsorption process, the hydrophobic portion of the solute that has little affinity for the water phase is preferentially adsorbed on the resin surface while the hydrophilic portion of the solute remains in the aqueous phase. Alteration in the lipophilic / hydrophilic balance within the solute or solvent mix, and not within the resin, affects adsorption of the solute.
Biological samples can be prepared for cleanup by passing the sample through the resin bed where drug (metabolite) components are adsorbed and finally eluted with an appropriate solvent. The liquid solid extraction method provides a convenient isolation procedure for blood samples, thus avoiding solvent extraction, protein precipitation, drug losses, and emulsion
formulation. It is possible; however, that strong drug-protein binding could prevent sufficient
adsorption of the drug to resin.
1.1.8Liquid-liquid extraction
Liquid-liquid extraction is probably the most widely used technique because
The analyst can remove a drug or metabolite from larger concentrations of endogenous materials that might interfere with the final analytical determination.
The technique is simple, rapid, and has a relatively small cost factor per sample.
The extracted material can be redissolved in small volumes (e.g., 100 to 500 l of solvent), thereby extending the sensitivity limits of an assay.
It is possible to extract more than one sample concurrently.
Near quantitative recoveries (90% or better) of most drugs can be obtained through multiple or continuous extractions.
1.2 Method Development
Method development involves considerable trial and error procedures. In general, one begins with reversed phase chromatography, when the compounds are hydrophilic in nature with many polar groups and are water-soluble.
The pH of the mobile phase has to be selected in such a way that the compounds are not ionized. If the retention times are too short, then decrease 5 % of the organic phase concentration in the mobile phase, if the retention times are too long, an increase 5% of organic phase concentration in the mobile phase is needed.
Elution of drug molecules can be altered by changing the polarity of the mobile phase. The elution strength of a mobile phase depends upon its polarity. Ionic samples (acidic or basic) can be separated only, if they are present in undissociated form. Dissociation of ionic samples may be suppressed by proper selection of pH. Whenever acidic or basic samples are to be separated it is strongly advisable to control mobile phase pH by adding a buffer. PH of the buffer is to be adjusted before adding organic phase. The buffer selected for a particular separation should be used to control pH over the range of pka ±1.0.
During method development selection of column can be streamlined by starting with shorter columns (50 mm, 100 mm or even 150 mm). By selecting a shorter column with an appropriate phase the run time can be minimized so that an elution order and an optimum mobile phase can be quickly determined. The internal diameter of the column is also one factor is to be considered. Many laboratories use 4.6 mm ID as standard one, but it is worth considering to use 4mm ID column as an alternative. This 4 mm column requires only 75 % of the solvent consumption than that of 4.6 mm column.
Selecting an appropriate stationary phase can also help to improve the efficiency of method development. For example, a C-8 phase (reversed phase) can provide a further time saving over a C-18 as it does not retain the analytes as strongly as the C-18 phase. For normal phase application Cyano phases are most versatile. C-18 (250 x 4.6 mm) column are more often used in laboratory. These columns are able to resolve a wide variety of compounds due to their selectivity and higher number of theoretical plates.
Selection of internal standard should be on the basis of structural similarity, physicochemical properties related to the analyte to be quantified. Method optimization or Performance of selected method is checked by running three or more precision and accuracy batches and evaluating the results for meeting acceptance criteria for within run precision, accuracy and between run precision and accuracy. Finally selected method has to be validated to see whether it does what it was intended to do; i.e. it must be validated through validation parameters.
1.3 Bio-Analytical Method Validation
1.3.1Principles of Bioanalytical Method Validation and Establishment
The fundamental parameters to ensure the acceptability of the performance of a bioanalytical method validation are accuracy, precision, selectivity, sensitivity, reproducibility, and stability.
Each step in the method should be investigated to determine the extent to which environmental, matrix, material, or procedural variables can affect the estimation of analyte in the matrix from the time of collection of the material up to and including the time of analysis.
It may be important to consider the variability of the matrix due to the physiological nature of the sample. In the case of LC-MS-MS-based procedures, appropriate steps should be taken to ensure the lack of matrix effects throughout the application of the method, especially if the nature of the matrix changes from the matrix used during method validation.
A bioanalytical method should be validated for the intended use or application. All experiments used to make claims or draw conclusions about the validity of the method should be presented in a report (method validation report).
Whenever possible, the same biological matrix as the matrix in the intended samples should be used for validation purposes. (For tissues of limited availability, such as bone marrow, physiologically appropriate proxy matrices can be substituted.)
The stability of the analyte (drug and/or metabolite) in the matrix during the collection process and the sample storage period should be assessed, preferably prior to sample analysis.
For compounds with potentially labile metabolites, the stability of analyte in matrix from dosed subjects (or species) should be confirmed.
The accuracy, precision, reproducibility, response function, and selectivity of the method for endogenous substances, metabolites, and known degradation products should be established for the biological matrix. For selectivity, there should be evidence that the substance being quantified is the intended analyte.
The concentration range over which the analyte will be determined should be defined in the bioanalytical method, based on evaluation of actual standard samples over the range, including their statistical variation. This defines thestandard curve.
(excluding blank values) can define the standard curve. More standard concentrations may be recommended for nonlinear than for linear relationships.
The ability to dilute samples originally above the upper limit of the standard curve should be demonstrated by accuracy and precision parameters in the validation.
1.4 VALIDATION
1.4.1Types of validation process
A. Full validation
Full validation is important when developing and implementing a bioanalytical method for first time. Full validation is important for a new drug entity. A full validation of the revised assay is important if metabolites are added to an existing assay for quantification.
B. Partial validation
Partial validations are modifications of already validated bioanalytical methods. Partial validation can range from as little as one intra-assay accuracy and precision determination to a nearly full validation.
C. Cross-validation
Cross-validation is a comparison of validation parameters when two or more bioanalytical methods are used to generate data within the same study or across different studies. An example of cross validation would be a situation where an original validated bioanalytical method serves as the reference and the revised bioanalytical method is the comparator. The comparisons should be done both ways.
1.5 VALIDATION PARAMETERS
1.5.1Linearity
Linearity assesses the ability of the method to obtain test results that are directly proportional to the concentration of the analyte in the sample. The linear range of the method must be determined regardless of the phase of drug development. ICH guidelines recommend evaluating a minimum of five concentrations to assess linearity. The five concentration levels should bracket the upper and lower concentration levels evaluated during the accuracy study.
analyticalal tools such as methods, reagents, equipments, instrumentation and procedures for quality control and verification of results.
The obtained values of slopeaand interceptbis used in the Linear regression equation:
y = ax + b
1.5.2Calibration/Standard Curve
A calibration (standard) curve is the relationship between instrument response and known concentrations of the analyte. A calibration curve should be generated for each analyte in the 6 sample. A sufficient number of standards should be used to adequately define the relationship between concentration and response. A calibration curve should be prepared in the same biological matrix as the samples in the intended study by spiking the matrix with known concentrations of the analyte. The number of standards used in constructing a calibration curve will be a function of the anticipated range of analytical values and the nature of the analyte/response relationship. Concentrations of standards should be chosen on the basis of the concentration range expected in a particular study. A calibration curve should consist of a blank sample (matrix sample processed without internal standard), a zero sample (matrix sample processed with internal standard), and six to eight non-zero samples covering the expected range, including LLOQ.
Lower Limit of Quantification (LLOQ)
The lowest standard on the calibration curve should be accepted as the limit of quantification if the following conditions are met: C The analyte response at the LLOQ should be at least 5 times the response compared to blank response. C Analyte peak (response) should be identifiable, discrete, and reproducible with a precision of 20% and accuracy of 80-120%.
1.5.3Selectivity (Specificity)
substances in a biological matrix include endogenous matrix components, metabolites, decomposition products, and in the actual study, concomitant medication and other exogenous xenobiotics. If the method is intended to quantify more than one analyte, each analyte should be tested to ensure that there is no interference.
For every phase of product development, the analytical method must demonstrate specificity. The method must have the ability to unambiguously assess the analyte of interest while in the presence of all expected components, which may consist of degradants, excipients/sample matrix, and sample blank peaks. The sample blank peaks may be attributed to things such as reagents or filters used during the sample preparation.
For identification tests, discrimination of the method should be demonstrated by obtaining positive results for samples containing the analyte and negative results for samples not containing the analyte.
For assay/related substances methods, the active peak should be adequately resolved from all impurity/degradant peaks, placebo peaks, and sample blank peaks.
The forced degradation studies should consist of exposing the API and finished product to acid, base, peroxide, heat, and light conditions, until adequate degradation of the active has been achieved. An acceptable range of degradation may be 10–30% but may vary based on the active being degraded. Overdegradation of the active should be avoided to prevent the formation of secondary degradants.
The selectivity is defined as the lack of significant interfering peaks at the retention time of analyte and internal standard.
Selectivity is evaluated by injecting extracted blank plasma samples (anticoagulant sodium citrate) and comparing any interference with the response of the extracted LOQ samples processed with internal standard.
1.5.4Accuracy
Accuracy should be performed at a minimum of three concentration levels. For drug substance, accuracy can be inferred from generating acceptable results for precision, linearity, and specificity.
sample preparations are prepared at the 100% level, while both the 80 and 120% levels are prepared in triplicate.
For assay methods, the change in active content must be controlled tightly to establish sample stability. If impurities are to be monitored in the method sample, solutions can be analyzed on multiple days and the change in impurity profiles can be monitored.
For chromatographic robustness, all compounds of interest, including placebo related and sample blank components, should be present when evaluating the effect of modifying chromatographic parameters. For an HPLC impurity method, this may include a sample preparation spiked with available known impurities at their specification level or, alternatively, a forced degraded sample solution can be utilized. The analytical method should be updated to include defined stability of solutions at evaluated storage conditions and any information regarding sample preparation and chromatographic parameters, which need to be tightly controlled. Sample preparation and chromatographic robustness may also be evaluated during method development.
The accuracy of an analyticalal method describes the closeness of mean test results obtained by the method to the true value (concentration) of the analyte.Accuracy should be measured using a minimum of five determinations per concentration.
The mean value should be within 15% of the actual value except, at LLOQ where it should not deviate by more than 20 %. The deviation of the mean from the true value serves as the measures of accuracy.
Mean Concentration
Nominal Concentration
1.5.5Precision and repeatability
Repeatability reflects the closeness of agreement of a series of measurements under the same operating conditions over a short interval of time. For a chromatographic method, repeatability can be evaluated by performing a minimum of six replicate injections of a single
Alternatively, repeatability can be determined by evaluating the precision from a minimum of nine determinations that encompass the specified range of the method. The nine determinations may be composed of triplicate determinations at each of three different concentration levels, one of which would represent the 100% test concentration.
Intermediate precision reflects within laboratory variations such as different days, different analysts, and different equipments. Intermediate precision testing can consist of two different analysts, each preparing a total of six sample preparations, as per the analytical method. The analysts execute their testing on different days using separate instruments and analytical columns.
The use of experimental design for this study could be advantageous because statistical evaluation of the resulting data could identify testing parameters (i.e., brand of HPLC system) that would need to be tightly controlled or specifically addressed in the analytical method. Results from each analyst should be evaluated to ensure a level of agreement between the two sets of data. Acceptance criteria for intermediate precision are dependent on the type of testing being performed.
However, precision testing should be conducted by one analyst for early phase method qualification. Reproducibility reflects the precision between analytical testing sites. Each testing site can prepare a total of six sample preparations, as per the analytical method. Results are evaluated to ensure statistical equivalence among various testing sites. Acceptance criteria similar to those applied to intermediate precision also apply to reproducibility.
Repeatability expresses the precision under the same operating conditions over a short interval of time. Repeatability is also termed intraassay precision. Repeatability is sometimes also termed within run or within day precision.
The precision of an analytical method describes the closeness of individual measures of an analyte when the procedure is applied repeatedly to multiple aliquots of a single homogeneous volume of biological matrix.Precision should be measured using a minimum of five determinations per concentration.
[%] CV = 100 × standard deviation / Mean concentration
Good precision and accuracy can be obtained from methods with moderate recoveries, provided they have adequate sensitivity.
1.5.6Reproducibility
Reproducibility expresses the precision between laboratories (collaborative studies, usually applied to standardization of methodology). Reproducibility only has to be studied, if a method is supposed to be used in different laboratories. Unfortunately, some authors also used the term reproducibility for within laboratory studies at the level of intermediate precision. This should, however, be avoided in order to prevent confusion. As already mentioned above, precision and bias can be estimated from the analysis of QC samples under specified conditions. As both precision and bias can vary substantially over the calibration range, it is necessary to evaluate these parameters at least at three concentration levels (low, medium, high).
1.5.7Stability
Drug stability in a biological fluid is a function of the storage conditions, the chemical properties of the drug, the matrix, and the container system. The stability of an analyte in a particular matrix and container system is relevant only to that matrix and container system and should not be extrapolated to other matrices and container systems. Stability procedures should evaluate the stability of the analytes during sample collection and handling, after long-term (frozen at the 7 intended storage temperature) and short-long-term (bench top, room temperature) storage, and after going through freeze and thaw cycles and the analytical process. Conditions used in stability experiments should reflect situations likely to be encountered during actual sample handling and analysis. The procedure should also include an evaluation of analyte stability in stock solution.
Freeze and Thaw Stability
Short-Term Temperature Stability
Three aliquots of each of the low and high concentrations should be thawed at room temperature and kept at this temperature from 4 to 24 hours (based on the expected duration that samples will be maintained at room temperature in the intended study) and analyzed.
Long-Term Stability
The storage time in a long-term stability evaluation should exceed the time between the date of first sample collection and the date of last sample analysis. Long-term stability should be determined by storing at least three aliquots of each of the low and high concentrations under the same conditions as the study samples. The volume of samples should be sufficient for analysis on three separate occasions. The concentrations of all the stability samples should be compared to the mean of back-calculated values for the standards at the appropriate concentrations from the first day of long-term stability testing.
Stock Solution Stability
The stability of stock solutions of drug and the internal standard should be evaluated at room temperature for at least 6 hours. If the stock solutions are refrigerated or frozen it for the relevant period, the stability should be documented. After completion of the desired storage time, the stability should be tested by comparing the instrument response with that of freshly prepared solutions.
Post-Preparative Stability
The stability of processed samples, including the resident time in the autosampler, should be determined. The stability of the drug and the internal standard should be assessed over the anticipated run time for the batch size in validation samples by determining concentrations on the basis of original calibration standards.
1.5.8Recovery
The recovery of an analyte in assay is the detector response obtained from an amount of the analyte added and extracted from the biological matrix, compared to the pure authentic standard. Recovery pertains to the extraction efficiency of an analyticalal method within the limits of variability.
Recovery of the analyte need not be 100%, but the extent of recovery of an analyte and of the internal standard should be consistent, precise and reproducible.Recovery experiments should be performed by comparing the analyticalal results for extracted samples at three concentrations (low, medium and high) with unextracted standards that represent 100% recovery.
[%] Recovery = 100 x
Mean Response of Extracted Samples
Mean Response of Post Extracted Standards
1.6 Application of Validated Method to Routine Drug Analysis
Assays of all samples of an analyte in a biological matrix should be completed within the time period for which stability data are available. In general, biological samples can be analyzed with a single determination without duplicate or replicate analysis if the assay method has acceptable variability as defined by validation data. This is true for procedures where precision and accuracy variabilities routinely fall within acceptable tolerance limits. For a difficult procedure with a labile analyte where high precision and accuracy specifications may be difficult to achieve, duplicate or even triplicate analyses can be performed for a better estimate of analyte. A calibration curve should be generated for each analyte to assay samples in each analytical run and should be used to calculate the concentration of the analyte in the unknown samples in the run.
The following recommendations should be noted in applying a bioanalytical method to routine drug analysis:
A matrix-based standard curve should consist of a minimum of six standard points, excluding blanks (either single or replicate), covering the entire range.
function relationship between prestudy validation and routine run validation indicate potential problems.
The QC samples should be used to accept or reject the run. These QC samples are matrix spiked with analyte.
System suitability: Based on the analyte and technique, a specific SOP (or sample) should be identified to ensure optimum operation of the system used. Any required sample dilutions should use like matrix (e.g., human to human) obviating the need to incorporate actual within-study dilution matrix QC samples.
Repeat Analysis: It is important to establish an SOP or guideline for repeat analysis and acceptance criteria. This SOP or guideline should explain the reasons for repeating sample analysis. Reasons for repeat analyses could include repeat analysis of clinical or preclinical samples for regulatory purposes, inconsistent replicate analysis, samples outside of the assay range, sample processing errors, equipment failure, poor chromatography, and inconsistent pharmacokinetic data. Reassays should be done in triplicate if sample volume allows. The rationale for the repeat analysis and the reporting of the repeat analysis should be clearly documented.
1.7 Analytical Techniques in Bioanalysis
Chromatography is a separation technique by which solutes of two or more components are separated by a dynamic differential migrational process. In a system consisting of two phases, one of which moves continuously in a given direction and in which individual components exhibit differential mobility due to difference in their adsorption or partition or molecular size etc. Methods for separation of Drugs and their metabolites in biological sample can be developed, provided one has knowledge about the nature of the Drug, its molecular weight, polarity, pKa, ionic character and the solubility parameter. An exact recipe for HPLC, however, cannot be provided because method development involves considerable trial and error procedures. The most difficult problem usually is where to start, what type of column to be used with what kind of mobile phase.
1.7.1 Selection of Mobile Phase
Since mobile phase governs solute–stationary phase interaction
Practical considerations dictate that it should not degrade the equipment or column packing .So strong acids; bases and halides should be avoided.
Chemical purity of sample is important factor. Since large volume of solvents are pumped through the column. Trace amount of impurities can easily concentrate in column and eventually detrimental to the result. So HPLC grade solvents only recommended to use in the analysis
Volatility should be considered if sample recovery is required and mass transfer between solvent and stationary phase will be reduced. Water, acetonitrile, ethanol, 2 propanol & methanol are widely used solvents.
1.7.2 Role of solvent type
Chromatographic separations thus vary with solvent properties and are related to sample solubility, polarity and solvent strength. Solvents that interact strongly with the sample will increase the sample ion exit in the solvents and are not able to equilibrate with adsorbent surface. Changing the organic solvent will change the selectivity. In reverse phase, less polar solvent exhibit greater solvent strength than polar solvents .The solvents water (most polar), methanol, Acetonitrile and Tetrahydrofuran placed in ascending order of their polarity.
1.7.3 Selection of buffer and role of pH
pH is another factor in resolution equation that will affect the selectivity of the separation. In reverse phase HPLC, sample retention increases when the analyte is more hydrophobic .Thus when an acid (HA) or base (B) is ionized (converted in the form of unionized free or base) it becomes more hydrophilic and is less interactive with column binding sites.
Thus when selecting a buffer for a given application the following considerations are important. They are,
The buffer capacity is dependent on the buffer pH, pKa and buffer concentration.
1.7.4 Selection of column
HPLC column is the important tool for separation of analytes .So the column must posse•s
good selectivity, efficiency and reproducibility to provide good separation of analytes. Commonly used column are C-18, C-8, Phenyl, Cyano columns. They are chemically different bonded phase having different selectivity with same mobile phase.
1.8 Chromatographic Method
The presence of metabolites or more than one drug in a biological sample usually demands a more sophisticated separation for their measurement especially, when two or more drugs are of similar physical and chemical nature. Chromatography is a separation technique that is based on differing affinities of a mixture of solutes between at least two phases. The result is a physical separation of the mixture into its various components. The affinities or interactions can be classified in terms of a solute adhering to the surface of a polar solid (adsorption), a solute dissolving in a liquid (partition), and a solute passing through or impeded by a porous substance based on its molecular size (exclusion).
In the following sections, individual chromatographic techniques are discussed in relation to their usefulness as separation tools for drugs or metabolites in biological samples.
1.9 High Performance Liquid Chromatography
1.9.1Basic principle of HPLC
High performance liquid chromatography (HPLC) is a separation technique which is utilizing to differences in distribution of compounds in two phases called the stationary phase and the mobile phase. The stationary phase is a thin layer created on the surface of fine particles and the mobile phase is the liquid flowing over the particles. Under a certain dynamic condition, each component in a sample has a different distribution equilibrium depending upon the solubility in the phases and/ or molecular size. As a result, the components move at different speeds over the stationary phase and are thereby separated from each other. The column is a stainless steel (or resin) tube, which is packed with spherical solid particles. Mobile phase is constantly fed into the column inlet at a constant rate by a pump. The sample injected from a sample injector that are located near the column inlet. The injected sample enters the column with the mobile phase and the components in the sample migrate through it, passing between the stationary and the mobile phases. Compounds move in the column only when they are in the mobile phase. Compounds that are tending to be distributed in the mobile phase therefore migrate faster through the column while compounds that tend to be distributed in the stationary phase migrate slower. In this way, each component is separated on the column and sequentially elutes from the outlet. Each compound eluting from the column is detected by a detector connected to the outlet of the column. The separation process is monitored by the integrator from the time of injection to its elution, a graph is obtained. This graph is called a chromatogram.
1.9.2Elution Process
There are two modes of elution processes: Isocratic elution and Gradient elution.
1.9.2.1 Isocratic Elution
In an isocratic elution, a sample is injected onto a given column and the mobile phase composition remains unchanged through the time required for the sample components to elute from the column. No single isocratic elution can separate a complex mixture with adequate resolution in a reasonable time and with good detectibility. The isocratic separation of samples with widely varying k• (partition ratio) values typically exhibits poor resolution of
Figure 1 Isocratic LC System
1.9.2.2 Gradient Elution
Figure: 2 High-Pressure-Gradient Systems
1.9.3The general instrumentation for HPLC incorporates the following components
There is a solvent reservoir for the mobile phase.
The mobile phase must be delivered to the column by different types of pump. To obtain separations either based on short analysis time or under optimum pressure, a wide range of pressure and flow is desirable. The pumping system must be pulse-free or else have pulse damper to avoid generating baseline instability in the detector.
Sampling valves or loops are used to inject the sample in the flowing mobile phase just at the head of the separation column. Samples should be dissolved in a portion of the mobile phase to eliminate an unnecessary peak.
At the head of separation column there may be a guard column or an in-line filter to prevent contamination of the main column by small particulate.
To measure column inlet pressure, a pressure gauge is inserted in front of the separation column.
exclusion chromatography, or some other unique packing for a particular separation method.
[image:30.595.74.544.177.499.2] A detector with different type of data handling device completes the basic instrumentation.5
Figure 4 A Typical HPLC [Waters Alliance] System
1.9.4Mobile –Phase Delivery System (Pumps)
The mobile phase must be delivered to the column over a wide range of flow rates and pressure. A degasser is needed to remove dissolved air and other gases from the solvent. Another desirable feature in the solvent-delivery system is the capability for generating a solvent gradient. A pump should be able to operate at least 100 atm (1500 psi), a pressure suited to less expensive chromatographs. However, 400 atm (6000 psi) is a more desirable pressure limit. For many analytical columns only moderate flow rates of 0.5-2.0 ml/min need to be generated.
There are two groups according to the manner in which they Works:
1.9.4.1 Constant flow rate pumps:
pump outlet. When the piston direction is reversed, the check valves operate to allow solvent to flow from the outlet valve only.
e.g. Milton Roy Reciprocating Pump, Dual Piston Pump, Triple Piston Pumps.
The syringe drive pump is a constant displacement pump in which all of the mobile phase contained within the pump. It is, in effect, a single stroke displacement pump. A screw free drive connected to a stepping motor actuates the piston inside the chamber. The voltage input to the stepping motor controls the volume displaced by the pump per unit time. This type pump produces a pulse less flow and requires no check valves.
1.9.4.2 Constant pressure pumps:
Constant pressure pump can deliver a constant-flow- rate if it operates against a constant column backpressure and if the viscosity of mobile phase remains constant. Consequently temperature should be controlled. Since the mobile phase is in direct contact with the pressurized gas a significant amount of gas may be dissolved. Thus a piston of mobile phase may contain sufficient dissolved gases to produce bubble in the detector. The pneumatic amplifier pump (e.g. The Haskell Pump) is a modification of a simple gas displacement pump. The gas pressure is applied to a large piston that is connected to a smaller diameter piston in contact with the mobile phase. The pressure on the gas piston is translated to a higher pressure (per unit area) on the solvent.6
1.9.5Columns
1.9.6Standard columns
Many HPLC separations are done on columns with an internal diameter of 4 to 5 mm. Such columns provide a good compromise between efficiency, sample capacity, and the amount of packing and solvent required. Column packing feature particles those are uniformly sized and mechanically stable. Particle diameters lie in the range 3-5 µm, occasionally up to 10 µm or higher for preparative chromatography. The columns are classified into various categories depending on their carbon loading.
The various column parameters to be considered are:
Column length
Column internal diameter
Particle shape
Particle shape
Pore size
Surface area
End capping
Carbon load
Figure: 1.6-Column Hardware Examples
1.9.7Detector
The choice of detector is an important consideration. There is little use in running a separation if the detector one uses cannot see all the components of interest, or conversely, if it sees too much. The sensitivity of universal detector for HPLC has not been devised yet. Thus it is necessary to select a detector on the basis of compound under consideration,7
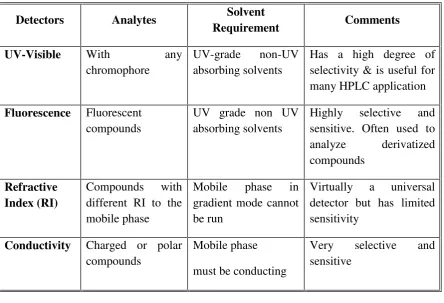
Table: 1 List of detector
Detectors Analytes Solvent
Requirement Comments
UV-Visible With any
chromophore
UV-grade non-UV
absorbing solvents
Has a high degree of selectivity & is useful for many HPLC application
Fluorescence Fluorescent
compounds
UV grade non UV absorbing solvents
Highly selective and sensitive. Often used to
analyze derivatized
compounds
Refractive Index (RI)
Compounds with
different RI to the mobile phase
Mobile phase in
gradient mode cannot be run
Virtually a universal detector but has limited sensitivity
Conductivity Charged or polar
compounds
Mobile phase
must be conducting
Very selective and
1.9.8Normal Phase Liquid chromatography
Normal-phase liquid-liquid chromatography uses a polar stationary phase and less polar mobile phase. To select an optimum mobile phase, it is best to start with a pure hydrocarbon mobile phase such as heptanes. If the sample is strongly retained, the polarity of the mobile phase should be increased, perhaps by adding small amounts of methanol or dioxane. In the normal phase mode, separation of oil-soluble vitamins, essential oils, nitrophenols, or more polar homologous series have been performed using alcohol/heptanes as the mobile phase.
1.9.9Reverse Phase Liquid chromatography
Reverse phase chromatography uses hydrophobic bonded packing, usually with an octadecyl or octyl functional group and a polar mobile phase, often a partially or fully aqueous mobile phase. Polar substances prefer the mobile phase and elute first. As the hydrophobic character of the solutes increases, retention increases. Generally, the lower the polarity of the mobile phase, the higher is its eluent strength. The elution order of the classes of compounds in table is reversed (thus the name reverse-phase chromatography). Hydrocarbons are retained more strongly than alcohols. Also, the eluent strength of the various solvents in reverse-phase chromatography follows approximately the reverse order given in table. Thus water is the weakest eluent. Methanol and acetonitrile are popular solvents because they have low
Electrochemical Readily oxidizable
or reducible
compounds, especially
biological samples
Mobile phase
must be conducting
Very selective and
sensitive
Evaporative Light Scattering
Virtually all
compounds
Fully gradient
compatible, no
limitation on solvent choice
A universal detector which is highly sensitive but not selective.
Mass
Spectrometer
Broad range of
compounds
Must be volatile
solvents & volatile buffers
Highly sensitive and is
powerful 2nd
1.9.10 Liquid chromatograph
It is the way of interfacing the phase domain of liquid chroma
1.9.11 Need of LC system int
The separation is done prior to directly determining every ana regarded as a part of prepara linearity, accuracy and better se
Mass spectrometer provides development because endogenous as these component posses• pre
the mobile phase and transfer which chromatographic separa analysis. LC/MS is highly effe spectrometer.
1.9.12Instrumentation
Figur
aphy and mass spectrometry
he high vacuum domain of mass spectrometer w omatography.
interfacing with mass spectrometer
or to mass analysis because the mass spectrome analyte in all type of sample. The Liquid chrom parative procedure required for sample clean up
r sensitivity.
des greater selectivity and sensitivity for enous matrix can co elutes with analyte yet not posses• precursor masses. The main purpose of interfa
nsfer the analyte from the higher pressure/atmosphe paration is achieved to the lower pressure requi
ffective interface for coupling liquid chromatogr
gure 7 Instrumentation of mass spectrometry
r with the condensed
ometer is incapable of hromatography can be n up which improves
or chromatographic not interferes as long erface is to evaporate ospheric pressure at equired for the mass tography to the mass
1.9.13Sample inlet system
There are two opinions of a sample inlet system
The sample introduced as neutral species through a controlled vacuum leak followed by ionization in vacuum chamber.
Create the ion at atmospheric pressure and then introduced the ion in to the mass spectrometer through a controlled vacuum leak with aid of electrostatic this process is called API (atmospheric pressure ionization) provide best way when a dynamic coupling of liquid chromatograph done.
1.9.14Ionization source
Ionization proceeds by two fundamental processes:
Loss/gain of an electron
Loss/gain of a charge particle
An odd electron ions is generated by the gain/loss of an electron. In vacuum generating method ionic species of identical nominal molecular weight differ only by the mass of an electron to the neutral specie from which it was generated.
An even electron is produced by gain or loss of even electron specie from a molecule.
There are four common modes of ionization
Electron ionization (EI)
Chemical ionization (CI)
Matrix-Assisted Laser desorption Ionization (MALDI)
Atmospheric pressure ionization (API)
In LC/MS interfacing Atmospheric Pressure Ionization (API) is the potential Ionization techniques because
It gives softer ionization
1.9.15Type of API Source
Atmospheric Pressure Electro Spray Ionization
Atmospheric Pressure Chemical Ionization
1.9.16Atmospheric Pressure Electro Spray Ionization
It is an atmospheric ionization technique in which ions are generated in the solution phase by evaporation of carrier solvent and ions are produced in gas phase. An appropriate solvent from LC (liquid chromatographic) system is passed through a metal capillary to which a static DC voltage is applied to create ionization of effluents. When the solvent got evaporate the charge density increases creating columbic repulsion and subsequent dissociation of droplet. Further evaporation of droplet creates an environment in which charge transfer takes place from the solvent to the analyte. Typically a voltage of 2.5 to 5 kV will be applied to generate an even electron ion in gas phase. This method is commonly used for high molecular compounds. Low ionization is observed in this technique due to solvent clustering and analyte adduct formation, so this is most applicable for LC/MS system.
1.9.17Atmospheric Pressure Chemical Ionization
It is an ionization technique in which the ionization occurs not in vacuum but at atmospheric pressure. It is gas phase ionization process whereby gas phase molecules are isolated from the carrier solvent before ionization. Generally less polar compounds are ionized by this method.
1.10 Glossary
Accuracy: The degree of closeness of the determined value to the nominal or known true
value under prescribed conditions. This is sometimes termedtrueness.
Analyte:A specific chemical moiety being measured, which can be intact drug, biomolecule
or its derivative, metabolite, and/or degradation product in a biologic matrix.
Analytical run (or batch): A complete set of analytical and study samples with appropriate
Biological matrix:A discrete material of biological origin that can be sampled and processed in a reproducible manner. Examples are blood, serum, plasma, urine, feces, saliva, sputum, and various discrete tissues.
Calibration standard: A biological matrix to which a known amount of analyte has been
added orspiked. Calibration standards are used to construct calibration curves from which the concentrations of analytes in QCs and in unknown study samples are determined.
Internal standard: Test compound(s) (e.g. structurally similar analog, stable labeled
compound) added to both calibration standards and samples at known and constant concentration to facilitate quantification of the target analyte(s).
Limit of detection (LOD): The lowest concentration of an analyte that the bioanalytical
procedure can reliably differentiate from background noise.
Lower limit of quantification (LLOQ): The lowest amount of an analyte in a sample that
can be quantitatively determined with suitable precision and accuracy.
Matrix effect:The direct or indirect alteration or interference in response due to the presence
of unintended analytes (for analysis) or other interfering substances in the sample.
Method:A comprehensive description of all procedures used in sample analysis.
Precision:The closeness of agreement (degree of scatter) between a series of measurements
obtained from multiple sampling of the same homogenous sample under the prescribed conditions.
Quantification range: The range of concentration, including ULOQ and LLOQ, that can be
reliably and reproducibly quantified with accuracy and precision through the use of a concentration-response relationship.
Recovery:The extraction efficiency of an analytical process, reported as a percentage of the
known amount of an analyte carried through the sample extraction and processing steps of the method.
Reproducibility: The precision between two laboratories. It also represents precision of the
method under the same operating conditions over a short period of time.
Sample: A generic term encompassing controls, blanks, unknowns, and processed samples,
as described below:
Blank:A sample of a biological matrix to which no analytes have been added that is used to
assess the specificity of the bioanalytical method.
Unknown:A biological sample that is the subject of the analysis.
Selectivity:The ability of the bioanalytical method to measure and differentiate the analytes
in the presence of components that may be expected to be present. These could include metabolites, impurities, degradants, or matrix components.
Stability:The chemical stability of an analyte in a given matrix under specific conditions for
given time intervals.
Standard curve: The relationship between the experimental response value and the
analytical concentration (also called acalibration curve).
System suitability: Determination of instrument performance (e.g., sensitivity and
chromatographic retention) by analysis of a reference standard prior to running the analytical batch.
Upper limit of quantification (ULOQ): The highest amount of an analyte in a sample that
3. REVIEW OF LITERATURE
I. Salem, Musab Alkhatib, Naji Najib et al done LC-MS/MS determination of betamethasone and its phosphate and acetate esters in human plasma after sample stabilization.
Liljana Bogdanovska, Mirjana Popovska, Aneta Dimitrovska et al Studied the development and validation of RP-HPLC method for determination of betamethasone dipropionate in gingival
crevicular fluid.
Song Ja-park, Yun-je Kim et al done the Analysis of corticosteroids in urine by HPLC and thermospray LC-MS method.
Mahesh N. Samtani, Willam J et al studied for quantification of dexamethasone and corticosterone in rat biofluids and fetal tissue using highly sensitive LC/MS/MS method.
Valerie A. Frerichs, Kathleen. M. Tornatore et al performed determination of the glucocorticoids such as prednisone,prednisolone,dexamethasone and cortisol in human serum
using liquid chromatography coupled to tandem mass spectrometry.
Kumar V., Mostafa S.,Kayo M., et al done HPLC determination of dexamethasone in human plasma and its applications to an in vitro release study from endovascular stents.
N. Goyal, E. Goldberg et al done the determination of dexamethasone, dexamethasone 21-acetate and paclitaxel in a simulated biological matrix by RP-HPLC method.
S.A. Doppenschmitt, B. Scheidel, J.P. Surmannet alPerformed simultaneous determination of prednisolone, prednisolone acetate and hydrocortisone in human serum by high performance
liquid chromatography.
Majid, Oneeb, Akhlaghi, Fatemeh et al performed simultaneous determination of plasma prednisolone, prednisone and cortisol levels by high performance liquid chromatography.
Robert L Taylor, Dwaine Machacek et al validation of high throughput liquid chromatography-mass spectrometry method for prednisolone.
Syed Naeem Razzaq, Islam Ullah Khan et al done the Stability indicating HPLC method for the simultaneous determination of moxifloxacin and prednisolone in pharmaceutical
formulations.
Raval Kashyap, E.V.S. Subrahmanyam et al done the Development and validation of UV spectroscopy method for the estimation of prednisolone in bulk and dosage form.
Mohammed Shahid Ali, Mohsin Ghori et al done the Simultaneous Determination of Ofloxacin, Tetrahydrozoline Hydrochloride, and Prednisolone Acetate by High-Performance
Liquid Chromatography.
Ahi Shobha, Dubey Sachin et al done the Identification of Prednisolone, Methylprednisolone and Their Metabolites in Human urine using HPLC (+) ESI-MS/MS and Detection of Possible
Adulteration in Indian Herbal Drug Preparations.
Robert L. Taylor, Stefan K. Grebe, Ravinder J. Singh et al done the Quantitative, highly sensitive liquid chromatography-tandem mass spectrometry method for detection of synthetic
S.No. Parameter
1 Structure of Betametha
2 Drug category
3 Chemical formula
4 Molecular weight
5 IUPAC Name
6 Bioavilability
7 Half Life
8 Metabolism
9 Routes
4. DRUG PROFILE
Betamethasone
Description
thasone
Corticosteroid
C22H29FO5
392.461
(8S,9R,10S,11S,13S,14S,16S,17R)-9-fl
dihydroxy-17-(2-hydroxyacetyl)-10,13,16 6,7,8,9,10,11,12,13,14,15,16,17-dodec cyclopenta[a]phenanthren-3-one
-36-54 hours
hepatic CYP3A4
Oral,Topical,IM
-S.No. Parameter
1 Structure of Dexametha
2 Drug category
3 Chemical formula
4 Molecular weight
5 IUPAC Name
6 Bioavilability
7 Half Life
8 Metabolism
9 Routes
10 Excretion
Dexamethasone
Description
ethasone
Corticosteroid
C22H29FO5
392.461 g/mol
(8S,9R,10S,11S,13S,14S,16R,17R)-9- F
dihydroxy-17-(2-hydroxyacetyl)-10,13,16 6,7,8,9,10,11,12,13,14,15,16,17- dodec cyclopenta[a]phenanthren-3-one
80-90%
190 mins
Hepatic
Oral,IV,IM,SCandIO
Urine (65%)
-S.No. Parameter
1 Structure of Prednisolone
2 Drug category
3 Chemical formula
4 Molecular weight
5 IUPAC Name
6 Bioavilability
7 Half Life
8 Metabolism
9 Routes
10 Excretion
Prednisolone
Description
olone
Corticosteroid
C21H28O5
360.444 g/mol
(11β)-11,17,21-trihydroxypregna-1,4-di
-2-3 hours
Hepatic
Oral, Nasal, Rectal, IV, Injection
Urine
5. MATERIALS AND METHODS
5.1 List of materials used
1) API of Betamethasone, Dexamethasone & Prednisolone respectively.
2) Rat plasma
3) Solvents used for extraction process:
Water for HPLC grade (Millie Q or equivalet)
Ethyl acetate (HPLC grade)
Diethyl ether
Chloroform
Dichloromethane
5.2 Steps followed in developmental study
Study of literature review
Proposed protocols or parameters for extraction process & validation were established
Find out the probable correct Cmax for our drug.
Calculations to decide LLOQ, ULOQ/HQC, MQC.
Selection of internal standard
Procurement of plasma sample
Method optimization of sample with different solvent to get maximum %recovery
- Approximately analysis with 5 diff. solvents.
Individual reading for Blank plasma.
Individual reading for internal std.
Readings for calibration curve
- Singlet or doublet could be taken for each concentration.
Validation
- For Accuracy: 5 replicates of LQC, MQC and HQC for 5 days.
- Selectivity: 6 plasma obtained from 6 different sources.
Stability Studies
- Freeze-thaw method: LQC and HQC, 5 samples of each were freeze-thaw for 3
cycles of 12, 24 and 48hrs.
- Bench-top: Short term analysis between 2-24hrs.
- Long term analysis
- Plane stock solution stability.
Experimental studies were conducted
Analytical results were evaluated
Statistical evaluation was carried out
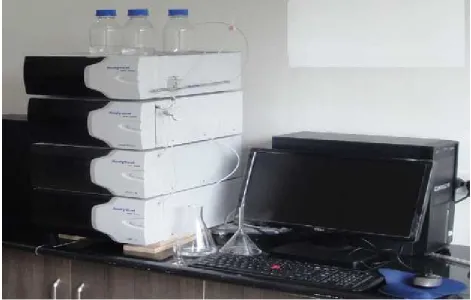
Fig. 5.1 Instrument information
System: HPLC Binary Gradient System
Model no.: HPLC 3000 Series
Company: Analytical Technologies Ltd.
Detector: UV-3000-M
Pump: P-3000-M Reciprocating (40MPa)
Column: Grace C18 (250mm x 4.6ID, Particle size: 5 micron)
Software: HPLC Workstation
Balance: Wenser High Precision Balance
Model: PGB 100
Max: 100gm Min: 0.001gm
Sonicator:Wenser Ultra Sonicator
Model: WUC- 4L
5.3 Methods used & optimization parameters
Name of Drug-Betamethasone
Development of chromatographic condition
The chromatogram was developed initially using separation condition such as mobile
phase (methanol:water in the ratio of 10:90 in increasing order). The system was used
Analytical technologies Lts. Model no. 3000Series as mentioned above. The optimized
chromatographic conditions were optimized using a mobile phase methanol:water in the
ratio of 60:40 at flow rate 0.9ml/min for betamethasone with the stationary phase was
used as Grace C18column(250mm x 4.6ID,partical size:5 micron).
Standard solution preparation
Standard solutions were prepared by using HPLC grade methanol and water in the ratio
1:1. Initially 10 mg of Betamethasone was weighted and transferred into the standard
flask.In that combined solvent (methanol and water) added and finally made the volume
with the same up to 100ml to get 100ppm stock solution. The stock solution further
serialy diluted and was used for the analysis. The stock solution was maintained
refrigerated at 8ºC.
Extraction method
In this process first take 1 ml of plasma from sample which is previously stored at 5-70C.
In this add 0.0125 milliliter of 1ppm of drug(Betamethasone) which is prepared in
methanol:water combination & 0.125 milliliter of 1ppm of internal standard. After this
vortex the above prepared mixture for 3 mins. Also in this add 0.200 milliliter of 1% of
hydrochloric acid to provide acidic nature to the plasma. Again vortex the above mixture
for 3-5 mins. In this add ethyl acetate which act as a extracting solvent & again vortex the
mixture for 3-5 mins. Now withdraw 2ml of ethyl acetate in which drug is extracted in
fresh tube & finally allow to evaporate the solvent which will leave dried drug in tube &
Table no 5.1 Summary for Older methods
Name of Authors (Literature review)
Analytical method
Mobile phase Column used Flow rate
Liming peng,tivader farcas etl
HP 1100 LC Formic acid:water Gemini 5µm,C18 150X3.0 mm 0.6ml/min Isam salem,musab alkhatib etl
LC-MS/MS - C8 column
-Robert taylor,Stefan geebe etl
LC-MS/MS Reversed phase
column
Table no 5.2 Summary for Optimized method
Column used Mobile phase Flow rate Wavelength Observation Result
Grace C18 (250mm x 4.6ID, Particle size: 5 micron)
Methanol:water (10:90)
0.9ml/min 242nm Poor resolution Method rejected Grace C18 (250mm x 4.6ID, Particle size: 5 micron)
Methanol:water (20:80)
0.9ml/min 242nm Very low resolution Method rejected Grace C18 (250mm x 4.6ID, Particle size: 5 micron)
Methanol:water (40:60)
0.9ml/min 242nm Poor resolution Method rejected Grace C18 (250mm x 4.6ID, Particle size: 5 micron)
Methanol:water (80:20)
0.9ml/min 242nm Poor resolution Method rejected Grace C18 (250mm x 4.6ID, Particle Methanol:water (50:50)
0.9ml/min 242nm Improved resolution
size: 5 micron)
Grace C18 (250mm x 4.6ID, Particle size: 5 micron)
Methanol:water (60:40)
0.9ml/min 242nm Good
resolution
Method accepted
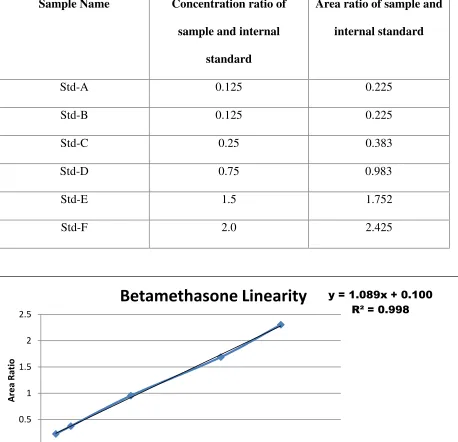
Table no 5.3 Different ranges of concentrations for preparation of standards for
Betamethasone
S.No Sample Concentration of Drug
(ng/ml)
Concentration of Internal
standard (ng/ml)
1 Std-A 10 80
2 Std-B 10 80
3 Std-C 20 80
4 Std-D 60 80
5 Std-E 120 80
6 Std-F 160 80
Name of Drug-Dexamethasone
Development of chromatographic condition
The chromatogram was developed initially using separation c

![Figure 4 A Typical HPLC [Waters Alliance] System](https://thumb-us.123doks.com/thumbv2/123dok_us/182840.52445/31.595.92.514.79.321/figure-a-typical-hplc-waters-alliance-system.webp)