2
eurostat
STATISTISCHES AMT DER EUROPAISCHEN GEMEINSCHAFTEN
STATISTICAL OFFICE OF THE EUROPEAN COMMUNITIES
OFFICE STATISTIQUE DES COMMUNAUTÉS EUROPÉENNES
L-2920 Luxembourg — Tél. (352) 43 01-1 — Télex COMEUR LU 3423
B-1049 Bruxelles, rue de la Loi 200 — Tél. (32-2) 299 11 11
Eurostat hat die Aufgabe, den
Informa-tionsbedarf der Kommission und aller am
Aufbau des Binnenmarktes Beteiligten
mit Hilfe des europäischen statistischen
Systems zu decken.
Um der Öffentlichkeit die große Menge an
verfügbaren Daten zugänglich zu machen
und Benutzern die Orientierung zu
erleichtern, werden zwei Arten von
Publi-kationen angeboten: Statistische
Doku-mente und Veröffentlichungen.
Statistische Dokumente sind für den
Fachmann konzipiert und enthalten das
ausführliche Datenmaterial:
Bezugs-daten, bei denen die Konzepte allgemein
bekannt, standardisiert und
wissenschaft-lich fundiert sind. Diese Daten werden in
einer sehr tiefen Gliederung dargeboten.
Die Statistischen Dokumente wenden
sich an Fachleute, die in der Lage sind,
selbständig die benötigten Daten aus der
Fülle des dargebotenen Materials
auszu-wählen. Diese Daten sind in gedruckter
Form und/oder auf Diskette,
Magnet-band, CD-ROM verfügbar. Statistische
Dokumente unterscheiden sich auch
optisch von anderen Veröffentlichungen
durch den mit einer stilisierten Graphik
versehenen weißen Einband.
Veröffentlichungen wenden sich an eine
ganz bestimmte Zielgruppe, wie zum
Beispiel an den Bildungsbereich oder an
Entscheidungsträger in Politik und
Ver-waltung. Sie enthalten ausgewählte und
auf die Bedürfnisse einer Zielgruppe
abgestellte und kommentierte
Informa-tionen. Eurostat übernimmt hier also eine
Art Beraterrolle.
Für einen breiteren Benutzerkreis gibt
Eurostat Jahrbücher und periodische
Veröffentlichungen heraus. Diese
enthal-ten statistische Ergebnisse für eine erste
Analyse sowie Hinweise auf weiteres
Datenmaterial für vertiefende
Unter-suchungen. Diese Veröffentlichungen
werden in gedruckter Form und in
Daten-banken angeboten, die in Menütechnik
zugänglich sind.
Um Benutzem die Datensuche zu
erleich-tem, hat Eurostat Themenkreise, d. h.
eine Untergliederung nach Sachgebieten,
eingeführt. Daneben sind sowohl die
Statistischen Dokumente als auch die
Veröffentlichungen in bestimmte Reihen,
It is Eurostat's responsibility to use the
European statistical system to meet the
requirements of the Commission and all
parties involved in the development of the
single market.
To ensure that the vast quantity of
ac-cessible data is made widely available,
and to help each user make proper use of
this information, Eurostat has set up two
main categories of document: statistical
documents and publications.
The statistical document is aimed at
spe-cialists and provides the most complete
sets of data: reference data where the
methodology is well-established,
stand-ardized, uniform and scientific. These
data are presented in great detail. The
statistical document is intended for
ex-perts who are capable of using their own
means to seek out what they require. The
information is provided on paper and/or
on diskette, magnetic tape, CD-ROM. The
white cover sheet bears a stylized motif
which distinguishes the statistical
docu-ment from other publications.
The publications proper tend to be
com-piled for a well-defined and targeted
public, such as educational circles or
political and administrative
decision-makers. The information in these
docu-ments is selected, sorted and annotated
to suit the target public. In this instance,
therefore, Eurostat works in an advisory
capacity.
Where the readership is wider and less
well-defined, Eurostat provides the
infor-mation required for an initial analysis,
such as yearbooks and periodicals which
contain data permitting more in-depth
studies. These publications are available
on paper or in videotext databases.
To help the user focus his research,
Eurostat has created 'themes', i.e. subject
classifications. The statistical documents
and publications are listed by series: e.g.
yearbooks, short-term trends or
method-ology in order to facilitate access to the
statistical data.
Y. Franchet
Director-General
Pour établir, évaluer ou apprécier les
dif-férentes politiques communautaires, la
Comrfiission européenne a besoin
d'infor-mations.
Eurostat a pour mission, à travers le
sys-tème statistique européen, de répondre
aux besoins de la Commission et de
l'en-semble des personnes impliquées dans
le développement du marché unique.
Pour mettre à la disposition de tous
l'im-portante quantité de données accessibles
et faire en sorte que chacun puisse
s'orienter correctement dans cet
ensem-ble, deux grandes catégories de
docu-ments ont été créées: les docudocu-ments
statistiques et les publications.
Le document statistique s'adresse aux
spécialistes. Il fournit les données les plus
complètes: données de référence où la
méthodologie est bien connue,
standar-disée, normalisée et scientifique. Ces
données sont présentées à un niveau très
détaillé. Le document statistique est
des-tiné aux experts capables de rechercher,
par leurs propres moyens, les données
requises. Les informations sont alors
disponibles sur papier et/ou sur disquette,
bande magnétique, CD-ROM. La
couver-ture blanche ornée d'un graphisme stylisé
démarque le document statistique des
autres publications.
Les publications proprement dites
peu-vent, elles, être réalisées pour un public
bien déterminé, ciblé, par exemple
l'enseignement ou les décideurs
politi-ques ou administratifs. Des informations
sélectionnées, triées et commentées en
fonction de ce public lui sont apportées.
Eurostat joue, dès lors, le rôle de
conseil-ler.
Dans le cas d'un public plus large, moins
défini, Eurostat procure des éléments
nécessaires à une première analyse, les
annuaires et les périodiques, dans
les-quels figurent les renseignements
adé-quats pour approfondir l'étude. Ces
publications sont présentées sur papier
ou dans des banques de données de type
vidéotex.
Cataloguing data can be found at the end of this publication
Luxembourg: Office for Official Publications of the European Communities, 1997
ISBN 92-828-0737-1
TABLE OF CONTENTS
INTRODUCTION IX
THE DEMOGRAPHIC SITUATION IN THE EUROPEAN UNION X
EXPLANATORY NOTES XVIII
LIST OF GROUPS OF COUNTRIES XXVII
DESCRIPTION OF EUROSTATS DEMOGRAPHIC DATABASE XXIX
DESCRIPTION OF THE DEMOGRAPHIC STATISTICS 1997 DISKETTE XXXI
EUROSTAT PUBLICATIONS XXXIII
LIST OF NATIONAL STATISTICAL INSTITUTES XXXIV
A - POPULATION CHANGE
Tables:
A-1
A-2
A-3
A-4
A-5
Population change in EUR 15, 1960—1996 3
Crude rate of natural increase, 1960—1995 4
Crude rate of net migration, 1960—1995 4
Crude rate of increase, 1960—1995 4
Population change, 1995 6
Figures:
A-1
A-2
A-3
Total population in EUR 15 2
Population increase in EUR 15 2
Live births and deaths in EUR 15 2
Β - POPULATION STRUCTURE
Tables:
B-1: Population on 1 January, total, 1960—1996 10
B-2: Population on 1 January, males, 1960—1996 12
B-3: Population on 1 January, females, 1960—1996 14
B-4: Proportion of total population aged 0-14, 1960—1996 16
B-5: Proportion of total population aged 15-24, 1960—1996 16
B-6: Proportion of total population aged 65-79, 1960—1996 18
B-7: Proportion of total population aged 80+, 1960—1996 18
B-8: Age dependency ratio, 1st variant, 1960—1996 20
B-9: Age dependency ratio, 2nd variant, 1960—1996 20
B-10: Population by age group on 1 January 1995, total 22
B-11 : Population by age group on 1 January 1995, males 24
B-12: Population by age group on 1 January 1995, females 26
B-13: Population by age group on 1 January 1996, total 28
B-14: Population by age group on 1 January 1996, males 30
B-15: Population by age group on 1 January 1996, females 32
B-16: Proportion of population by age group and marital status on 1 January 1996, males 34
B-17: Proportion of population by age group and marital status on 1 January 1996, females 38
B-18: Average population, 1960—1995 42
B-19: Average population by age group, total, 1995 44
B-2: Population aged 15-64 and 20-59 years in EUR 15 8
B-3: Population aged 65+ and 60+ years ¡n EUR 15 8
B-4: Age dependency ratio in EUR 15 9
B-5: Dependency ratio of the young in EUR 15 9
B-6: Dependency ratio of the old in EUR 15 9
B-7: Age pyramid on 1 January 1996 by Member State 54
B-8: Population by citizenship group on 1 January 1996 by Member State 59
B-9: Population by citizenship group on 1 January 1995 in EUR 15 59
B-10: Main groups of non-nationals on 1 January 1995 in EUR 15 60
B-11 : Changes in non-nationals in EUR 15 60
C - THE EUROPEAN UNION AND ITS REGIONS
Table:
C-1: Main demographic indicators by region, 1994 76
Figures:
C-1
C-2
C-3
C-4
C-5
C-6
Population density, 1994 63
Crude rate of natural increase, 1994 65
Crude rate of net migration, 1994 67
Crude rate of increase, 1994 69
Proportion of total population aged 0-14 on 1 January 1994 71
Proportion of total population aged 65+ on 1 January 1994 73
D - THE EUROPEAN UNION IN THE WORLD
Tables:
D-1: Population of the major regions of the world, 1950—2025 97
D-2: Main demographic indicators for the major regions of the world, 1995 97
D-3: Main demographic indicators for the European countries, 1995 98
D-4: Main demographic indicators for the Mediterranean countries, 1995 104
Figures:
D-1
D-2
D-3
World population 92
Life expectancy at birth in Europe, males, 1994 93
Life expectancy at birth in Europe, females, 1994 95
E - FERTILITY
Tables:
E-1
E-2
E-3
E-4
E-5
E-6
E-7
E-8
Main indicators of fertility in EUR 15, 1960—1995 109
Live births, 1960—1995 110
Live births outside marriage, 1960—1995 110
Proportion of live births outside marriage, 1960—1995 110
Live births by parity by Member State, 1960—1995 112
E-13
E-14
E-15
E-16
Proportion of childless women by generation, 1930—1960 122
Proportion of women with only one child by generation, 1930—1960 122
Proportion of women with two children by generation, 1930—1960 124
Proportion of women with three children by generation, 1930—1960 124
Figures:
E-1
E-2
E-3
Total fertility rate and completed fertility in EUR 15 108
Mean age of women at childbearing by calendar year and generation in EUR 15 108
Fertility rates by age of the mother, by Member State 126
F - NUPTIALITY
Tables:
F-1: Main indicators of nuptiality in EUR 15, 1960—1995 133
F-2: Marriages, 1960—1995 134
F-3: Crude marriage rate, 1960—1995 134
F-4: First marriages, males, 1960—1995 136
F-5: First marriages, females, 1960—1995 136
F-6: Proportion of first marriages, males, 1960—1995 138
F-7: Proportion of first marriages, females, 1960—1995 138
F-8: Marriages of widowers, 1960—1995 140
F-9: Marriages of widows, 1960—1995 140
F-10: Marriages of divorced males, 1960—1995 142
F-11: Marriages of divorced females, 1960—1995 142
F-12: Total first marriage rate, males, 1960—1995 144
F-13: Total first marriage rate, females, 1960—1995 144
F-14: Mean age at first marriage, males, 1960—1995 146
F-15: Mean age at first marriage, females, 1960—1995 146
F-16: Proportion of ever-married males by generation, 1930—1960 148
F-17: Proportion of ever-married females by generation, 1930—1960 148
F-18: Divorces, 1960—1995 150
F-19: Crude divorce rate, 1960—1995 150
F-20: Total divorce rate, 1960—1995 152
F-21: Median marriage duration at divorce, 1960—1995 152
F-22: Proportion of marriages dissolved by divorce by marriage generation, 1955—1980 154
F-23: Median marriage duration at divorce by marriage generation, 1955—1980 154
Figures:
F-1: Marriages and divorces in EUR 15 132
F-2: Crude marriage and divorce rate in EUR 15 132
G - MORTALITY
Tables:
G-1
G-2
G-3
G-4
G-5
G-6
Main indicators of mortality in EUR 15, 1960—1995 159
Deaths, total, 1960—1995 160
Deaths, males, 1960—1995 160
Deaths, females, 1960—1995 160
Life expectancy at certain ages, males, 1960—1995 162
G-13: Neonatal mortality rate, 1960—1995 180
G-14: Early neonatal mortality rate, 1960—1995 180
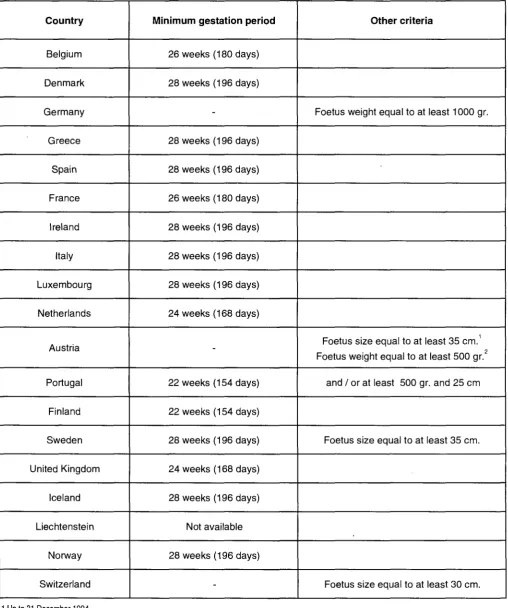
G-15: Stillbirths, 1960—1995 182
G-16: Late foetal mortality rate, 1960—1995 182
G-17: Perinatal mortality rate, 1960—1995 182
Figures:
G-1
G-2
G-3
G-4
Life expectancy at birth in EUR 15 158
Life expectancy at birth, difference between males and females in EUR 15 158
Infant mortality rate in EUR 15 158
Probabilities of dying by sex and age 184
H - INTERNATIONAL MIGRATION
Tables:
H-1
H-2
H-3
H-4
H-5
H-6
H-7
H-8
Total net migration, 1960—1995 192
Immigration, 1985—1995 194
Emigration, 1985—1995 196
Asylum-seekers, 1985—1994 198
Refugees, 1985—1994 198
Acquisition of citizenship, 1980—1995 200
Immigration by main groups of citizenship, 1995 202
Emigration by main groups of citizenship, 1995 202
Figures:
H-1
H-2
H-3
H-4
Total net migration in EUR 15 204
Immigration and emigration, 1995 204
Acquisition of citizenship in EUR 15 204
Immigration and emigration by main groups of citizenship, 1995 205
I - POPULATION PROJECTIONS
Tables:
1-1
I-2
I-3
I-4
I-5
Assumptions used for the most recent national forecasts 208
Population by age group on 1 January 2000, national forecasts 210
Population by age group on 1 January 2005, national forecasts 210
Population by age group on 1 January 2010, national forecasts 212
Population by age group on 1 January 2020, national forecasts 212
J - CENTRAL EUROPEAN COUNTRIES, CYPRUS AND MALTA
Tables:
J-1
J-2
J-3
J-4
J-5
J-6
Population on 1 January, total, 1960—1996 218
Live births, 1960—1995 218
Deaths, total, 1960—1995 218
Crude rate of natural increase, 1960—1995 220
J-11
J-12
J-13
J-14
J-15
J-16
J-17
J-18
J-19
J-20
J-21
J-22
J-23
J-24
Total fertility rate, 1960—1995 228
Net reproduction rate, 1960—1995 228
Mean age of women at childbearing, 1960—1995 230
Completed fertility by generation, 1945—1960 230
Marriages, 1960—1995 232
Crude marriage rate, 1960—1995 232
Total first marriage rate, females, 1960—1995 234
Mean age at first marriage, females, 1960—1995 234
Divorces, 1960—1995 236
Crude divorce rate, 1960—1995 236
Life expectancy at birth, males, 1990—1995 238
Life expectancy at birth, females, 1990—1995 239
Deaths of children under one year, 1960—1995 240
Infant mortality rate, 1960—1995 240
Figures:
J-1
J-2
J-3
Total population in CEC 217
Population increase in CEC 217
Live births and deaths in CEC 217
INTRODUCTION
Eurostat's
"Demographic Statistics 1997"
sets out
data relating not just to the European Union and its 15
Member States, but also to the other member
countries of the European Economic Area and
Switzerland and also, for the first time, to the
countries of Central Europe and Cyprus and Malta.
To avoid this publication becoming too bulky, events,
rates, and probabilities for each year of age are not
presented as tables, but in graph form.
Data by single years of age nevertheless remain
available in a database and on diskette, media which
will save users considerable time and will minimize
the risk of errors from multiple data acquisition.
Further information on these new demographic data
media is given in the following pages.
The tables have been compiled directly from the data
provided by the National Statistical Institutes of the 18
countries of the European Economic Area and
Switzerland, from the Council of Europe for the
countries of Central Europe, Cyprus and Malta and
from international publications (United Nations,
Council of Europe) for other non-member countries.
The data have been compiled using
SYSCODEM,
a
series of programs designed to ensure comparability
between countries. The system permits the use of a
common method for computation of the various
demographic indicators.
Eurostat's thanks go to the National Statistical
Institutes and the Council of Europe, whose
cooperation has been an essential factor in the
completion of this publication.
The EU and the world
Since 1950, the population of the present European
Union (fifteen countries) has increased by 26% and
the world population by 125%. Thus, whilst the Union
accounted for almost 12% of the world population in
1950, the figure had fallen to under 7% in 1996. With
a population of just under 373 million, it forms a
demographic grouping which ranks well below that of
China (1 220 million) or India (929 million), but
nonetheless above the Community of Independent
States (285 million) and the United States (267
million). The United Nations' mean projections ranks
the EU in this position vis-à-vis the above four
groupings until 2025.
Since 1990 the population of the Union has increased
by a total of 0.3% per year. For the world as a whole,
the increase is 1.5% per year, though the downward
trend is accelerating (it was 1.7% during the last
decade). The United States have a significantly
higher population growth than the Union (about 1.1%
per year).
The migrational flow plays an increasingly important
role in the demographic growth of the Union. In 1995
the migration balance accounted for almost three
quarters of the population increase. Net immigration
was about 800 000 persons, as in 1994, although this
represented a drop on 1992.
The natural population increase continues to decline.
In 1995, it was less than 300 000 persons, compared
with almost twice that in 1990. The rate is now only
0.08%, while it is more than 0.6% in the United
States.
The total fertility rate (1.43 children per woman in
1995) is less than half that for the whole world (2.96).
It is one of the lowest in the world, like that of Japan
v (1.48 children per woman). For North America thetotal fertility rate is 2.1 children per woman and for
Asia and South America 2.7. Only Africa still has a
very high figure of 5.5 children per woman.
Infant mortality remains high in Africa with 90 out of
every 1 000 babies born dying before the age of one.
In the European Union the proportion is 6%«, a rate
about 10 times less than the current average for the
world. Only Australia, Japan and Singapore do
better.
birth (without distinction between sexes) is only 52
years. It is almost 80 years for Japan, the country
with the highest average life span, but only 76 years
for the United States.
The European Union is one of the most densely
populated areas of the planet, with 116 inhabitants
per km
2, compared with 40 for the rest of the world.
On average, the population of the Union is older than
that of the rest of the world: the proportion of
under-lös is low (18% for the Union and 31% for the world)
and of over-65s high (15% and 7% respectively).
Longer life expectancy and the fall in fertility are
changing the age structure of the Union's population,
resulting in an "ageing" of the pyramid. These two
trends are now evident in most countries of the world,
with rare exceptions (lower life expectancy in some
countries of the Community of Independent States, a
continuing high level of fertility in some countries of
Sub-Saharan Africa).
The EU and Europe
The population of Europe (taken here as the
geographical continent which can be taken to include
Russia, Turkey, Azerbaijan and Armenia) with around
811 million persons at the beginning of 1996,
accounts for 14% of the population of the world.
Demographic growth is currently low in most
countries of Europe (between 0 and 1 % per year, but
usually around zero) and even negative in the
overwhelming majority of the countries of central and
eastern Europe. Almost everywhere, the natural
growth rate is in a narrow bracket around zero, whilst
the countries in which deaths exceed births are
generally in central and eastern Europe. Any
increase in population is therefore generally due to a
positive migratory balance.
The Russian Federation is the most populous country
in Europe (with 149 million inhabitants), followed by
Germany and Turkey (with 82 and 62 million
respectively).
the end of the 1980s, fertility has fallen dramatically in
the east of the continent, and is now approaching the
very low levels of southern Europe. In contrast, it has
remained stable in the west and north of the
continent, with Scandinavia recording the highest
fertility rate.
Fertility is increasingly independent of marriage, with
cohabitation outside marriage spreading to become
the norm for new couples in Scandinavia. The
proportion of births outside marriage is increasing
almost everywhere in Europe, although the disparities
between countries remain very high. The figure is
23% for the European Union, but 61% for Iceland and
less than 3% for Cyprus and Greece.
Consequently, marriage and divorce statistics have
less demographic weight. The steady decline in the
crude marriage rate (5.1 %» for the Union) and the
increase in the crude divorce rate (1.8%o for the
Union) offer only a very imperfect reflection of current
trends regarding the formation and dissolution of the
European family. The average age of women at first
marriage is above 25 years almost everywhere in
western Europe and above 28 years in northern
Europe, whereas in the east the figure remains below
23 years. In the rest of Europe, divorce rates are
lower, but are also on the increase.
Life expectancy at birth for men is over 76 years in
Sweden. In the fifteen countries of the Union it is over
71 years. In Europe, the shortest life expectancy is in
the Russian Federation (58 years). In the east of
Europe life expectancy for men has declined sharply
in many countries compared to the sixties, though not
for women. The shortest average life span for women
is recorded in Turkey, only 70 years. The life
expectancy of women is over 78 years in all countries
of the Union except Denmark. It is close to 82 years
in France and Switzerland.
Since 1980, the infant mortality rate has remained
close to 15%o for the countries of Central and Eastern
Europe, which is two and half times that for the Union
(5.6%o). Abortion would still appear to be used as a
birth control method, although this is difficult to
quantify in the absence of reliable data
(underestimates).
In the east of the continent, the migratory balance is
positive for the Russian Federation (0.34%), but
negative for Ukraine (-0.18%), positive for the Czech
Republic, Slovenia and Slovakia, but negative for
Poland, Rumania and for the Baltic countries. The
political changes which have occurred in this region
since the beginning of the decade have not resulted
in massive migratory flows towards the countries of
Over the same period, Italy and Spain, followed by
Portugal, have become countries of net immigration.
Iceland continue to record net emigration.
European Union: short and medium-term
trends
Slowdown in population growth
Population growth in the European Union is still
positive, but its current level (2.9%<>) is one third that
recorded at the beginning of the sixties. Over the
same period, the natural growth rate fell steadily
(from almost 8%<> to 0.8%<> in 1995). Surges in overall
growth, against the background of a medium-term
downward trend (e.g. 5.2%o in 1992 after 4.5%o in
1991), therefore simply reflect fluctuations in the
migratory balance. In 1995, the resident population
of the Union increased by 1.1 million persons, of
which 800 000 by net immigration.
The overall population increase was positive in all
fifteen countries of the Union. However, the natural
increase was negative in Germany (-1.4%<>) and in
Italy (-0.5%o). Ireland recorded a positive migratory
balance (+1.1%<>) in 1995.
Lowest ever total fertility rate
Between 1960 and 1975 the average age of women
at the birth of their first child fell, but has since
increased steadily in all the countries of the Union.
The resultant birth lag has compounded the fall in the
total fertility rate (1.43 children per woman in 1995
compared with 2.72 in 1965). In fact the real decline
in the number of children per woman (completed
fertility) from one generation to the next is much
slower. However, at 2.05 (compared with 2.2 for the
generation born in 1940), the completed fertility of the
generation born in 1945 is below the threshold of
generation replacement and would appear to be
unable to rise further. Given their current fertility rate,
it is also unlikely that the generations bom in the
fifties will exceed this threshold: projections situate
their ultimate fertility in a bracket of 1.8 to 1.9 children
per woman.
The proportion of births outside marriage changed
very slowly between 1960 and 1980, increasing from
5% to 10% for the Union as a whole. During the
following decade, the figure rose to 20%. The figure
is currently 23%, with Sweden holding the record
(53%). In Greece, the proportion of births outside
marriage has remained very low, 3% in 1995. In this
country, and in Italy which also has a relatively small
proportion of births outside marriage (7%), marriage
rates and the average age at first marriage continue
to have a direct impact on fertility.
Single people remain single for longer
In the 1960s the annual number of marriages relative
to the total population was around 8 %<> for the EU. In
1995 it was only 5.1 %o (5.2 in 1994).
Age at first marriage (men and women), which had
fallen in all countries of the Union during the 1960s
and the beginning of the 1970s, has since risen
steadily. This age is higher for men than for women in
all countries. In 1995, single people married earliest in
Portugal (24.8 years for women and 26.7 years for
men) and latest in Denmark (29.0 years and 31.4
years respectively).
In each generation, proportionally more men remain
single than women (a difference of about 8%).
However, the proportion of single people is increasing
for both sexes. Around 10% of the generation born in
1940 remain single, and around 20% of the
generation born in 1955 (it being very unlikely that
half of them will marry after the age of 40 years).
Sweden has the highest proportion of persons who
are still single at 40: for the 1955 generation, 38% of
men and 27% of women.
However, the proportion of remarriages in the total
number of marriages is rising steadily (17% in 1992).
This time it is men, either widowed or divorced, who
are more likely to remarry.
Mn the specific social climate in which we live the
current total first marriage rate (less than 50%)
therefore gives an artificially low indication of the
ultimate proportion of people who ever marry.
Increase of divorces proportional to population
growth
The annual number of divorces relative to the total
population was around 0.5%c> in the Union in the
1960s. It then rose to 1.7%« over the period to 1985
The total divorce rate is rising steadily (30% in 1995).
This implies that if current divorce risks persist,
almost one marriage in three is destined to be
dissolved by divorce in the countries of the Union.
The medium-term upward trend in life expectancy
continues
In the last fifteen years life expectancy at birth has
risen by about three years for both men and women.
The difference of around six and a half years in
favour of women has thus been fully maintained. The
figures for the latest period show that the fall in
mortality rates is particularly noticeable over the age
of 60, as a result of advances in health and living
conditions.
However, the level of infant mortality also continues
to fall: 5.6%o in 1995, compared with 7.6%» in 1990 (it
was 35%o in 1960). This fall in infant mortality is
mainly due to a fall in the number of deaths amongst
infants aged under one month.
The available figures reveal almost no change in life
expectancy in 1995 compared with 1994 (since the
figure was abnormally high for the latter year, this dip
is more likely to signify a return to the previous rate of
increase). Life expectancy is 73.9 years for men and
80.4 years for women. The differences in life
expectancy between the countries of the Union are
relatively small. On average women have the longest
lifespan (81.8 years) in France and the shortest in
Denmark (77.8 years) while men had the longest
lifespan in Sweden (76.2 years) and the shortest in
Portugal (71.3 years).
Non-national population: increase halted
Of the 372 million individuals resident in one of the
EU Member States on 1 January 1995, 95% had the
nationality of the country in which they were resident,
just under 2% had the nationality of another Union
country and 3% were citizens of non-Member States.
The increase in the non-national population in the
countries of the Union over the past decade is almost
entirely due to nationals from countries outside the
European Union. Their number increased from 7.5
million to 12 million between 1985 and 1995, whereas
the number of non-nationals who are citizens of
another Union country increased only by 300 000, to
a current figure of 5.5 million individuals.
Half of all naturalizations recorded in France and
in the Netherlands
In the last decade the number of naturalizations in the
15 Member States of the European Union almost
doubled, reaching some 330 000 persons in 1995. A
sharp increase was observed in 1989 (mainly in the
United Kingdom), which was cancelled out the
following year. Between 1990 and 1994 there was a
steady rise, mainly in the Netherlands, Germany and
Sweden and then mainly in France.
In 1995 there were fewer naturalizations than in the
previous year in Germany and the United Kingdom
but, in" contrast, the figures were unusually high in
France (more than 92 000) and in the Netherlands
(more than 71 000). Thus these two countries
recorded almost half the total number of
naturalizations in the Union.
Each year new naturalizations account for just under
2% of non-national residents. The ratio of
naturalizations to non-national population is highest in
the Netherlands and in Sweden (between 6% and
7%).
emigrants leaving Germany were also low, but those
leaving the Netherlands rose.
New drop in the number of asylum seekers
The number of applications for asylum made to
Member States of the EU was relatively stable
between 1985 and 1987. It then rose spectacularly as
from 1988, reaching a record high in 1992 (674 000).
Since then the general trend has been towards a
marked reduction in numbers. In 1995, when
272 000 applications were recorded, numbers were
12% down on 1994. Only the United Kingdom
recorded a sharp increase in the number of asylum
seekers (55 000, i.e. + 30%), replacing the
Netherlands (29 000) in second place among
countries of registration, after Germany (128 000).
The other countries of the Union, with the exception
of France (20 000), have received fewer than 12 000
asylum seekers, numbers being particularly low in the
countries of southern Europe. Nationals of former
Yugoslavia remained the largest group of asylum
seekers in 1995, ahead of Turkish nationals.
Halt to the decline in immigration
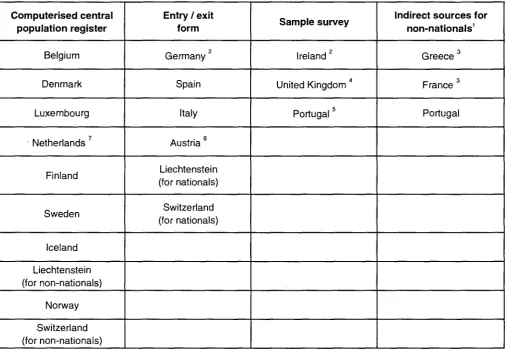
Differing national definitions lead to discrepancies in
the statistics supplied by the individual countries on
international migration, hampering comparisons by
bias which is difficult to measure (cf. Explanatory
notes). As a general rule, however, immigrants, apart
from non-nationals recently arrived in a country, also
include nationals returning to their country after a
period of residence abroad. Emigrants likewise
include nationals leaving their country for another,
and non-nationals leaving their country of residence
for another.
In Luxembourg, the annual number of immigrants is
2.5% of the resident population, and in Germany,
Austria and Sweden it is between 1 and 1.5%. The
annual number of emigrants is between 1 and 1.5%
of the resident population in Luxembourg, Ireland and
Austria. Elsewhere migratory flows do not exceed
1% of the resident population.
In absolute figures, Germany receives by far the
largest number of immigrants (more than a million),
followed by the United Kingdom (nearly 250 000).
Similarly Germany has the highest number of
emigrants (almost 800 000), followed by the United
Kingdom (almost 200 000).
In 1995, flows of immigrants increased sharply in
Principal demographic trends in the
countries of Central Europe
The changing context
Since 1990 the countries of Central Europe (CECs)
have experienced a new wave of demographic
changes, particularly in the field of relational and
reproductive behaviour. These rapid demographic
changes are a reflection of the radical political,
economic and social changes which the countries of
this region are currently undergoing.
of legal marriage have decreased, pointing to the
appearance of new types of living arrangements,
particularly cohabitation. Whereas in most of these
countries traditions and social norms previously
promoted the marriage-based family, since the late
1980s the important changes in reproductive
behaviour have been mainly associated with changes
in union formation. Examples of this cultural shift are
premarital sexual relations, non-marital cohabitation,
an increase in mean age at first marriage, one-parent
families and one-person households.
As far as mortality is concerned, many CECs have
experienced a decline in life expectancy over the last
few years. The prolonged stagnation in the eighties
and early nineties, followed by the recent decline,
could be associated in some of these countries with a
crisis in the public health system. This crisis will
probably continue for some time and increase social
and regional inequality before death.
In some countries, such as the Czech Republic,
Poland, the Slovak Republic and Slovenia, mortality is
already decreasing. It can therefore be expected that
life expectancy will sooner or later recover in all the
countries.
Infant mortality rates, far from being equal, show a
more or less downward trend. The decline could
continue even further, but with a smaller contribution
to the increase in life expectancy than mortality in the
adult (especially for males) or older age groups.
Population continues to decrease
At the beginning of 1996 the total population of the
CECs considered was about 110 million, an
estimated decrease of around 62 thousand compared
with the previous year. The countries show a wide
variation in population size, from 1.5 million
inhabitants in Estonia to over 38.6 million in Poland.
In 1995 the population living in Central Europe
represented less than one-third of the European
Union population.
In the last decade the dynamics of population in the
CECs changed dramatically. Recently, more and
more countries have reported negative population
growth. For most countries the reason was the
negative values for both the components of
population growth: net migration and natural increase.
In 1995 around 80% of this decrease was due to net
migration.
The exceptions were Slovenia (with values near zero)
countries. In the seventies and early eighties, natural
increase was positive in all countries, while after 1990
only Poland, the Slovak Republic and Slovenia
reported positive values. The highest negative levels
of net natural increase were registered in Bulgaria
(-5.1 %o) and Estonia (-4.9%o).
After 1990, the opening up of the borders of the
countries of central Europe and the radical political,
economic and social changes caused new
international migratory flows, resulting in net
emigration in almost all countries. In the last few
years, only Slovenia, the Slovak Republic and the
Czech Republic have recorded a positive balance for
net migration. In 1995 the Baltic States, especially
Estonia (-5.5%o) and Latvia (-4.2%0), still reported the
highest negative values for net migration.
Nevertheless, data for 1995 show a decline in
emigration flows. The migration pressure from Central
Europe continues to be less significant than at the
beginning of the 1990s.
As in the rest of Europe, the population of the CECs
is tending to age, although in this region the process
of ageing started later, due mainly to the high levels
of fertility. The highest value for the proportion of
persons aged over 65 was reported by Bulgaria
(15.2). The proportion of elderly people (aged over
65) is less than one-tenth in Albania (5.8) and
FYROM (8.7).
In spite of the general increase in male mortality, the
ageing process has accelerated somewhat in recent
years as a result of the steep decline in live births.
However, this region still has relative high proportions
of children.
Women are bearing fewer and fewer children
Low fertility rates continue to prevail in the majority of
the CECs, most of which have abandoned
pro-natalist population policies and joined southern
Europe in terms of the low fertility levels. In 1995
probably only Albania and FYROM had a total fertility
rate higher than 2.1. With a total fertility rate of less
than 1.3, Bulgaria, Latvia and Slovenia are situated at
the other end of the scale.
It is therefore assumed that the decline in fertility
rates at young ages will not be fully offset by an
increase at higher ages. As a consequence, the
decline of cohort completed fertility will continue for
young cohorts. In some countries, such as Bulgaria,
Estonia, Latvia, Lithuania, Romania, first births
already account for more than 50% of all births.
Fourth and higher-order births are rapidly becoming a
rarity.
The mean age of women at first birth has increased
steadily over recent years, but has remained
relatively low compared with levels in EU countries.
The reasons for this may well lie in the social and
family policies pursued by the former regimes in
these countries in order to encourage child-bearing
and in a very low level of family-planning education.
Following the changes in the population policies, the
abortion rates went up dramatically in all the CECs. It
seems that abortion has been used as a method of
family planning.
Substantial rise in the proportion of births
outside marriage
The proportion of extra-marital births, especially in
younger cohorts, is increasing in almost all countries.
Whereas the percentage remained more or less
stable between 1970 and 1980, since 1985 (and in
some cases since 1990) numbers have virtually
doubled. In 1995, the highest proportions were
recorded in Estonia (44%) and Slovenia (29%).
Estonia reported that half of the children were born to
cohabiting couples. A low proportion of extra-marital
births, under 10%, can be found only in FYROM and
Poland.
Marriage patterns have changed over the past few
years. Although early marriage is still widespread,
there has been a slight increase in the mean age at
marriage and in the number of consensual unions.
And because childbirth within a marriage is still
predominant in these countries, this is closely related
to the rising mean age of women at their first birth.
There are significant differences in crude marriage
rates, with high rates in FYROM, Romania (more than
6.5%o) and Lithuania (6%o), and low rates (less than
5%o) in Slovenia, Bulgaria, Latvia and Estonia.
The total first marriage rate for females shows a
general decline. Twenty years ago in almost all the
countries, this indicator was higher than 90%. In 1995
all countries recorded a level of 50-70%. First
marriages among young people have, in particular,
reflects the rapidly increasing number of consensual
unions.
Divorces continue to fluctuate
In recent years the tendency to dissolve marriages
would seem to have fluctuated to a greater or lesser
degree in most of the CECs. In some countries (the
Czech Republic and Hungary), the number of
divorces has stabilized at a relatively high level during
the last fifteen years. Romania, Estonia, Slovenia
reported that fluctuation in the level of divorces in
recent years is a short term phenomena, mainly
determined by the changes in legislation.
The total divorce rate shows a wide variation, ranging
between 37% in the Czech Republic and 14% in
Slovenia, with most countries recording a value
nearer to the former.
In 1995 the highest levels in crude divorce rates were
recorded in the Baltic States (Estonia 5.0%o, Latvia
3.1 %o, and Lithuania 2.8%o) and in the Czech
Republic (3.0%o), while FYROM (0.3%o) and Slovenia
(0.8%o) recorded the lowest levels.
Life expectancy: the gap between males and
females widens
After a period of stagnation and, in some cases, of
improving levels of mortality, many countries have
experienced a decline in male life expectancy in
recent years. Female mortality has continued to
improve, though at a much slower rate than in other
European countries. Only in the Baltic States was a
reduction over the 1980 values recorded in life
expectancy at birth for both sexes. Since 1980,
female life expectancy has risen by more than 2
years in Bulgaria (3.3 years), the Czech Republic (2.7
years) and Slovak Republic (2.2 years).
The differences between male and female life
expectancy at birth have therefore widened. The
maximum values of the gender gap are to be found in
Estonia (12.6 years) and Lithuania (11.6 years).
Life expectancy at birth is currently highest for women
in Slovenia (77.8 years), the Slovak Republic (76.5
years) and Poland (76.4 years) and for men in
Slovenia (70.3 years) and FYROM (70.1 years). The
lowest values are recorded in Latvia: 60.7 years for
men and 72.9 years for women.
Compared with general mortality, infant mortality
rates show a downward trend in most countries,
although in some - Albania (estimated at 23%o),
FYROM (22.7%o) and Romania (21.2%o) - the levels
are still very high. Values under 10%<> were recorded
only in the Czech Republic (7.7%o) and Slovenia
(5.5%o). Compared with the previous year, only Latvia
and Estonia reported somewhat higher values.
Due to lack of information, however, there is no way
of knowing for sure if this is the result of changes in
the intensity of infant mortality or of changes in the
definitions used.
Migration: net outflows are decreasing?
Since the fall of the Iron Curtain, more and more
countries have been subject to population loss due to
migration. In 1995, the only countries with net
immigration are the Czech Republic (1.0%o), the
Slovak Republic (0.5%°) and Slovenia (0.4%o). All the
data are not yet available on the number of
Hungarian citizens leaving the country or returning,
Hungary has reported zero net migration in the past
few years.
However, the recent figures show that East-West
migration is slowing down. As far as the European
Union is concerned, the preferred destinations of
those leaving Central Europe in 1994 were Germany
and the UK.
Compared with the period before 1990, countries now
report that migration flows are mainly for economic
and not political reasons. In the short term, provided
the economies continue to recover, migration flows
are expected to decrease rather than increase.
Main demo
EUR 15 Belgium Denmark Germany Greece Spain France Ireland Italy Luxembourg Netherlands Austria Portugal Finland Sweden United Kingdom Iceland Liechtenstein Norway EEA Switzerlandgraphic indicators
Population at 1.1.1996 (1000)372 653.6 p
10143.0 5 251.0 81 817.5 10 465.1 39 241.9 58 255.9 p
3 615.6 p
57 333.0 412.8 15 493.9 8 054.8 9 920.8 5116.8 8 837.5 58 694.0 p
268.0 30.9 4 370.0
377 322.4 P
7 062.4
Natural increase
(1000)
279.6 p
9.9 p 6.6 -119.4 1.3 17.1 P 195.8 p 17.0 -25.9 p
1.6 54.8 7.5 3.2 13.8 9.5 86.6 2.4 0.2 15.1
297.3 P
18.8
-1995
Net migration 1
(1000)
787.3 P
2.6 P 28.7 398.3 20.9 47.4 P 40.0 P 3.9 P 90.3 P 4.6 14.9 7.4 5.4 4.3 11.6 107.2 P
-1.4 0.1 6.4
792.5 P
24.5
Total increase
(1000)
1 067.0 p
12.5 35.3 278.9 22.2 64.6 235.8 P
20.9 p 64.4 6.2 69.8 14.9 8.6 18.1 21.1 193.7 P
1.0 0.3 21.5
1 089.8 P
43.3 Gross marriage rate (per 1000 inhabitants)
5.1 p
5.1 6.6 5.3 6.1 5.0 P 4.4 p 4.3 P 4.9 p 5.1 5.3 5.3 6.6 4.6 3.8 5.5 P 4.6 13.2 5.0
5.1 P
5.8
Crude divorce rate
(per 1000 inhabitants)
1.8 p
3.5 2.5 2.1 1.1 0.8 P 2.0 P
-0.5 1.8 2.2 2.3 1.2 2.7 2.6 2.9 P 1.9 1.2 2.4 1.8 p 2.2 Total fertility rate 1.4* 1.6 1.8 1.3 1.3 1.2 * 1.7 P 1.9 P*
1.2 1.7 1.5 1.4 1.4 1.8 1.7 1.7 P 2.1-1.9 1 . 4 * 1.5 Infant mortality rate (per 1000 live births)
5.6 P
6.1 5.1 5.3 8.1 5.5 P 4.9 P 6.4 6.2 P 5.5 5.5 5.4 7.5 3.9 4.1 6.2 6.1
-4.05.6 P
5.0
Ië4j
eurostatLive expectancy at birth
Males Females
73.9 * 80.4 *
73.4 80.2 72.7 77.8 73.3 79.7 75.0 80.3 74.3 * 81.5 * 73.9 P 81.8 P 73.0 P 78.6 P 74.9 * 81.4 * 73.0 80.2 74.6 80.4 75.6 80.1 71.3 78.6 72.8 80.2 76.2 81.4 74.0 P 79.2 P 75.9 80.0
-74.8 80.8
73.9 * 80.4 * 75.3 31.7
CEC Albania Bulgaria Czech Republic Estonia F.Y.R.O.M. Hungary Latvia Lithuania Poland
Romania
SlovakiaSlovenia
Cyprus Malta 8 384.7 10 321.31 476.3
10 212.3 2 529.53 711.8
38 609.4
22 696.1
5 367.8
1 990.3
-37.2 52.9 -42.7 -21.8 -7.3 15.8 -33.4-17.3
-4.1
47.0
-35.0
8.7
0.0
5.6
1.9
9.9
-8.0
0.0 10,5-1.8
-18.2
18.7
2.9
0.8
-11.9
-15.3
-33.4 27,8 -5.9 28.8-16.3
11.6 0.8 4.4 5.3 4 . 7 '5.2
4.4
6.0
5.4
6.8
5.1
4.2
9.9
6.5
1.2
3.0
5.0'
2.4
3.1
2.8
1.0
1.5
1.7
0.8
1.21.2
1.3 '
1.3
1.6
1.3
1.5
1.6
1.3
1.5
1.3
2.1 1.814.8
7.7
p14.8
22.7
10.7
18.8
12.5
13.6
21.2
11.0
5.5
8.5
8.7
69.6
67.3
:69.5
: 6 1 . 7 ' 70.1 :64.8
:60.7
:63.6'
67.6'
65.7'
68.3
70.3'
7 4 . 6 ' 74.9