Int. J. Electrochem. Sci., 12 (2017) 7089 – 7102, doi: 10.20964/2017.08.16
International Journal of
ELECTROCHEMICAL
SCIENCE
www.electrochemsci.org
Sensitive Electrochemical Detection of Dopamine, Uric and
Ascorbic Acids Based on poly-(Dianix Yellow) Film Modified
Electrode
Mohammad Ali Karimi1,*, Abdolhamid Hatefi-Mehrjardi1,2, Mahdiyeh Soleymanzadeh2, Azam Barani2
1
Department of Chemistry, Payame Noor University, 19395-4697, Tehran, Iran 2
Department of Chemistry & Nanoscience and Nanotechnology Research Laboratory (NNRL), Payame Noor University, Sirjan, Iran
*
E-mail: [email protected], [email protected]
Received: 9 December 2016 / Accepted: 24 May 2017 / Published: 12 July 2017
A novel modified glassy carbon electrode is prepared as an electrochemical sensor for determination of dopamine (DA), uric acid (UA) and ascorbic acid (AA). The results show that the modified glassy carbon electrode with Dianix Yellow (DY) accelerates the electron transfer reaction of the analytes. The electrochemical behavior of DA, UA and AA on the modified glassy carbon electrode with DY was studied with cyclic voltammetry, linear sweep voltammetry, differential pulse voltammetry (DPV) and chronoamperometry. The DPV data showed DA, UA and AA peak currents are linear in the concentrations ranges of 0.035-2.5 µM, 0.20–2.7 µM and 15-80 µM, respectively. Also, the respected detection limits obtained with this method were 4.64, 16.1 and 50.0 nM. The modified electrode exhibited an excellent sensitivity and stability for determination of DA, UA and AA, and can be used to detect them in the human serum, with the satisfied result.
Keywords:Dianix Yellow; Modified Electrode; Dopamine; Uric Acid; Simultaneously Determination
1. INTRODUCTION
applications are important. Now DA commonly measured by high-performance liquid chromatography [6,7] along with various detectors including a mass spectrometer, Uv-Vis spectrophotometer, electrochemical, fluorescence and optical fiber, chemiluminescence [8,9] and fluorescence [10] detectors, Capillary electrophoresis [11] and ion chromatography [12]. However, previous techniques have some difficulties such as expensive equipment along with complication and time-consuming solvent cleanup steps.
Electroanalytical based techniques are powerful, selective and sensitive methods, appropriate for catecholamines electro-oxidation, and detection of dopamine and its derivatives at the surface of the chemically modified electrodes. Each DA molecule has two phenolic hydroxyl groups that oxidize easily, so it can be measured by electrochemical methods [13].
Uric acid (UA) is another significant compound in the body and its unusual concentration leads to different diseases such as hyperuricemia, leukemia, pneumonia and gout [14-17].
Ascorbic acid (AA) is a water-soluble vitamin [18] that is a need for produce collagen in the body [19], also helps to the absorption of iron from plant sources. Severe deficiency of vitamin C leads to scurvy disease [20,21]. Bloodshed gums, cancer, AIDS, schizophrenia [22] and damage bones and other tissues are symptoms of this disease. AA is one of the chemical derivatives of sugar. It is a powerful reducer and converted to dehydroascorbic acid with to lose of two hydrogen atoms [23,24]. Dehydroascorbic acid has properties of vitamin C.
DA Determination in the presence of UA and AA is an importance problem in the field of biochemistry, neurochemistry, diagnostic and clinical research. Nevertheless, it's determination is very hard in the presence of AA and UA at the unmodified electrodes, because they undergo an overlapping oxidation potential and the fouling effects have been taking place due to adsorption of oxidation products on the electrode surface [25]. Thus, it is necessary to develop simple and fast methods for their measurement in normal analysis without fouling effects. In this case, different modified electrodes have been fabricated. Recently the materials such as self-assembled monolayer [26], polymeric films [27-32], nanoparticles [33], etc. were used and successfully detection of DA, UA, and AA could be performed with the modified electrodes. Modified electrodes with polymer films have wide applications in the fields of electrochemical sensors and biosensors [34-37], also non-conducting polymer films devoted to developing sensors and biosensors that have a very thin thickness (10–100 nm) [38], due to their self-limited growing. The non-conducting polymer films also have favorable perm-selective properties, which could be used to reduce possible electrochemical interferences in samples. Composite materials that consist of non-conducting polymers, e.g. phenol and its derivatives could be used to optimize the sensors and biosensors.
selective method for simultaneous detection of DA, UA and AA were developed for routine analysis. The poly-DY-GCE could have a significant desirability in biological and chemical studies.
2. EXPERIMENTAL
2.1. Materials and Reagents
Dianix Yellow C-5G (DY) with the chemical name of 1-Ethyl-1,2-dihydro-6-hydroxy-4-methyl -2-oxo-3-pyridine carboxamide and molecular formula C9H12N2O3 (MW=196.2 g/mol) was purchased from Dy Star (Germany). Dopamine (DA) and uric acid (UA) were obtained from Merck (Germany) and ascorbic acid (AA) was bought from Fluka (Switzerland). Other chemicals used in this work were of analytical reagent grade (Merck). Phosphate buffer saline (PBS) solutions were provided by mixing the available solutions of 0.1 M KCl and 0.01 M H3PO4 and then regulating the pH with 0.1 M NaOH. A Metrohm 691 pH/Ion Meter was used for pH adjustments. Aqueous solutions were provided with double distilled water. The stock solutions of DA, UA, and AA (0.01 M) were prepared daily by dissolving a suitable amount of the reagent in water. All experiments were carried out at room temperature.
2.2. Electrode Modification
The glassy carbon working electrode (geometric area of 0.0314 cm2, Azar electrode Co., Iran) was polished using aqueous slurries of alumina (0.05 µm) on polishing Silicon Carbide paper, then rinsed with doubly distilled water and sonicated in water/ethanol/water each for 3 min, respectively. The DY was electropolymerized onto the clean GCE surface by sweeping the potential at the scan rate of 0.100 Vs-1 from 0.2 to 1.8 V in PBS (pH=3) containing 5 mM DY. The potential was continuously swept till a minimum value of current, which remained stable after further sweeping, was obtained. This displayed that the electrode surface was entirely covered by the polymeric film. After electropolymerization, the modified electrode was rinsed thoroughly with double distilled water and applied for electrochemical measurements.
2.3. Instrumentation
from Tescan (MIRA, TESCAN, USA). AFM images were taken in the air in contact/tapping mode and were scanned at least in three different sections in given samples.
3. RESULTS AND DISCUSSION
3.1. Poly-DY sensor surface characterization
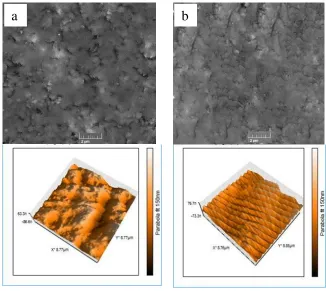
[image:4.596.134.460.260.551.2]Surface morphology and topography of the bare GC and modified poly-DY/GC electrodes was compared by using of SEM and AFM techniques (Fig. 1). The SEM images revealing differences of the unmodified (a) and modified (b) glassy carbon electrodes.
Figure 1. SEM (top) and AFM (down) images of (a) bare GC and (b) poly-DY/GC electrode surface.
This is evident that the surface characteristics of the GC electrode have been changed upon the modification with DY. Indeed, some porosity can be seen at the bare GC. Probably the high porosity of GC surface justifies a greater DY deposition with enhanced electrochemical features.
Also, the atomic force microscopy (AFM) is one of the most helpful techniques for the study of surface topography. In order to investigate topographical properties of GC electrode surface coated with DY film, AFM images of bare and modified surfaces were analyzed. As can be seen in Fig. 1, by the formation of DY layer on the porous GCE surface, the surface morphology is considerably changed and smoothed. It is obvious that the entire surface area is densely covered homogeneously by polymer films. Also, the surface roughness data calculated from AFM software support this situation.
3.2. Electrochemical behaviors of DA, UA, and AA
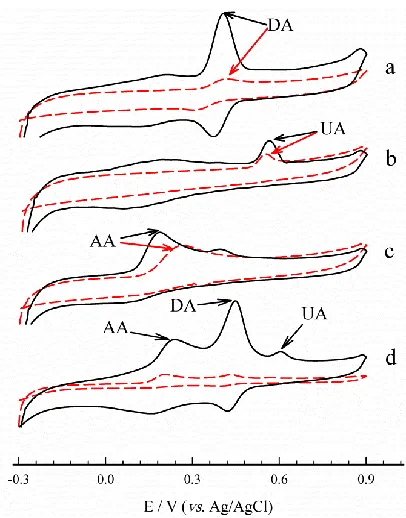
[image:5.596.196.399.208.467.2]The electrochemical behaviors of the DA, UA, and AA at the surface of poly-DY/GC and bare electrodes, was compared by using the cyclic voltammetry method. According to Fig. 2, the anodic oxidation peak potentials of the DA (a), UA (b), and AA (c) at the bare GC electrode were around 0.420, 0.548, and 0.268 V respectively, whereas the related potentials at the poly-DY/GC sensor were about 0.408, 0.561, and 0.188 V.
Figure 2. Cyclic voltammograms of 60 μM DA (a), 50 μM UA (b), 150 μM AA (c) and the mixture of them (d) obtained on the bare GCE (dashed lines) and poly-DY/GCE (Solid lines). The scan rate was 0.100 Vs−1 and solution was 0.1 M PBS, pH 3.0.
species. The highly electrocatalytic activity of poly-DY/GCE can effectively decrease their over-potentials of oxidation and increase the oxidation currents compared to the bare GC electrode.
3.3. Effects of the pH and scan rate on the electrochemistry of DA at modified electrode
Because of well-defined voltammograms, electrochemical reversibility, and peak position, DA was selected in the electrochemical studies of DA, UA, and AA on the surface of the modified poly-DY/GC electrode.
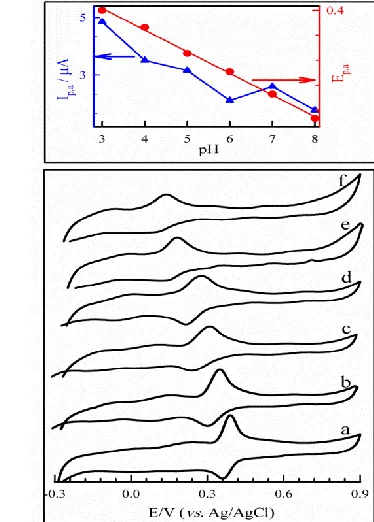
[image:6.596.197.384.213.474.2].
Figure 3. CVs obtained from the modified poly-DY/GCE in the PBS 0.1 M solutions containing of 60 μM DA at different pHs (a) 3.0, (b) 4.0, (c) 5.0, (d) 6.0, (e) 7.0 and (f) 8.0. Scan rate=0.100 Vs−1. Also, the plots of the extracted Ip,a and E0' vs. pH are shown above.
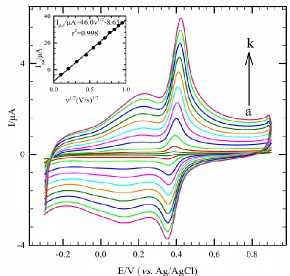
Figure 4. The cyclic voltammograms of the poly-DY modified GCE in 0.1 M PBS (pH 3.0) containing 60 µM DA at the different scan rates from 10 to 900 mVs−1 (curves a-k). The inset shows the plot of the anodic peak currents vs. the square root of scan rate.
Valuable information relating to the electrochemical mechanism frequently can be provided from the study of CV at various potential scan rates. So, the CV investigations at different potential sweep rates for 60.0 µM DA in a buffered solution, pH 3.0 were carried out on the surface of the poly-DY/GCE. Figure 4 reveals the effect of scan rate on the cyclic voltammograms of DA in the range of 0.01–0.9 Vs−1. The results revealed the linear variation of the peak currents with the square root of scan rates (inset Fig. 4) and indicate a diffusion-controlled process in the poly-DY film.
3.4. Electron transfer kinetic studies
Figure 5. Linear sweep voltammograms obtained on the surface of bare (a) and poly-DY/GC (b) electrodes in solutions (0.1 M PBS, pH 3) of 1 mM each of DA, UA, and AA. The scan rate was 5 mVs-1 and the insets depict the resultant Tafel plots.
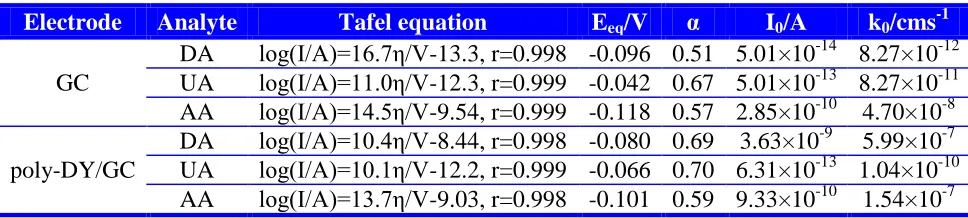
[image:8.596.61.548.79.221.2]Tafel analysis was performed for each voltammogram. The points from the rising part of the voltammograms which is recognized as Tafel region and affected by the electron transfer kinetics was selected from each of three analytes voltammogram for bare and modified poly-DY/GC electrodes and based on them, the Tafel plots were drawn (Fig. 5, insets). The related regression equations and extracted parameters containing equilibrium potential (Eeq), transfer coefficient (α), exchange current (I0) and intrinsic rate constant (k0) are shown in Table 1.
Table 1 Extracted parameters derived from linear sweep voltammograms and Tafel analysis (Fig. 5)
Electrode Analyte Tafel equation Eeq/V α I0/A k0/cms-1
GC
DA log(I/A)=16.7η/V-13.3, r=0.998 -0.096 0.51 5.01×10⁻¹⁴ 8.27×10⁻¹² UA log(I/A)=11.0η/V-12.3, r=0.999 -0.042 0.67 5.01×10⁻¹³ 8.27×10⁻¹¹ AA log(I/A)=14.5η/V-9.54, r=0.999 -0.118 0.57 2.85×10⁻¹⁰ 4.70×10⁻⁸ poly-DY/GC
DA log(I/A)=10.4η/V-8.44, r=0.998 -0.080 0.69 3.63×10⁻⁹ 5.99×10⁻⁷ UA log(I/A)=10.1η/V-12.2, r=0.999 -0.066 0.70 6.31×10⁻¹³ 1.04×10⁻¹⁰ AA log(I/A)=13.7η/V-9.03, r=0.998 -0.101 0.59 9.33×10⁻¹⁰ 1.54×10⁻⁷
These results confirm that the kinetic of reaction has been improved by the modification of GCE. This is the indicative ability of poly-DY/GC sensor for sensitive determination of DA, UA, and AA.
3.5. Chronoamperometric studies
The electrocatalytic oxidation of DA at poly-DY/GCE was also investigated using chronoamperometry. Short time chronoamperometry measurements for various concentrations of DA at a potential step of 0.47 V were obtained by poly-DB GCE (Fig. 6A). For an electroactive species (DA) with a diffusion coefficient of D, the current for the electrochemical reaction (at a mass transport limited rate) is characterized by the Cottrell equation [41]:
[image:8.596.56.540.434.543.2][image:9.596.191.403.137.342.2]
Where D and Cb are the diffusion coefficient (cm2s−1) and the bulk concentration (mol cm−3) respectively.
Figure 6. (A) Chronoamperometric studies of (a) 0.020; (b) 0.040; (c) 0.060; (d) 0.100; (e) 0.140 μM DA at poly-DY/GCE; (B): Plots of the selected currents vs. t-1/2 and fitted lines for each concentration; (C): Plot of the slopes of lines B vs. the concentration of DA and corresponding fit line.
Under diffusion control condition, a plot of I vs. t−1/2 will be linear, and from its slope, the value of D can be obtained.Such studies were carried out in various DA concentrations (Fig. 6B). The slopes of the resulting straight lines were then plotted vs. the DA concentration (Fig. 6C). The mean value of the D was found to be 4.88×10⁻⁶ cm2s−1 for DA which is comparable with 5.8×10⁻⁶ [42], 4.52×10⁻⁶ [43], and 6.1×10⁻⁶ cm2s−1 [44], reported for DA.
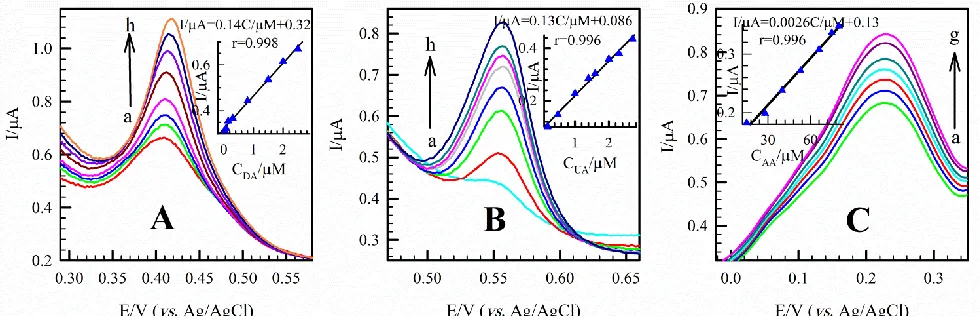
3.6. Differential pulse voltammetry determination of DA, UA, and AA on the modified electrode
[image:10.596.54.544.130.288.2]
measurements of DA at 0.500 µM, UA at 0.850 µM and AA at 16 µM were obtained 1.5, 0.53 and 0.78% respectively.
Figure 7. DPV-grams of poly-DY/GCE in 0.1 M PBS (pH 3.0) containing different concentrations of DA (A), UA (B) and AA (C). DA concentrations (μM): (a) 0.035, (b) 0.080, (c) 0.150, (d) 0.300, (e) 0.800, (f) 1.500, (g) 2.000, and (h) 2.500; UA concentrations: (a) 0.200, (b) 0.500, (c) 1.000, (d) 1.400, (e) 1.600, (f) 2.000, (g) 2.300, and (h) 2.700; AA concentrations: (a) 15, (b) 28, (c) 40, (d) 53, (e) 66, (f) 75 and (g) 80. The insets show the respected calibration plots and equations.
Compared to other materials poly-DY is very cheap and have reasonably lowered detection limit among the studies on the electro-oxidation of DA, UA, and AA by the other modified electrodes (Table 2). Yao et al. [31] reported an electropolymerized eriochrome black T (EBT) modified GCE with an excellent detection limit for sensing the same three analytes. However, in DPV the peak potential separation are lower and detection limits higher than that in this work.
Also, the sensor was examined for simultaneous determination of the three analytes at low concentrations.
Table 2. Comparison of the DPV results with various modified electrode materials from literature.
Electrode Materials Peak separation(mV) Linear range (μmol L
−1
) Detection limit (μmol L−1) DA-AA DA-UA DA UA AA DA UA AA Ref.
a poly-ACBK/GCE 166 193 1-200 1-120 50-1000 0.5 0.5 10 [46]
b
NG/GCE 145 217 0.5-170 0.1-20 5-1300 0.25 0.045 2.2 [47]
c
Ni-sG/GCE 161 219 0.44-3.3 2-15 150-300 0.12 0.46 30 [48]
d
HNP-PtTi 140 200 4-500 100–1000 200-1000 3.2 5.3 24.2 [49]
e
Ni/C/GCE 117 250 1-55 5–180 20–2400 0.05 0.1 5 [50]
f Pdop@GR/MWCNTs 150 - 7-297 20–320 - 1 15 - [51]
g
.RGO–ZnO/GCE 112 238 1-70 3-330 50–2350 0.33 1.08 3.71 [52]
h
CNHs/PGLY 74 225 1–280 2-350 30–450 0.03 0.18 0.34 [53]
Poly-DY/GCE 140 190 0.035-2.5 0.20-2.7 15-80 0.004 0.016 0.050 This work
a
[image:10.596.52.544.559.700.2]
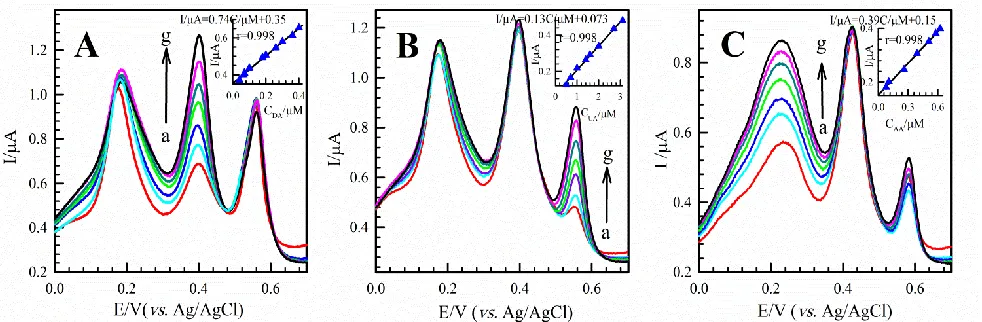
3.7. Simultaneous determination of DA, UA, and AA on poly-DY/GCE
Also, DPV was devoted to the addition of various concentrations of each analyte in the presence of a constant concentration of the others to the PBS 0.1 M, pH 3.0 (Fig. 8). The DPV results show that simultaneously determination of DA, UA and AA with well-defined separated three anodic peaks is possible at the Poly-DY/GCE. The modified layer on GCE resolved mixed response to three separated peaks at the potentials of 0.40, 0.56 and 0.2 V corresponding to the DA, UA and AA anodic peak oxidation, respectively. Peak separations of 0.20 and 0.16 V between DA-AA and DA-UA permit to detect DA, UA, and AA simultaneously by DPV.
DPV-grams of several concentrations of DA in the presence of 30 µM UA and 180 µM AA were recorded (Fig. 8A), and the respected peak currents were extracted. The linear range of the concentration for the determination of DA were 0.040–0.400 μM and slope of the calibration line was 0.74 µA µM-1 (Fig. 8A, Inset). The voltammograms of UA and AA are approximately steady Furthermore, the linear range of the respected peak currents extracted from the DPV-grams of different concentrations of UA in the presence of 0.5 µM DA and 180 µM AA (Fig. 8B) and AA in the presence of 1.5 µM DA and 30 µM UA (Fig. 8C) were 0.500-3.10 and 0.080–0.625 µM with the slopes of 0.13 and 0.58 µA µM-1 respectively (Fig. 8B and 8C, Insets).
Figure 8. DPV profiles at poly-DY/GCE in 0.1 M PBS (pH 3.0), (A) containing different concentrations of DA: (a) 0.040, (b) 0.065, (c) 0.070, (d) 0.100, (e) 0.200, (f) 0.360 and (g) 0.400 (μM) in the presence of 30 µM UA and 180 µM AA. (B) containing different concentrations of UA: (a) 0.500, (b) 0.700, (c) 1.00, (d) 1.40, (e) 2.00, (f) 2.70 and (g) 3.10 (μM) in the presence of 0.5 µM DA and 180 µM AA. (C) containing different concentrations of AA: (a) .080, (b) 0.107, (c) 0.260, (d) 0.390, (e) 0.510, (f) 0.580 and (g) 0.625 (μM) in the presence of 1.5 µM DA and 30 µM UA. The insets show the related calibration plots of extracted anodic peak currents and equations.
[image:11.596.51.542.382.543.2]
Table 3. Recovery tests of [a]: DA, UA and AA separately; and [b]: DA in the presence of UA and AA in two human blood serum samples obtained using poly-DY/GCE.
Analyte Serum
Sample Added (µM) Found (µM) Recovery (%)
DA 1[a]
1[b] 2[a] 2[b] 0 1.50 0 1.60 0 0.80 0 3 0.05 1.59 0.07 1.66 0.01 0.79 0.16 3.10 - 102.6 99.4 - 97.5 98.1
UA 1[a]
2[a] 0 30 0 28 0.63 30.4 0.49 29.2 - 99.2 - 102.4
AA 1[a]
2[a] 0 15 0 20 0.28 14.7 0.47 20.5 - 96.2 - 100.1
3.8. Interference and reproducibility
To test the selectivity of the poly-DY modified GCE, several common coexisting compounds was investigated by determining the responses of the modified electrode toward DA (6 µM) and UA (15 µM) in a mixture. No significant interference was observed for the following compounds: Na+, K+, Cl-, F-, SO24, CO32, NO3-,PO34, Ca2+, Pb2+, Ni2+, glucose, and AA.
The reproducibility of poly-DY/GCE was evaluated by using the DPV responses of 5 modified electrodes in the mixture of DA (0.50 μM) and UA (0.50 μM). The related peak currents remained almost unchanged with RSDs about 1.56% and 1.17% for DA and UA. The results indicated that the selectivity and the reproducibility of poly-DY modified GCE were acceptable.
3.9. Real sample analysis
4. CONCLUSIONS
In this study, a new modified electrode with DY film was prepared by electropolymerization method. It was shown this modified electrode improved the electrocatalytic activities towards the electro-oxidation of DA, UA, and AA. The oxidation of these three biomolecules at poly-DY modified electrode showed three well-defined redox peaks with large peak separation and enhanced peak currents that made the modified electrode suitable for highly sensitive and selective determination of DA, UA, and AA. The sensor production is easy and fast along with low cost and does not need to use complex pretreatment or toxic organic synthetic materials. Moreover, this polymerization does not require a large volume of organic solvents which is preferable from the perspective of green synthesis.
ACKNOWLEDGEMENTS
The Iran National Science Foundation (INSF) is gratefully acknowledged for financial support of this work.
References
1. M. He and X. Zheng, J. Mol. Liq. 173 (2012) 29.
2. T. E. Smith, in: T. M. Devlin (Ed.), Textbook of Biochemistry with Clinical Correlations, Wiley-Liss, New York, 1997.
3. G. E. De Benedetto, D. Fico, A. Pennetta, C. Malitesta, G. Nicolardi, D. D. Lofrumento, F. De Nuccio and V. La Pesa, J. Pharm. Biomed. Anal. 98 (2014) 266.
4. S. Qi, B. Zhao, H. Tang and X. Jiang, Electrochim. Acta 161 (2015) 395. 5. W. Cai, T. Lai, H. Du and J. Ye, Sens. Actuators, B 193 (2014) 492.
6. V. Carrera, E. Sabater, E. Vilanova and M. A. Sogorb, J. Chromatogr. B 84 (2007) 788.
7. C. Muzzi, E. Bertocci, L. Terzuoli, B. Porcelli, I. Ciari, R. Pagani and R. Guerranti, Biomed. Pharmacother. 62 (2008) 253.
8. E. Molaakbari, A. Mostafavi and H. Beitollahi, Sens. Actuators, B 208 (2015) 195.
9. S. M. Wabaidur, Z. A. Alothman, S. M. Alam and S. H. Lee, Spectrochim. Acta, A 96 (2012) 221. 10. J. Zhao, L. Zhao, C. Lan and S. Zhao, Sens. Actuators, B 223 (2016) 246.
11. A. Bacaloni, S. Insogna, A. Sancini, M. Ciarrocca and F. Sinibaldi, Biomed. Chromatogr. 27 (2013) 987.
12. M. Lin, RSC Adv. 5 (2015) 9848.
13. H-X. Zhao, H. Mun, Y-H. Bai, H.Yu and Y-M. Hu, J. Pharm. Anal. 1 (2011) 208.
14. G. Z. Hu, D. P. Zhang, W. L. Wu and Z. S. Yang, Colloids Surf. B, Biointerfaces 62 (2008) 199. 15. J. Raoof, R. Ojani, M. Baghayeri and F. Ahmadi, Anal. Methods 4 (2012) 1825.
16. G. G. Guilbault, Analytical Uses of Immobilized Enzymes, Marcel Dekker, New York, 1984. 17. M. Mallesha, R. Manjunatha, C. Nethravathi, G. S. Suresh, M. Rajamathi, J. S. Melo and T. V.
Venkatesha, Bioelectrochemistry 81 (2011) 104.
18. K. Yashio,Y. Katayama, T. Takashima, N. Ishiguro, H. Doi, M. Suzuki, Y. Wada, I. Tamai and Y. Watanabe, Bioorg. Med. Chem. Lett. 22 (2012) 115.
19. A. M. Pisoschi, A. Pop, A. I. Serban and C. Fafaneata, Electrochim. Acta 121 (2014) 443. 20. V. K. Gupta, A. K. Jain and S. K. Shoora, Electrochim. Acta 93 (2013) 248.
21. S. Rethore, P. Leblond, E. Thebaud, M. Sonna, C. Legrand, N. Rocourt and A. S. Defachelles, Arch. Pédiatrie 18 (2011) 37.
24. R. E. Sabzi and M. H. Pournaghi-Azar, Anal. Sci. 21 (2005) 689. 25. S. Kianipour and A. Asghari, IEEE Sens. J. 13 (2013) 7.
26. H. R. Zare, N. Nasirizadeh and M. M. Ardakani, J. Electroanal. Chem. 577 (2005) 25.
27. M. Mazloum-Ardakani, A. Dehghani-Firouzabadi, M. A. Sheikh-Mohseni, A. Benvidi, F. Mirjalili and R. Zare, Measurement 62 (2015) 88.
28. A. Balamurugan and S. M. Chen, Anal. Chim. Acta 596 (2007) 92. 29. Y. X. Li and X. Q. Lin, Sens. Actuators, B 115 (2006) 134.
30. L. Q. Lin, J. H. Chen, H. Yao, Y. Z. Chen, Y. J. Zheng and X. H. Lin, Bioelectrochemistry 73 (2008) 11.
31. A. Kutluay, and M. Aslanoglu, Sens. Actuators, B 171 (2012) 1216.
32. H. Yao, Y. Y. Sun, X. H. Lin, Y. H. Tang and L.Y. Huang, Electrochim. Acta 52 (2007) 6165. 33. X. H. Lin, Q. Zhuang, J. H. Chen, S. B. Zhang and Y. J. Zheng, Sens. Actuators, B 125 (2007)
240.
34. X. Wang, M. Wu, W. Tang, Y. Zhu, L. Wang, Q. Wang, P. He and Y. Fang, J. Electroanal. Chem. 695 (2013) 10.
35. K. Reddaiah, M. M. Reddy, P. Raghu, and T. M. Reddy, Colloids Surf. B, Biointerfaces 106 (2013) 145.
36. W. Y. Su and S. H. Cheng, Electrochem. Commun. 10 (2008) 899. 37. W. Zheng, J. Li, and Y. F. Zheng, Biosens. Bioelectron. 23 (2008) 1562.
38. A. L. Liu, S. B. Zhang, W. Chen, X. H. Lin and X. H. Xia, Biosens. Bioelectron. 23 (2008) 1488. 39. D. Hu, C. Peng and G. Z. Chen, ACS Nano 4 (2010) 4274.
40. A. Hatefi-Mehrjardi, N. Ghaemi, M.A. Karimi, M. Ghasemi, and S. Islami-Ramchahi, Electroanalysis 26 (2014) 2491.
41. N.G. Tsierkezos, S.H. Othman, U. Ritter, L. Hafermann, A. Knauer, J.M. Köhler, C. Downing and E.K. McCarthy, Sens. Actuators, B 231 (2016) 218.
42. A. J. Bard and L.R. Faulkner, Electrochemical Methods, Fundamentals and Applications, Wiley, New York, 2001.
43. H. R. Zare, N. Rajabzadeh, N. Nasirizadeh, and M. Mazloum Ardakani, J. Electroanal. Chem. 589 (2006) 60.
44. S. M. Chen, J. Y. Chen and V. S. Vasantha, Electrochim. Acta 52 (2006) 455. 45. V. S. Vasantha and S. M. Chen, J. Electroanal. Chem. 592 (2006) 77.
46. R. Zhang, G. D. Jin, D. Chen and X. Y. Hu, Sens. Actuators, B 138 (2009) 174.
47. Z. H. Sheng, X. Q. Zheng, J. Y. Xu, W. J. Bao, F. B. Wang and X. H. Xia, Biosens. Bioelectron. 34 (2012) 125.
48. T. E. M. Nancy and V. A. Kumary, Electrochim. Acta 133 (2014) 233. 49. D. Zhao, G. Yu, K. Tian and C. Xu, Biosens. Bioelectron. 82 (2016) 119.
50. W. He, Y. Ding, W. Zhang, L. Ji, X. Zhang and F. Yang, J. Electroanal. Chem. 775 (2016) 205. 51. C. Wang, J. Li, K. Shi, Q. Wang, X. Zhao, Z. Xiong, X. Zou and Y. Wang, J. Electroanal. Chem.
770 (2016) 56.
52. X. Zhang, Y-C. Zhang and L-X. Ma, Sens. Actuators, B 227 (2016) 488.
53. G. Zhang, P. He, W. Feng, S. Ding, J. Chen, L. Li, H. He, S. Zhang and F. Dong, J. Electroanal. Chem. 760 (2016) 24.

![Table 3. Recovery tests of [a]: DA, UA and AA separately; and [b]: DA in the presence of UA and AA in two human blood serum samples obtained using poly-DY/GCE](https://thumb-us.123doks.com/thumbv2/123dok_us/1817241.137245/12.596.104.491.110.368/table-recovery-tests-separately-presence-human-samples-obtained.webp)
