Rochester Institute of Technology
RIT Scholar Works
Theses
Thesis/Dissertation Collections
1-1-1969
The Modulation Transfer Function of the Human
Visual System at Selected Spectral Frequencies
George L. Ayers
Follow this and additional works at:
http://scholarworks.rit.edu/theses
This Thesis is brought to you for free and open access by the Thesis/Dissertation Collections at RIT Scholar Works. It has been accepted for inclusion
in Theses by an authorized administrator of RIT Scholar Works. For more information, please contact
Recommended Citation
I
The
Moduiation
Transfer
Function
of
the
Human
Visual
System
atSelected
Spectral
Frequencies
by
George
L.
Ayers
Photographic
Science
4
Rochester
Institute
ofTechnology
ABSTRACT
2
INTRODUCTION
3
COMPARISON
OF
THRESHOLD
CONTRAST
TO
MODULATION
TRANSFER
FUNCTION
10
OBJECTIVES
12
FLOW
CHART
DIAGRAM
13
EXPERIMENTAL
PROCEDURE
14
APPARATUS
SCHEMATIC
15
APPARATUS
PHOTOGRAPHS
16
RESULTS
AND
GRAPHS
19
CONCLUSION
28
APPENDIX
2 9
ACKNOWLEDGEMENTS
3ft
REFERENCES
36
ABSTRACT
The
Modulation
Transfer
Function
ofthe
human
visual system
has
been
determined
with a sinusoidal
test
target,
by
measuring
the
threshold
contrast as a
function
of spatialfrequency,
for
monochromaticlight
of constant averageluminace.
Data
were obtainedfor
abroad
band
range and wavelengths of
538
and617
nm.It
is
shownthat
a maximumMTF
occurs atfrequencies
between
2 0
-3 0
cycles/mm onthe
retina and
that
this
sensitivity
decreases
for
both
lower
andhigher
frequencies.
Small
but
discrete
differences
appearin
the
curvesfor
broad-band
radiation andthe
green and redfiltration
atthe
photopicluminances.
INTRODUCTION
The
usefulness ofdescribing
the
human
visual systemby
the
principle of modulationtransfer
function
was realizedby
Westheimer
in
1959.
He
termed
this
measure ofthe
eyesability
to
distinguish
fine
detail
modulatedin
a sinusoidalfashion
the
"Contrast
Sensitivity"of
the
eye.Fringes
were createddirectly
on
the
retina ofthe
eyeby
an apparatusbased
onYoung's
double
slit
interference
method.This
gave a systemfree
from
defocussing
ofthe
optics or aberrations.The
light
sourcehowever,
was not coherent and problems arosein
the
interpretation
of
data
in
the
photopic regions.This
investigation
yieldeddata
based
on quantitativedescription
withdirect
measurements of avariable
frequency
sinusoidal pattern atthreshold
luminances.
4
A
similar paper(Campbell
andGreen,
1965)
updatedmethodology
and used a split
beam
of a neon-heliumlaser
(632.8
nm)
to
producean
image
directly
onthe
retina withoutinvolving
the
opticalsystem of
the
eye.This
also gave a measurement ofthe
RETINA-BRAIN
resolving
power ofinterference
patterns modulatedsinusoidally
.Recognition
ofthis
pattern as an actualgrating
wasfound
to
be
difficult.
Campbell
andGreen
describe
it
asthat
of"a
scintilating
areabrighter
than
the
surrounding
field
and alsodesaturated
in
colour comparedto
the
rest ofthe
field.
It
is
presumably
due
to
beating
between
the
periodicfringes
andthe
regular pattern of
the
retinal mosaic".
This
effect occurred athigh
spacialfrequencies.
In
the
course of a sub-experimentthese
investigators
wereconcerned with
the
resolving
power ofthe
visual system andthe
effect wavelength would
induce
onthe
shape ofthe
contrastsensitivity
curve.Filters
chosenin
conjunction withthe
spectral emission of
the
oscilliscope phosphor(used
to
createthe
sine-wave
patterns)
gave ablue
and orangetest
field
(480
and600
nm)
.Inspection
ofthe
resulting
curves showed nodifferences
in
the
shape ofthe
two
curves.5
Campbell
andGubisch
(1966)
using
adouble
passtechnique
studied
the
effect of pupil aperture andfundal
qualities onthe
line
spreadfunction.
Calculations
transforming
the
line
or pointspread
functions
into
modulationtransfer
data
requiretwo
majorassumptions
concerning
the
optical system.These
assumptionshowever,
areonly
partially
satisfiedby
the
eye.The
first
is
ISOPLANASIA.
Isoplanasia
is
fulfilled
atthe
fundal
areasbut
atoff-axis portions
loses
this
because
of retinal curvature andto
some extent on small
foveal
impressions
or pits.This
precipatesmarked errors
in
line
spreaddistributions
sinceonly
the
averagevalues can
be
calculated.These
errors canbe
large
whenM.T.F.
is
calculatedfrom
image
distributions
of smalltargets.
Secondly
in
the
transformation
from
spreadfunction
to
M.T.F.
symmetry
in
the
light
distribution
mustbe
maintained.However,
for
astigmatized ordecentred
optical systemsit
wouldbe
unrealistic
to
makethis
supposition."On
the
otherhand,
the
light
distribution
of straightlines
21
or gridsmay
be
derived
with a good all-over accuracy".Further
reading
suggeststhat
the
majority
of experiments14
16
17
used either abroad
band
analysis(white
light)
' 'or a
4
5
23
26
region
corresponding
to
maximum eye sensitivity. ' ' 'of
how
the
visual system respondsto
different
spectral- .
4,
24,
25
frequencies.
'24
Schlaer,
Smith
andChase
(1942)
determined
the
visualacuity
attwo
restricted spectral regions(670
and490
nm)
in
order
to
gain maximal separation ofthe
rod and conefunctions
.The
first
test
target
used was abroken
circle(C)
withthe
break
equalto
the
width ofthe
line
forming
the
circle andone-fifth
its
outsidediamrter
andthe
secondfield
was agrating
having
opaque andtransparent
bars
of equal widths.It
wasfound
that
the
redlight
data
which representsrelatively
pure conevision
fell
on a single continuous curve.Blue
light
data
onthe
other
hand
fell
into
two
distinct
groups.Values
below
a certainluminance
value(0.03)
photons)
represented rod vision andthose
immediately
above combinedthe
rod and cone visionto
produce aneffect of
superadditivity
ofthe
mixture.This
area produced ahigher
responsein
terms
of visual acuity.These
investigators
emphasizedthree
majorlimiting
factors
of visual acuity.
The
primary
factor
is
pupil size.Since
the
variance of pupil
diameter
causes marked variancein
visualacuity
especially
in
the
longer
wavelength radiation careful considerationmust
be
givento
this
factor.
Schlaer,
Smith
andChase
maintainthat
a pupildiameter
of3mm
is
sufficientto
tansmit
the
zeroorder spectrum of
the
test
grating
plus atleast
onefirst
orderspectrum and also give maximal
acuity
data.
Secondly,
inhomo-geneity
ofthe
light
source creates chromaticfringes
in
the
image.
Finally
it
is
theorized
that
under certainconditions,
the
diameter
ofthe
foveal
conesmay
constitute alimiting
factor
ii
the
geometric retinalimage
is
in
fact
smallerthan
the
actual25
In
1965
Van
Nes
andBouman
studiedthe
effect of wavelength
andluminance
ofthe
visual modulationtransfer.
Data
was obtained
for
three
values of monochomaticlight
(450,
525,
650
nm)
of constant averageluminance.
Threshold
modulationwas
defined
to
be
the
average ofthe
"grating
just
visible"and
"no
grating
visible"luminances.
The
results obtainedwere
for
the
right eye of one subject who was3
diopters
myoptic.The
target
itself
was viewedby
achemically
accomodated eyethrough
an artificial pupil and external optical. systemcomprised of
five
elements.Van
Nes
andBouman
found
"there
is
little
differences
atphotopic
luminances
in
the
modulationtransfer
function
curvesfor
the
red,
green andblue
wavelengths.However,
it
is
left
to
the
readerto
interpret
any
differences
in
the
data
curvefunctions.
It
would seem reasonable
in
mostinstances
to
makedecisions
about and predictdiffer
ences
in
curvesbased
onthe
fact
that
they
aredrawn
separately
yet quite
closely
together.
The
authorshave
employed nostatistical analysis
in
organizing
the
data
to
clarify
orrepudiate conclusions
they
have
extractedfrom
data
obtainedexperimentally.
Quantitative
methods were employedto
obtainthe
data
which wassubsequently
subjectively
analyzedfor
the
presentation.
Again
in
this
region of experimentationthere
has
been
noestimation of "between" and "within" subject variation.
Certainly
there
mustbe
some observer errorinvolved
and acalculated statistical analysis would present
this
information
clearly
to
the
experimenter.data
in
a statistical mannerin
orderto
clarify
and substantiatethe
conclusionsdrawn.
It
is
felt
that
an analysis of variancetechnique
coupled with observer replication would yield avaluable estimate
to
both
curvefunctions
and within subjectvariability.
This
technique
would also allowinvestigation
ofbetween
observer variability.Many
ofthe
previousinvestigators
involved
atropinizationof
the
eye withthe
addition of an artificial pupil and externali 4.
3,
4,
5,
k8,
24,
25,
27
_. . . . ,optical systems.
It
mustbe
recognizedhowever,
that
the
human
visual system whichhas
been
chemically
accommodated and with external apertures
does
notnecessarily
conform
in
any
known
manner withthe
eye under actualviewing
conditions.
Depalma
andLowry
recognizedthis
fact
'and
theorized
that
since pupildiameter
versusluminance
functions
have
been
extensively
investigated
'a stringent control
of mean
luminance
valuein
the
system would afford a similarcontrol of pupil
(aperture)
diameter.
This
controldoes
nottake
into
account several majorpupillary
reactions which mustbe
15
considered
if
no chemicalinfluence
is
involved.
The
pupil reactsto
near visioncausing
a contraction ofthe
pupil whichis
with
associated in some
mannerA
the
convergence ofthe
eyes ana accommodation
ofthe
lens.
Spontaneous
thoughts
or emotions elicitedby
stimulii either
by
the
apparatusin
the
experimentitself
orconsenu-ally
causepupillary
dilatation.
Spontaneous
or reactive changesin
the
level
of consciousness orneurologically
speaking
changesin
the
degree
of cortico-thalamo-hypothalamicactivity
affectthe
pupillary
reflexdilation.
It
increases
with emotional stimuliiand
decreases
withfatigue
by
increasing
ordecreasing
the
the
iris
.Pupillary
movements can alsobe
causedby
anintentional
shortclosing
ofthe
eyelids.This
Lid-Closure
reflex consists of ashort contraction and
then
redilataticn.Finally,
there
existsapparently
spontaneous oscillation ofthe
pupil under
steady
conditions ofillumination
whichhave
nodirect
liaison
withany
other reactions.When
the
eyes are exposedto
long-lasting
light
stimulationthe
pupilscontract,
then
redilate
partially
andbegin
tc
oscillate.In
dim
illumination
as
for
threshold
readingsthe
pupilsbecome
quitelarge
and quietas
they
wouldbe
in
darkness.
As
the
intensity
ofthe
stimulationis
increased
the
meandiameter
ofthe
pupilbecomes
smaller andthe
rate of oscillationincreases
accordingly.It
would appearthen
that
there
aretwo
alternativesfor
eliminating
the
interference
ofpupillary
oscillation.The
first
would
involve
a pre-experimentalinvestigation
to
test
the
hypothesis
that
there
is
noinsignificant
variation of pupildiameter
for
the
observer underthe
experimental conditions.This
wouldinvolve
sophisticated and expensive apparatus andcannot
be
employedin
this
particularinvestigation.
The
second methodinvolves
the
dilation
ofthe
pupilchemically.
This
canbe
achieved withonly
a minimal affect onaccommodation
by
using
a mydriaticdrug.
Each
observer wouldhave
to
be
individually
tested
asto
the
exact effectthe
drug
would propagate.
This
method,
althoughusing
an artificial pupilfor
exact control of pupil response would eliminate externalpieces of optical apparatus.
It
may
be
arguedthat
we nowhave
created an unnaturalconditions.
However,
control over pupil size mustbe
carefully
maintained either
by
an appropriate apparatusincluded
in
the
instrumentation
to
maintain arunning
control orby
removing
the
psychological and pfeiological
incongrueties
from
the
system.In
this
respect a more accuratestudy
ofthe
viewing
conditions can
be
estimated.There
willbe
no needto
speculatewhat
the
effects willbe
if
external optics are addedto
the
system
tc
maintainfocus
for
the
chemically
dilated
pupil.The
fact
that
any
opticsbetween
the
object space andimage
spacemust
degrade
the
sinusoidallight
distribution
is
a majorfactor
which cannot
be
disregarded
ashas
been
done
in
many
investigations
It
is
felt
that
the
latter
course of action would yieldthe
most consistent results
but
it
involves
constant medical attentionduring
the
process.For
this
reason pastdata
gatheredby
other
/-no 0*3
experiments ! ' must
be
relied onto
supply
adequateCOMPARISON
OF
THRESHOLD
CONTRAST
TO
MODULATION
TRANSFER
FUNCTION
The
modulationtransfer
function
of atransilluminated
system
is
defined
asthe
contrast ratio atthe
modulation ofthe
outputto
that
ofthe
modulation ofthe
input
of asinu-soidally
distributed
target.
This
approachis
widely
appliedin
the
photographicindustry
to
the
response of areceiving
layer
(the
emulsion)
orthe
light
dispersion
characteristicsof an optical system.
Provided
there
is
linearity
in
the
system
any
number of componqjb parts canbe
deduced
from
sufficientknowledge
ofthe
aggregate.Another
fundamental
advantage ofusing
a sine-wavetarget
is
that
the
modulation remains sinusoidaleven when
imaged
by
apoorly
focussed
orimperfect
optical system.In
this
type
of physical arrangement a measurementis
madeof
the
output magnitudefor
a constantinput
magnitude ofvariable
frequency.
In
this
contextit
is
difficult
to
correlatethe
purely
physical systemto
a psychophysical visual system.Although
the
input
values are physical measurements ofthe
light
modulation of sine-wave
test
target,
the
output values canby
no means
be
described
withthis
extremeaccuracy
sinceit
is
aquantity
whichdoes
not permit observationin
the
physical sense.During
this
investigation
the
response variablefor
the
output will
be
the
reciprical ofthreshold
contrast or modulationtransfer
function.
In
orderto
assumethe
linearity
neededfor
mathematical manipulation of
the
function
certain conditionsneed
be
clarified.One
major suppositionis
that
the
internal
noise
level
ofthe
visual systemis
a constant value.It
willhigh
spacialfrequency
targets
is
limited
by
aninternal
noisesource
that
the
noiselevel
is
independent
ofthe
different
frequencies
andthe
output contrast ofthreshold
measurementis
constant.Therefore,
the
contrastloss
in
passing
through
the
apparatus and visual systemis
the
reciprical ofthe
THRESHOLD
CONTRAST
atthe
input
end.Consequently
the
recipricalof contrast
threshold
is
defined
by
the
same parameters asmodulation
transfer
function
and canbe
substitutedfor
it
asthe
function
plotted against spacialfrequency.
The
conceptthat
(THRESHOLD
CONTRAST)
is
a goodfirst
order approximation of modulation
trnasfer
has
been
further
substantiated
in
a communication withMr.
J.J.
DePalma
(Kodak
OBJECTIVES
PART
I
To
test
the
hypothesis
that
the
modulationtransfer
function
(reciprical
of contrastthreshold)
as generatedby
asinusoidal
target
ofdiminishing
spacialfrequency
onthe
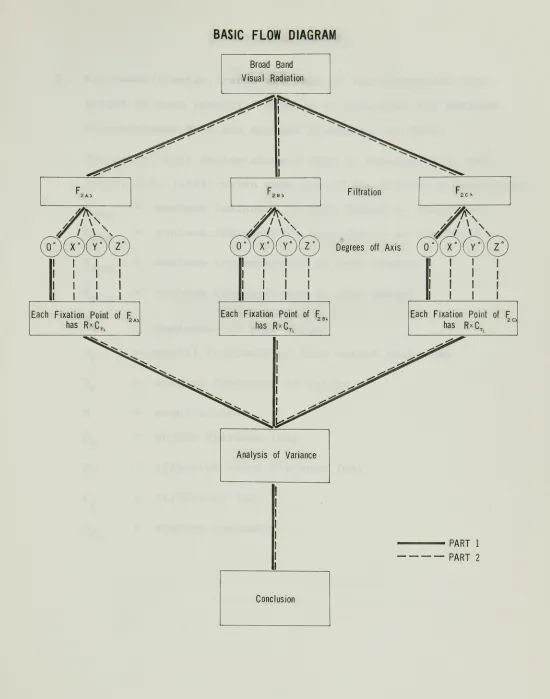
BASIC
FLOW DIAGRAM
E3S)
1
1
1
1
1
1
1
1
1
1
1
1
1
1
1
1
Each
Fixation
Point
ofF
has
R*CTl
Broad
Band
Visual
Radiation
Each
Fixation
Point
ofF2BX
has RxC
Analysis
ofVariance
Conclusion
1
1
1
I
1
1
1
1
1
1
1
1
1
Each Fixation
Point
ofF
has
RxfjTi
PART 1
PART 2
[image:15.572.9.559.17.716.2]EXPERIMENTAL
METHOD
1.
Microdensitometer
traces
are made ofthe
sinusoidaltest
target
at each spacialfrequency
to
determine
the
maximumtransmittance
Tmax
and minimumtransmittance
Tmin.
The
method willfollow
closely
that
ofDepalma,
J.J.
andLowry,
E.M.
(1962)
which made use ofthe
following
quantities,B
maxB
.mm
max
T
.mm
B
oV
oV
rM
P
O
B
VL
= maximum
luminance
in
test
object atthreshold
= minimum
luminance
in
test
object atthreshold
= maximum
transmittance
in
test
target
-minimum
transmittance
in
test
target
=
luminance
oftest
target
= spacial
frequency
oftest
target
cycles/mm= spacial
frequency
of retina=
magnification
= object
distance
(mm)
= effective
image
distance
(mm)
=
filtration
(nm)
=
SCHEMATIC
OF
MTF
INSTRUMENTATION
(-
40
in.h
14
in.E
M,
Beam
Splitting
Mirror
M2
Front Surface
Mirror
H
Integrating
Box
L
Tungsten
Light
Source (300
watts)
0,
02
Opal
Glass
Diffusing
Screens
F,
Test
Filters
F2
Neutral
Density
Filters
T
Sinusoidal
Test Targets
with
viewing
aperture
included
Figure
2
(15)
The
test
targets
areinserted
in
the
front
filter
assembly
ofthe
integrating
cone(fig
2)
designed
so asto
be
evenly
illuminated
in
the
200
candle power range.The
binocular
observationdistance
is
fixed
at2
inches
from
the
viewing
post or14
inches
from
the
sinusoidtarget.
Instead
h
of
2
fixed
position reostat controlledlight
sources,
a single300
watt,
moveabletungsten
filament
illuminates
the
target.System
components consist of3
front
surface mirrors mountedat
45
degree
angles(M~),
opal glass screens(0,,
0)
and aset of
filters
(F,
,F
)
.The
opal glassforms
auniformly
illuminated
background,
eliminating
the
filament
image
onthe
transilluminated
target
(T)
andthe
veiling
luminance
surround.Filters
F,
consist of aWratten
No
58.,
Green
andWratten
No.
25
red as well as abroad
band
analysis while .F2 consistsof a series of graduated neutral
density
filters
used as needed.The
target
frequencies vary from
a coarse3/8
c/mto
6.0
c/mm.The
target
size willbe
1
m.in
length
by
1/2
cm. width andthe
vieling
luminance
will provide a surround of2.54
cm square.The
surround willbe
ofthe
same spectral content asthe
target.
The
observer viewsthe
target
andfixation
pointthrough
the
vieling
luminance,
an opal glassdiffusing
screen,
filters,
anda
beam
splitting
mirror(M,
)
.The
purpose ofthe
vieling
luminance
is
to
provide a control ofthe
surround content at afixed
level
for
eachtest
target
andto
provide a meansby
whichthe
contrast canbe
varied.The
only
opticsin
the
way
ofthe
object space as seenby
the
observeris
the
partially
transmitting
mirror(M,
)
.This
obstacle can
be
mathematically
removedfrom
the
system onceits
MTf
value
is
determined.
In
making
athreshold
observation,
the
carriage ofthe
moveable
filament
is
placed so asto
givethe
test
target
the
maximum contrast and visibility.
The
roomslights
areturned
offand
the
subjectis
requiredto
wait60
secondsbefore
the
test
target
is
illuminated.
When
the
apparatusis
switched onthe
subject views a
test
target
withboth
eyes withthe
surroundand
vieling
luminance
at a minimumbrightness.
The
carriageis
then
slowly
movedforward
to
increase
the
vieling
luminance
andreducing
the
target
to
threshold
detectibility
.The
filters
arethe
removed.When
athreshold
setting
has
been
accomplished,
photometerreadings are made of
the
vieling
luminance
BV?
andthe
coneluminance
B
.o
The
modulationtransfer
is
described
as.__,
B
T
+B
T
.+2
BVL
|
MFF
= omax o mm J
VL
.B
T
-B
T
.(
'o max o mm
In
investigating
the
effect ofthe
MTF,
it
is
mostusefully
expressed as a
function
of spatialfrequency
onthe
retina,
V
.The
spatialfrequency
onthe
retinais
computedfrom
the
spatialfrequency
in
the
test
objectby
the
following
relationship:V
=V
:1/M
=V
.
Po/1-,-r
/tv,r o o
U/PI
(B)
In
calculating
V
for
eachtest
object andfor
eachviewing
situation,
the
usually
accepted value of17
mm. was used asthe
effective
image
distance
PI.
This
is
the
distance
from
the
secondnodal point of
the
eyelens
to
the
retina.RESULTS
All
results arefor
binocular
vision offour
observers,
eachhaving
individual
eye characteristics.Figures
3-6
givethe
response of each observer
to
the
test
conditionsfor
broad-band
radiation as well as green
(538
nm)
and red(617
nm)
filtration,
The
horizontal
axishas
been
mathematically
remodelledto
read
in
retinal spatialfrequmcy
ratherthan
that
ofthe
target
frequency.
The
three
parameters all produce a maximumin
sensitivity
orminimal
threshold
at about20
-3 0
cycles/mm(
Vm
)
.For
photopic
luminances,
thresholds
for
spatialfrequencies
smaller or greater3
than
V
arehigher.
m 3
Figures
7-9
showthe
response of each observerfor
eachfiltration
level.
All
curvestake
the
same general shapebut
aredisplaced
according
to
the
specific observercharacteristics .
OO
9Ql_
8Q__
60 F
lip
= a -- = = m
i(INN
Wk=
AUGUSTTmza-._. _
RRRvmE
^
,<
&
~r~
<
so '(*Nn
..
V.
iJ' _ <^" A ?o ,<> . p (n 1it r)
!,n
*\
1Q_ 9-=8-1
7_l 6_F =|
E
_E
=
1
_mE
^5
1
=11
111
i^ ~Er^j-I- '-s[-=ttH
v8
~.\
^a~^ < > 1 <\
3"A;
i n on /ip> cn z.r\ 7C 8!) or\
ju uu i>i^ 1
.'.\J 1JO
\
:
*<
>f'/kl \A .
1 R b
Lu t
!<- 1 -H
ETirJ/^
j.
IV 1 aL. RIOr
IrFl
r i-/a
/.'V.1A>
EcaJu
niJliih! Ul Anr>i/ f nin CPtic
-J-4n II i average
1
g
Ul eJ10
p|
=3= ;_ ==T= =
i
j
i---i
j |
-.--=-.. . mm i = 8 =E-L 7
1
6 ===~ ~1
)^
=MORETON
-11 AUGUS
1
III!
4 "s
*
IE
>
lE
. Vy / s
a rt ,
s
A,'
IV1 V.
'/
\
,SL
m >
v
r
A
t
\
\
< i-iT-^ 1 "^ 1
V
]
"\
L 'e
R? fc>v^
s s sV
5
s,
p
\(j
\
< iJJ=L
m
-|
11
a=
i
~
R
1 1
=
i
m\
llllllllllll
8-== =E6_EEE;
liill
^_*** *.
i
5_=L_: z-Sal^
3
IB or n Ii
Sr
zt? JCj 4 o Jo o Ij 7u 0 V 1'J\l 1 1 u Izu ijo
SI
>AT 1/ J
-1ti
(,i h l\
(Y
R b
1n M A
p
n ji
G 1/
7
M
1 b*
..4
TI nr
h
qUl e4
u -~ -_
Ei
McEl 1 cr.R
0
12 AUGUS
8 E 7 = 6 E =Z
-Y
m^ 5 4i
-!< ============s
SJiS'
/
a N/
\
/ s
/
v\/
(i -. Uj 1
:>
\ </
N? -/- ,
>.
1
*/
t1/
Cr
f
rf
/
e-/
1
J
f
r\ " \il -HfJ vO
10 9_!ama^HI
|
1
1
i!
aa
-|
mi
=-I =-I
a||
II
>1
I"|
I
EN,_ - '
^di
8_:
E
=E
E~
^s*-
...=====
^
;==]==i=^^a5-J:
u-^i =r+
^
s^
3
l n Of- ifi ii D /-I t,n T
K
ao _ !__. _Jo 9u PLc
1 0
120
1 JO( 1
>r
fi 1 i/
,i1 !l
K
h
1r !/
cN\Yo P
IC^ <\G H T
4 C
f t-th
1
;
/s
UQ.
F g
ure5
9ft_
_
===!==1=1111===
^OUTHV
1115
VELL-
9
AUGUST
o
30
G^f
-3
\ \
t
,t
JT6rj /
SL
_/ ^^----=h
"j '
c
R
<st
V
\\
4l
'\10
_ -:
iiiiiiiiiiiiiil
^~^ii====~=^==* ^=
jpii
liiiiiiiiiiiiiiiiiii
=Ey ==m|3^=
m=F=p
= = = ===~ ======3J===
=3E3^
7_~[E:pm =
IfEE
~ -m17=======111=====
H
EEE==iEa=--=.-.m=_-.-.IlllllUll
111111II11
6_== = = = =
= == === ==== =
^^E
i~ . .. ..L J
-jsam>^ fRE
1 1
5 i
At
\aV-v
V **>
^c^_. \ p^
B V
3
?
>.IO zJ JO 40 DO i.r\ 7 ~\ m ori) i?itFU nu lzv_ 1Jv_J
<naTIACa FfiHonrEtscr - rettst
<V
:
MYiaaS:
R
GHT
-5-50 + 0.50AXIS 90
LEFT -4.00
+
-OOAXIS80
FU
jure6
oo
. , i
i
ti
i
i
"TT^l
i : --9Q ."
^
1
M
" '"
f"
i.-: ~
!
(=
E
-h
^=^^|E
s_
E;
---================= 70 1 ===jE4^==^=E^m-=E=m-=m-~-j1-+4= _ ^_ ---ea
1^=^
j^^^n
nm
'
3ROAD-BANDANALYSIS
r*
-f--^l '
2
MORETON2
* *^m5
____=___
m^Jmm. ___.
40 -j^-jS^
"Si^5>
'~^~
3=j-f
SOUTH
WEM^1
../^
^_
~S"
:
t n/n
^eei>^^e:--HeN^
fW4
?
V.S%
z*v
3
/
4
$sV
ZjZ'J.
V
\\
*I
"
^
O.
*a
kEO
S
s
X
N-3 V>- r-
V
?o r ' >. _,
r^s^L
... \ ,k n.
h*-i ~
EE^EEEEEEEEEEEEEEEEEEEEEEE^EEEEEEE
5
K_ ______
_*
E . _,
^5E *
~v
r '_ L,^S V
'
V
^S
%
t
> <v *.i
-V ^
X
3_.l _ .
zs:
-EV
" '
a
1^
X
-
vE-^
\
io -
\
\
%
_iiplII||jI[|||jiIIIIIIlB
=====l|=!p==~|~|~|
^^^JE^=p=rimE^p-_m-^lpiiii|i|liii|iiiliBii
5
TrrmP^frrffl^T^JW
^ffliffl^^H
-*s
4^-=!=
-~E=1
l-sth-1 | n _
~
_ >*.
V
.. c
""' A;
\
^
V
3 . \
J BO vO VOO 1IO 120 1JO ->,
I-lOO
__^_____^
oft
| |
..[_i1
!
1
j
1_
j
80
)
'i i , ' , i
--o
____e_-~Fr
i^6Q_
GREEN FILTER
-No.58
^== =||=============^E
*
i^^^^=--
-'-^^^^^L=U^===^^^^Am * V.
4 *
/ * _
3Q ,
/
/
__,__m _ .. ___^^_
_____ . p 1 i r1 f^"^
^L _^^
_U_
***
r
\
^i ^*
/
*^*^v ' '
Ej
\ v v ""*a\
l
* >V ?J-
_-^s_
"/
^
*_s *-I
\
^
^f
O
^L
^V-^
. t. ?
f+ 1
J- __*
___\_-1 * _.
oi _ ^_
\
\ *>.* L ' \
*
^^fc
V
\ *^_
\
* k\
*.^V
\ *
^V.
fc '
%
*S
L_
*
^V
*
^
' >wio
V
y
"B^sJ
liiiiii=iiiiiiii=iliiiiiiiiiiiiiiiiiiiiiiiiii
Jll_E-lHl_riis9l
6_- ~ ____ ~ ~ ~ __=J^
~~\-y--Z. =fc_t= ~
j|^_3__;
*%*%
~^\1-m
rrrrrrH
nTTrH4fHtt~H==f
-h
LH_HJmKqa
3 ""
1G
w ju4o
M-OO 70 8
3
9D
ICC
EHO^
120
ICO1
,\pfr'Ti
_
___e3J
*_
gMllpF'
i
r-^'-
"-r
psjgijipiiMiiijliijI
. ' < , =
I>Q_ -EEfEp
^==^=
7D
=====
60 i -i
-. ~t: >
1 ' i - KtU rILl cK No. Id
\ -pp_ 1
E=
:_|______T
~
KLEIN
:-rj'zrp
MO RE TON
tH
TTi
I**l"
nTFHEH
as\ _i *____
._^_ _4._b -30_ *~
"fr
* ^^^ __. *, y Xs**- *
*
_r __i^__
*
f
w *
^*^_,
?
~~
'_
^^^k.
' _L' >f ~*' '
^
^?o
\^^
V?,
ejI
V
-< s, '
"/' "
"^1
^1~^
^._ ^^ ^
/
L _ ^171
\
k ^^K l_
. \ ^.
V "\.
I 1
*"
_1^L
I _
'
_
\k
J '__ *
^
t
V.
1_ ** x
*i
^ i >vi;
\l
N^
-_==__=
:__p_p
z= =r~ ~~
~-z
~~ ~ ~
z$ zz ~ zz~^~ ~~ zS
IIIIIllijllllIIlllIIIIIlEiiiiEiiiim^MEIEIIiilEiililllllliiii
<-E
EEE-E
5EEEEEEE
rE-E--Ei(EitsE-E--~--p-E
EEE-E-E
E
Ml
ErffmEH
I
rETrNwrHa#ml^
I
I
I
I
EE
EE
t :a"i
a
1J *} okj hw J^ o\J tj ov- t\j i uu IIU \ 2.\j IJO
S'AiIAl
EEE_____
-Rt
isiaEguieS
i __
II 1 1 1
1 1 1 1 1 1 1 1 1 1 1 1
1
1 1
1
1
TF
-CONCLUSIONS
It
has
been
shownthat,
using
the
Contrast
Threshold
criterion,
the
Modulation
Transferis
afunction
ofspatial
frequency
and spectral content andhas
a maximum
sensitivity
at about20-30
cycles/mm.From
this
maximum
MTF
,the
sensitivity
to
the
sinusoidaltest
target
decreases
for
spatialfrequencies
ofboth
higher
and
lower
content.This
relationship
was maintainedby
all wavelengths
tested.
This
maximum response surroundedby
adecreasing
response suggeststhe
interaction
oftwo
distinct
mechanisms.This
couldbe
explainedby
assuming
a
low-pass
component associated withthe
optics ofthe
eye
lens,
ocularmedia,
pupildiameter,
andthe
retinalmosiac
diffusion.
By
experimentationFlamant
has
deter
mined
that
the
high-pass
component ofthe
visual system appearsto
be
intimately
relatedto
the
inhibitory
processes
taking
placefrom
the
retinal mosaicto
the
brain.
This
is
composed of acomplexity
ofinterrelated
mechanisms;
neural,
chemical,
electrical,
and psychological,There
is
a smallbut
distinct
degradation
ofthe
observerMTF
asthe
spectralband
is
shiftedfrom
the
bare
filament
to
greento
red.This
canpartially
be
explainedby
realizing
that
the
retinais
athin
sheet ofinterconnected
nerve
cells,
including
a mosaic of photoreceptive rodand cone cells.
The
conesfunction
in
daylight
or photopicconditions and
have
a peaksensitivity
to
radiation of about560
nm while at617
they
have
a muchlower
response.The
retinal surface aroundthe
fovea
is
composed almostentirely
of cones and sothe
response ofthe
eyein
this
area
is
completely
dependent
onthe
cones.This,
combinedwith
the
possibleinteraction
ofpupillary
diffraction
APPENDIX
OBSERVERS
1.
Miss
Jo
Ann
Klein
Age
2 0
Myopic
Right
-1.75
+2.50
Axis
10
Left
-1.75
2.
Mr.
Wayne
Moreton
Age
22
3.
Miss
Louise
McElroy
Age
19
Myopic
Right
-4.00
Left
-2.75
4.
Miss
Janet
Southwell
Age
19
Myopic
Right--5.50
+0.50
Axis
90
Left
4.00
+1.00
Axis
8.0
TARGET
FREQUENCIES
3/8
3A
1
1/8
1
1/2
2
1/4
3
3
3A
4
1/2
6
Vo
RETINAL
FREQUENCIES
7.9
15.9
24.8
31.8
47-7
63.6
79.5
95.^
127.2
Vr
PUPIL
SIZE
1.5
Y10.8
=5.15
Trolands
r
According
to
Lowenstein,
0.,
andLowenfeild,
I.E.
,5.15
Trolands
would give a pupildiameter
of3.4
mm,
This
would of coursebe
only
the
average pupildiam
FILTRATION
FILTER
DOMINANT
WAVELENGTH
LUMINOUS
TRANS
MITTANCE
WRATTEN
58
538.
2nm
19.8
%
WRATTEN
25
617.7
nm22.5
%
WRATTEN
4 9B
457.7
nm0.11
%
The
blue
filter
was not used sinceit
causeddefocussing
problems with
the
optics ofthe
eye.SAMPLE
CALCULATION
SHEETS
-SEE
figures
10,
11.
Only
two
runsfor
each observer couldbe
madein
the
time
limits
placed upon completion.
Each
run consisted of120
pieces ofinformation
andlasted
for
two
to
two
and onehalf
hours.
For
this
reason
the
analysis of variancetechnique
was not employed.The
instrumentation
and observer error varied withthe
wavelengths oflight
used and withthe
sinusoidaltarget.
An
averaging
technique
was employed
in
orderto
plotthe
final
curves.Figure
12
shows an averageMTF
for
broad
band,
green and redfiltration
for
allthe
observers.If
enough measurementshad
been
carried out
this
wouldbe
the
standardMTF
response curvesfor
the
average visual system.
An
interesting
side experiment undertaken substantiatesthe
fact
that
a given colorlooks
brighter
if
its
surroundings areits
complimentary
colour.The
Wratten
No
58
andNo
25
filters
wereagain matched
in
luminous
transmittance
andthen
the
redfilter
wasplaced
in
the
target
assembly
andthe
No
58
was placedin
the
beam
of
the
vieling
luminance.
This
gave atarget
of green and redbars
surrounded
by
a greenfield.
When
the
redbars
disappeared
threshold
to
be
directly
related withthe
generalimportance
ofborder
effectsin
perception.Additional
experimentationin
this
particular areamay
lead
to
an enhancement ofhigh
altitude aerialinstrumentation
visibility.
Time
did
not permitthe
use ofthe
MTF
data
reductionfor
the
beam
splitting
mirror.Additional
work shouldbe
done
to
eliminateSAMPLE
VISUAL
MTF
RECORD
SHEET
OBSERVER
AGE
DATE
19
P-TEST
NUMBER
ND
FILTER
VIEWER
LIMITATIONS
AND
REMARKS
r
BROAD
BAND
N058-GREEN
No25-
RED
TRANS
vr
Bo
Bvl
i
MTF;
Bo
Bvl]
MTF
Bo
Bvl
MTF
Tmax
Tmin
3/8
. .. ...-__.
'
,
!
1
1
i
.... . ..
3A
L
i
11/2
... .. j
1
"
1
i
1
21/4
1
i
3
'
i
i 1
1
]
- ---33A
!
i""
41/2
'1 . .
i
6
!
\
i
i
.
J___L2J
.
. .. ..
*
OBSERVATION
CONDITIONS
FIGURE
IO
SAMPLE
CONFIDENCE
LIMITS
OBSEVER
FILTRATION
t
n
7.9
Xl
Xr>
(X
2
!
O
j
<u}
<
Ill
i
15.9
ill
!
24.8
1
j
j
1
1
!
1
!
!31.8
1
1
!
1
47.7
63.6
;!i
79.5
i
1
95.4
127.2
1
1
i
ADDITIONAL
COMMENTS
FIGURE II
George L.
Ayers
n
1
= = = =^
=-H
iii
I
':
m: - -- - -___ _:^ -|: = r =[__- _n j
j
j-5 -\-< _ ---r~.z mEE ~~
/VVl!R A G E MTF
CURVES
_4
w
/
tufB
at
a a*
.
\
T
r1 -:==r
_=
P_____
^
\
*^
. V <
_t _ V
J_ ! A >
* * <
s t ft V 1 ^ m
\
2 ' *
\
ix
I A,
:
1 >>-E|B
* 5 ~ ^r v
\
?\
""*' 1C
\
fi%\
>
"
V
k>
l _L
E
liiiiillliil
E=7
=
II
=2--i
|
s
;
|~\
'"i-iiiiiliiiii==l^==1111111111!
gm|_E
-~
-;
=E
E
1
=;111111I1III1111I1IIII|II11II
4 :
3
>
JA 11/
ll rkK
ui
N Z'l
'1:
INA
2
J , . E .
inn 7CL_ __ _ =
a.
m _ ~ = E=== ==|^===j=^^|1=
=^=E=e|^^
/
40/
-ii >r_i0
-Is
no ?o crs.e
ss_______g__i-lo_A
-RED
17!iRO'T0 N Gl?F
FN~
SI
IFtRO
IIN
nE
E I
R
-:
sR
-= -= -= -= -= = = =:.B
-GREEN
1
AFtG El C N R ElD
51IRROUND
-^6_EEEEEEEE 5 . ========== E
E
4 3 _11
22
2D
41.
J1>J 6 J
/
.>b
uV
JKHX
113
120
L-O
SIJ
U
/i1F k
:(Jl
II h K
i <-i
M
/Ihi
^1
R
1;
r1
1 1 II II
i1
I
z
o
REFERENCES
1.
ALPERN,
M.
,LOWENSTEIN,
0.,
andLOWENFELD,
I.E.,
"Accomodation
the
Pupil"in
Vol.
3
ofThe
Eye
ed.by
Hugh
Davson
(4
vols.,
London
Academic
Press.
1962)
pps.191-229.
2.
ALTMAN,
J.H.
(1966)
Photography
offine
slits nearthe
diffraction
limit.
J.
Photo
Sci.
&
Engrs.
(10)
No.
3
pps.140-143.
3.
BARLOW,
H.B.,
(1965)
Visual
resolution andthe
diffraction
limit.
J.
Physiol
(181)
pps.576-593.
4.
CAMPBELL,
F.W.
andGREEN,
D.G.,
(1965)
Optical
and retinalfactors
affecting
visual resolution.J.
Physiol
(181)
pps.558-578.
5.
CAMPBELL,
F.W.,
andGUBISCH,
R.W.
,(1966)
Optical
quality
ofthe
human
eye.J.
Physiol
(186)
pps.558-578.
6.
COBB.
P.W.,
(1915)
The
influence
ofpupillary
diameter
onvisual activity.
Am.
J.
Physiol
(36)
p.335.
8.
DAVSON,
H.
,Visual
Optics
andthe
Optical
Space
Sense
in
The
Eye
Vol.
4
(London,
Academic
Press,
1962).
7.
DAVSON,
H.
,The
Visual
Process
in
The
Eye
Vol.
2
(London
Academic
Press,
1962)
9.
DE
GROTT,
S.G.,
andGEBHARD
,J.W.,
(1952)
Pupil
Size
asdetermined
by Adapting
Luminances.
J.
Opt
Soc
Amer.
Vol.
42,
pps.4 92-4 95.
10.
HARTLIDGE,
H.
,(1918)
Chromatic
aberration andthe
resolving
power of
the
eye.J.
Physiol
(52)
p.175.
11.
HECT
andMINTZ,
(1939)
Visibity
of singlelines
of variousluminances
andthe
retinalbasis
of visual resolution.J.
Gen.
Physiol
(22)
pps.593-612.
12.
GRAHAM,
G.H.
andHARTLINE,
H.R.,
(1935)
The
response of singlevisual sense cells
to
light
radiation ofdifferent
wavelengths.
13.
IVANOFF,
A.,
(1947)
Les
abernationsde
chromatisme etde
sphericite
de
l'oeil.
Revve
opt.Theor
Instrum
(26)
pps.889-919.
14.
KRAUSICOFF,
J.,
(1962)
Light
distribution
in
human
retinalimages
.J.
Opt.
Soc.
Amer
(52)
pps.1046-1050.
15.
LOWENSTEIN,
0.,
andLOEWENFELD,
I.R.,
"The
Pupil"
in
Vol.
3
of
The
Eye
ed.by
Hugh
Davson,
(4
vols.,
London
Academic
Press
1962)
pps.231-267.
16.
LOWRY,
E.M.
andDEPALMA,
J.J.,
(1961)
Sine-wave
responseof
the
visual systemI.
The
mach. phenomenon.J.
Opt.
Soc.
Amer.
(51).
17.
LOWERY,
E.M.
, andDEPALMA,
J.J.,
(1962)
Sine-wave
responseof
the
visual systemII
Sine-wave
and square-wave contrastsensitivity.
J.
Opt.
Soc.
Amer.
(52)
pps.328-335.
18.
OOUE,
S.,
(1959)
Response
Function
ofthe
eye.J.
Appl
.Phys.,
Japan
28
(oyo
Buturi)
pps.531-534.
19.
PIRENNE,
M.H.,
(1946)
On
the
variation of visualacvity
withlight
intensity.
Proc
.Camb.
Phil.
Soc.
(42)
pps.7 8-82.
20.
PIRENNE,
M.H.
,Vision
andthe
Eye
(London,
Chapman
andHall
LTd.
,(1967)
.21.
ROHLER,
R.
andHILZ
,R.
,(1965)
Physical
and physiologicalfactors
in
the
visual modulationtransfer.
Proceedings
of
the
Colloquim
atDelft
1965.
pps.105-117.
22.
SCHLADE,
O.H.,
(1956)
Optical
and photoelectricanalog
ofthe
eye.J.
Opt.
Soc.
Amer
(46)
pps.721-739.
23.
SHLAER,
S.,
(1937)
Relation
between
visualacvity
andillumination
.J.
Gen
Physiol
(21)
pps.165-188.
24.
SHLAER,
S.,
SMITH,
ELL.
andCAASE,
A.M.
(1942)
Visual
Acvity
andIllumination
in
different
spectral regions.J.
ofGen.
Physiol
(25)
pps.553-567.
25.
VAN
NES,
F.L.
andBOUMAN,
M.A.
(1965)
The
effects of wavelength
andluminance
onthe
viual modulationtransfer.
Proceedings
ofthe
Colloquim
atDelft
1965
pps.183-192.
26.
WESTHEIMER,
G.,
(1960)
Modulation
thresholds
for
sinusoidallight
distributions
onthe
retina.27.
WESTHEIMER,
G.,
andCAMPBELL,
F.W.
(1962)
Light
distribution
in
the
image
formed
by
the
living
human
eye.J.
Opt.
Soc.
Amer.
(52)
pps.1040-1045.
ADDITIONAL
RELATED
LITERATURE
A.
DOUGHTY,
G.F.,
PORTEOUS
,R.L.,
WALL,
F.J.B.,
Visual
factors
in
projected picturequality,
J.
Phot
Sci.
Vol
12
1964
pps.211-221.
B.
HUBBARD,
R;
KROPF
,A?
Molecular
isomers
in
visionSci.
Amer.
Vol
216,
No
6
June
1967
pps.64-76.
C.
HUBEL,
D.H;
Visual
cortex ofthe
brain
Sci.
Amer.
1963,
pps.2-10.
D.
ITTELSON,
W.H;
KILPATRICK,
F.P.;
Experiments
in
perception.Sci.
Amer.
Aug
1951,
pps.2-7.
E.
LAND,
E.H.;
Experiments
in
color vision.Sci.
Amer.
May
1959,
pps.2-4.
F.
MacNICHOL,
E.F.;
Three
pigment color vision.Sci.
Amer.
Dec
1964,
pps.2-19.
G.
PRITCNARD,
R.M.;
Stabilized
images
onthe
retina.SCI.
Amer.
June
1961.
H.
WALL,
F.J.B.;
STEEL,
B.G.;
Implication
ofthe
methods chosenfor
the
measurement ofthe
statistical properties ofphotographic