Distribution voltage control utilising the reactive power capabilities of wind
generators
Daniel Danzerl
1, Simon Gill
2, Olimpo Anaya-Lara
2 1Wind Energy CDT, Department of Electronic and Electrical Engineering, University of Strathclyde, Glasgow, UK
2Department of Electronic and Electrical Engineering, University of Strathclyde, Glasgow, UK
E-mail: [email protected]
Published inThe Journal of Engineering; Received on 12th October 2017; Accepted on 3rd November 2017
Abstract:Voltage rise issues have become a major limiting factor to greater penetration of wind generators in weak distribution networks. A complete decentralised approach to voltage control (VC) that fully utilises the reactive power capabilities of distribution wind generators is an emerging technology and one that has not yet been investigated extensively. This study explores the potentials of modern wind turbine technology integration to address the problem. It assesses such potentials on a realistic 289-node UK generic 11 kV distribution network using time-series optimal powerflow simulations under constraint conditions. This study examines the power factor control and VC modes of operation of typical generators and proposes practical techniques that enhance greater connection capacities. The study successfully reveals that, operating the wind generators within aflexible reactive power capability limits effectively mitigates the voltage rise problem and maximises generation levels.
1 Introduction
The recent deployment of distributed energy resources particularly, renewable generation technologies are offering an extensive contri-bution to energy diversification and carbon footprint reduction. On the contrary, the transitioning to a low-carbon society presents a host of challenges to distribution network operators (DNOs). These include the effective management of existing network assets to ac-commodate the high penetration of distributed generation (DG) con-nections [1]. Intermittent renewable generation technologies such as wind power, are often connected to remote and weak parts of medium- voltage and low-voltage distribution networks (due to the high availability of wind resources), where they are particularly vul-nerable to causing high variation in network conditions. These preva-lent issues in network conditions present significant challenges to operators and as such, can limit connection capacities for new gen-erators wishing to connect. One of the most important challenges is voltage rise issues caused by active power injections from the DGs [2, 3]. DNOs have passively resolved the voltage rise issue by reinforcing their network asset or limiting DG capacities based on the extreme condition of minimum load/maximum generation scenarios. The amount of generation that can be connected is usually established using deterministic loadflow studies based on worst-case scenarios to control the DGs [4]. Conventional corrective methods have relied on centralised control systems such as on-load tap changing transformers (OLTC) at distribution primary substations and local control devices including capacitors, static-var compensa-tors, and static compensators to regulate and maintain the network voltages within desired limits. Centralised voltage control (VC) schemes require a significant investment in network visibility and monitoring systems including sensors, communication, and control systems. Furthermore, such devices can sometimes be difficult to im-plement particularly in larger network applications where proper co-ordination can be a major issue.
Currently, due to the limited flexibility in VC methods DNOs tend to manage their networks by offering interruptible connections through‘non-firm’contracts and stricter operational control regimes that limit DG power flows through curtailment. This method of
operation addresses the voltage rise problem in the short-term, however, in the long-term can result in reduced energy yields affect-ing the economic viability of greater wind investments. These issues have led to recent Ofgem sponsored innovation projects in the UK, which supports DNOs to explore novel techniques that enhance network hosting capacities to accelerate the deployment of low-carbon technologies in a timely and cost-effective manner [5]. One of such novel techniques is the advent of active network management (ANM). ANM offers a smarter alternative solution to grid connections to otherwise costly and time consuming network upgrades and reinforcements [4–6].
Recent ANM schemes and trial projects in the UK have deployed a range of novel techniques that address thermal constraint on dis-tribution networks [5]. However, voltage constraint is a rather complex challenge and one that has received very little attention in current ANM schemes. Furthermore, a decentralised VC strategy that utilises the reactive power capabilities of multiple wind farm connections is an emerging technology and one that has not yet been fully investigated. This paper explores the potentials of modern wind turbine technology applications as corrective devices to the voltage rise problems in weak distribution networks. It evaluates the effectiveness by assessing DG connection capacities whilst providing ancillary reactive support to the network. It applies the proposed strategy on a realistic 289-node UK generic 11 kV dis-tribution network using time-series AC optimal powerflow (OPF) simulations to quantify the benefits of the DGs. The study investi-gates the power factor control (PFC) and VC modes of operation of multiple DG connections taking into accounts the inherent stochas-tic nature of their power outputs. It proposes pracstochas-tical control solu-tions that mitigate the voltage rise issue effectively. The results successfully reveal that operating the wind generators within afl ex-ible reactive power capability boundary enhances and maximises generation outputs.
2 Problem formulation
Previous work reported by the authors in [7] involved a decentra-lised VC technique that modelled a single DG unit connection to
The 6th International Conference on Renewable Power Generation (RPG)
mitigate the voltage rise problem. The study modelled the constant PFC and reactive power control modes of operation. Similar PFC and VC methods have been studied in [8], where the authors employ a deterministic system that uses intelligent switching between the two modes. The author’s target was to develop novel VC methods that could keep the DGs online during light or heavy demand conditions by combining the advantages of both voltage and PFCs. The method was termed automatic voltage/ PFC (AV/PFC). The steady-state response of the model was the generator’s ability to relax their power factors (PFs) when the bus voltages approached the statutory limits.
In the PFC mode of operation, the objective is to maintain and keep the P/Q relationship constant, with the reactive power output following variation of real power outputs [9]. In VC mode, reactive power is injected or absorbed to compensate for voltage variation at the point of DG connection. This mode of operation can potentially help maintain the voltages within desired limits. In [9] the authors compare both intelligent distributed and centralised VC techniques using OPF tools at a rural network set-up. A simple distributed re-active control approach for voltage rise mitigation in distribution networks have been proposed by Carvalho et al. [10]. The authors implemented a reactive control approach to mitigate the voltage rise caused by active power injections.
While both VC and PFC techniques are well established, their combination has never been co-ordinated actively to address the voltage rise problem in the weak distribution network. In this paper, the proposed VC strategy is formulated as an optimisation problem that makes use of mathematical ACOPF analysis tools using time-series simulations. It utilises the standard ACOPF [11– 12] formulation at each time-step and models multiple DG connec-tion arrangements operating at either constant PF (CPF) or variable PF (VPF) control mode. The proposed scheme combines the advan-tages of both PFC–VC modes to address the voltage rise problem. The optimisation aims to achieve the following system objectives:
† maximise wind generation outputs at minimum cost,
† minimise the impact of DGs on voltage profiles,
† minimise grid supply import of power.
The standard ACOPF formulation takes the following non-linear relationship:
optimisef x( ) (1)
subject to the following equality and inequality constraints:
g x( ) =0 (2)
h x( ) ≤0 (3)
wherefrepresents the objective function andxrepresents the opti-misation vector consisting of vectors of voltage anglesθiand mag-nitudes Viand vectors of generator real power PGi and reactive powerQGiinjections as shown in the following equation:
x= ui Vi PGi QGi
⎡ ⎢ ⎢ ⎣
⎤ ⎥ ⎥
⎦ (4)
The objective to maximise wind power generation output at minimum cost consist a summation of individual quadratic cost
terms of each generator unit ireal power fpiand reactive power
fQiinjections and can be expressed as
min
Ng
i=1
fPi PGi+fQi QGi (5)
In this study, the OPF model assigns high cost values to the swing bus to discourage grid power imports from the transmission network at the GSP and low cost values to all DGs to encourage active and reactive demands on the network be met by the DGs. Variables within the optimisation vector are constrained within a certain minimum and maximum bound and is described as
xmin≤x≤xmax (6)
The equality constraint in (2) refers to the full set of non-linear real and reactive power balance equations and is formulated as
Vi Nb
i=1
YijVjcos uij+dj−di
−PGi+PDi=0 (7)
Vi Nb
i=1
YijVjsin uij+dj−di
−QGi+QDi=0 (8)
The inequality constraints defined in (3) represent the physical real-ities of the power system in equation and consists of bus voltage angles and magnitude limits, generator real and reactive power limits and branch flow thermal limits and is presented in, respectively,
† Voltage limits
umini ≤ui≤umaxi (9)
Vimin≤Vi≤Vimax (10)
† Generation limits
PminGi ≤PGi≤PmaxGi (11)
QminGi ≤QGi≤QmaxGi (12)
† Thermal limits
Sij
≤Sijmax (13)
To formulate the CPF and VPF control modes, certain modifi ca-tions are made to the ACOPF algorithm by introducing additional constraints to the generators in Matpower simulation platform [13]. The standard formulation is modified through additional cost function f, and constraint variablez. This can be written in the following form:
f x( ) +fu(x,z) (14)
subject to the equality and inequality constraints described earlier in (2), (3) and (6), as well as the inequality constraints described as
l≤A x
zmin≤z≤zmax (16)
whereArefers to the user-defined sparse matrix,xis the optimisa-tion vector described in (4),landurepresent the lower and upper bounds of the additional constraint, respectively, in this case the, generator reactive limits. In the case of CPF formulation, the gener-ator units are constrained to a specific PF (PFi) plane, such that the
P–Qcapability curve is restricted and can only operate at either strictly inductive (VAr export) or capacitive (VAr import) mode. This condition is formulated into the ACOPF algorithm and takes the general linear constraint equation described as
QPratio×PGi−QGi=0 (17)
whereQPratiorefers to theP/Qrelationship of the generator units
and is defined as
QPratio=
1 PF2i −1
(18)
given that
PFi=cosfi= PGi
Si (19)
To estimate the generator’s reactive power limits at each time step, we can derive the following relationships:
QmaxGi (inductive) =
PGi
1−PF2
i
PFi (20)
QmaxGi capacitive= −
PGi
1−PF2
i
PFi (21)
In the case of VPF control strategy, the PF limits are relaxed and allowed to vary within a certain upper maximum and lower minimum bound to control the voltage and is described as
PFmini ≤PFi≤PFmaxi (22)
The additional non-linear inequality constraints are modelled into the ACOPF algorithm to define the lagging and leading PF bound-aries of the generators and are formulated as, respectively,
0, QPratio×PGi−QGi,1 (23)
0,−QPratio×PGi+QGi,1 (24)
The generator reactive power limits are relaxed and freed to switch between inductive and capacitive modes within the specifiedP–Q
capability limits shown as
−QminGi(capacitive) ≤QGi(optimum) ≤ +QmaxGi(inductive) (25)
where the optimum reactive power dispatchedQGi(optimum)at any
given time step and voltage conditions may be either positive values between zero to the maximum inductive limits +QmaxGi(inductive)or negative values from zero to the minimum capaci-tive limits−QmaxGi(capacitive) All variables and constraints are formu-lated before calling the ACOPF command.
3 Case-study network
The operation of the proposed control strategy is applied to a real-istic UK Generic Distribution System (UKGDS) to assess its effect-iveness. Fig.1 shows a single-line representation of a 289-node radial distribution network developed in IPSA with full network data given in [14]. The examined network comprises a mix of urban and rural sections consisting of underground cables followed by overhead line constructions with variedX/Rratios and medium conductor lengths. The primary substation supplies three 11 kV feeders and is linked to a 33 kV distribution system represented as a source of real and reactive power. The primary substation is equipped with two identical 33/11 kV OLTC transformers each rated at 22 MVA, connected in parallel to regulate the network voltage to a pre-defined target. The operation condition in this paper sets andfixes the slack bus voltage at 10.89 kV (0.99 p.u.) throughout the optimisation. The secondary bus voltages are con-strained at current DNO operational limits and allowed to vary within a permissible range of ± 3% of the nominal. The medium circuit conductor lengths with varied MVA ratings are considered as an additional thermal constraint on the network. However, thermal limits on the network are deliberately relaxed to enable the voltage limits to operate as binding constraints to control the generators.
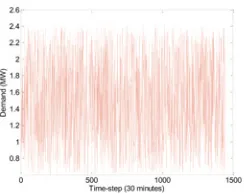
Half hourly time-series load profiles are connected on all second-ary buses and consists a mixture of residential, industrial and com-mercial loads. These are aggregated values scaled from a single load profile (peak loads) provided in [14] with minimum demands set at 25% of the peak load. Fig.2presents a one-month long snapshot of half-hourly demand data. The use of historic wind resource time-series, such as normalised output of a nearby wind farm is used to estimate potential generation. Fig. 3 shows a one-month sample of normalised wind generation profiles. A suit of eight ‘non-firm’distributed wind generator schemes of varied capacities are connected to the network at nodes 1244, 1144, 1105, 1191, 1120, 1310, 1358, 1387 and assumed to operate an ANM scheme. The principle of access rule for sharing curtailment and limited network capacity is via a technical best arrangement. Here, all generators have equal priority and access to the network. In this rule, the OPF engine optimally shares capacity by assigning greater curtailment in order of the generator with the
[image:3.595.307.545.512.753.2]most impact on voltage rise constraint. The model is deployed in Matpower [13] where simulation studies are carried over one-month period at half-hourly resolution consisting a total of 1440 time steps.
4 Results
To assess the adequacy and benefits of the proposed control strat-egy,five scenarios have been investigated and is summarised in Table1. A base-case scenario is initially presented with the DGs modelled to operate at unity PF, representing current passive ap-proach to VC in distribution networks. The rest of the scenarios evaluates the effectiveness of reactive power and PFC capabilities of the wind generators to mitigate the voltage rise problem. Here, all the DGs are assumed to have connection contracts and arrange-ments that allow them to participate in VC support on the network. They are also assumed to have modern technological capabilities
through their power electronic interface with the network that makes them available to the ACOPF to support reactive demands. This is in the form of their ability to operate in either CPF control or VPF control modes to regulate the voltage at their point of connection (POC). Each scenario provides a quantitative assessment of the benefits including energy yields and curtailment levels required to maintain the network limits.
4.1 Scenario 1: base-case (PF = unity)
In scenario 1, which represents the base-case condition, the DGs are modelled to operate at unity PF. The simulation results at the end of the OPF reveals a total generation capacity of 84.9% across the DG schemes with 15.1% curtailment required to maintain the voltage limits. This is summarised in Table2.
4.2 Scenario 2: constant PF (PF = 0.95Lagging)
In the case of CPF control mode, the generator’s PFs are con-strained and can only operate at either strictly lagging or strictly leading control modes. Scenario 2 studies multiple DG connections at 0.95 lagging PF where the DGs are modelled to export VArs (in-ductive mode) to the network. Simulation results at the end of the OPF is summarised in Table3. The results show a total generation capacity of 83.8% with curtailment at 16.2% to maintain voltage limits.
4.3 Scenario 3: constant PF (PF = 0.95Leading)
In this scenario, the DGs are modelled to operate at 0.95 leading PF where they import VArs (capacitive mode) from the network to control their voltage. The OPF reveals a total generation capacity of 86.1% across the DGs with curtailment levels at 13.9% and is summarised in Table4.
4.4 Scenario 4: variable PF (0.98Lead≤PF≤0.95Lag)
In the case of VPF control mode, the ACOPF allows the DGs to ac-tively adjust their PFs by allowing reactive power exchange between the network and the DGs to import (lead) and export (lag) reactive power based on the voltage requirement at their POCs. Scenario 4 studies the behaviour of the DGs when modelled to operate at PFs varying between 0.98 leading and 0.95 lagging. Summary of the results obtained at the end of the OPF is sum-marised in Table5. The study shows a total generation capacity of 85.9% and curtailment of 14.1% required to maintain voltage limits.
4.5 Scenario 5: variable PF (0.95Lead≤PF≤0.95Lag)
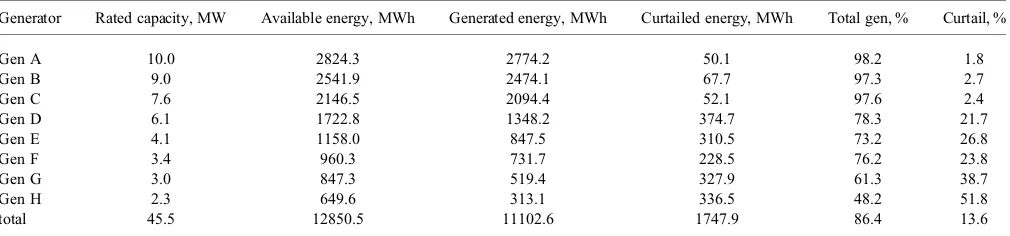
This scenario studies VPF control mode with the DGs PFs modelled to operate between 0.95 leading and 0.95 lagging. Corresponding results at the end of the OPF are summarised in Table 6. The results show a total generation capacity of 86.4% and curtailment recorded at 13.6%.
[image:4.595.108.230.57.154.2]Fig. 3 Normalised wind profile (1 month) Fig. 2 Active demand profile (1 month)
Table 1 Summary of control strategy
Scenario Control strategy PF
1 base-case unity
2 constant PF 0.95 lagging
3 constant PF 0.95 leading
[image:4.595.105.229.190.287.2]4 variable PF 0.98 lead≤PF≤0.95 lag 5 variable PF 0.95 lead≤PF≤0.95 lag
Table 2 Summary of base-case scenario
Generator Rated capacity, MW Available energy, MWh Generated energy, MWh Curtailed energy, MWh Total gen, % Curtail, %
Gen A 10.0 2824.3 2812.9 11.4 99.6 0.4
Gen B 9.0 2541.9 2531.1 10.8 99.6 0.4
Gen C 7.6 2146.5 2136.5 10.0 99.5 0.5
Gen D 6.1 1722.8 1353.0 369.8 78.5 21.5
Gen E 4.1 1158.0 858.8 299.2 74.2 25.8
Gen F 3.4 960.3 621.2 339.0 64.7 35.3
Gen G 3.0 847.3 361.2 486.1 42.6 57.4
Gen H 2.3 649.6 234.0 415.6 36.0 64.0
[image:4.595.47.289.534.613.2] [image:4.595.52.549.651.769.2]The total energy generated across the various control strategies is shown in Fig.4. It can be observed that; adopting a VPF control mode with the DGs modelled to operate between 0.95 lead and 0.95 lag results in greater energy yields and an improved network access for the remotely connected DGs.
5 Discussion
[image:5.595.46.544.73.192.2]The investigated control strategies in this paper are benchmarked with current DNO practice (unity PF) to quantify the benefits and drawbacks. In Fig. 4, it is seen that operating the generators at Table 3 Summary of results (PF = 0.95 lagging)
Generator Rated capacity, MW Available energy, MWh Generated energy, MWh Curtailed energy, MWh Total gen, % Curtail, %
Gen A 10.0 2824.3 2819.7 4.6 99.8 0.2
Gen B 9.0 2541.9 2535.3 6.6 99.7 0.3
Gen C 7.6 2146.5 2139.6 6.9 99.7 0.3
Gen D 6.1 1722.8 1326.2 396.6 77.0 23.0
Gen E 4.1 1158.0 849.4 308.6 73.4 26.6
Gen F 3.4 960.3 586.1 374.2 61.0 39.0
Gen G 3.0 847.3 321.2 526.1 37.9 62.1
Gen H 2.3 649.6 191.7 457.9 29.5 70.5
[image:5.595.46.548.236.355.2]total 45.5 12850.5 10769.1 2081.4 83.8 16.2
Table 4 Summary of results (PF = 0.95 leading)
Generator Rated capacity, MW Available energy, MWh Generated energy, MWh Curtailed energy, MWh Total gen, % Curtail, %
Gen A 10.0 2824.3 2750.3 74.0 97.4 2.6
Gen B 9.0 2541.9 2431.9 110.0 95.7 4.3
Gen C 7.6 2146.5 2047.7 98.8 95.4 4.6
Gen D 6.1 1722.8 1440.4 282.4 83.6 16.4
Gen E 4.1 1158.0 973.4 184.5 84.1 15.9
Gen F 3.4 960.3 704.5 255.8 73.4 26.6
Gen G 3.0 847.3 430.2 417.1 50.8 49.2
Gen H 2.3 649.6 290.6 359.0 44.7 55.3
total 45.5 12850.5 11068.9 1781.6 86.1 13.9
Table 5 Summary of results (0.98Lead≤PF≤0.95Lag)
Generator Rated capacity, MW Available energy, MWh Generated energy, MWh Curtailed energy, MWh Total gen, % Curtail, %
Gen A 10.0 2824.3 2791.8 32.5 98.8 1.2
Gen B 9.0 2541.9 2508.9 33.0 98.7 1.3
Gen C 7.6 2146.5 2126.8 19.6 99.1 0.9
Gen D 6.1 1722.8 1324.5 398.3 76.9 23.1
Gen E 4.1 1158.0 842.7 315.3 72.8 27.2
Gen F 3.4 960.3 706.7 253.5 73.6 26.4
Gen G 3.0 847.3 447.7 399.6 52.8 47.2
Gen H 2.3 649.6 283.7 365.9 43.7 56.3
total 45.5 12850.5 11032.8 1817.8 85.9 14.1
Table 6 Summary of results (0.95Lead≤PF≤0.95Lag)
Generator Rated capacity, MW Available energy, MWh Generated energy, MWh Curtailed energy, MWh Total gen, % Curtail, %
Gen A 10.0 2824.3 2774.2 50.1 98.2 1.8
Gen B 9.0 2541.9 2474.1 67.7 97.3 2.7
Gen C 7.6 2146.5 2094.4 52.1 97.6 2.4
Gen D 6.1 1722.8 1348.2 374.7 78.3 21.7
Gen E 4.1 1158.0 847.5 310.5 73.2 26.8
Gen F 3.4 960.3 731.7 228.5 76.2 23.8
Gen G 3.0 847.3 519.4 327.9 61.3 38.7
Gen H 2.3 649.6 313.1 336.5 48.2 51.8
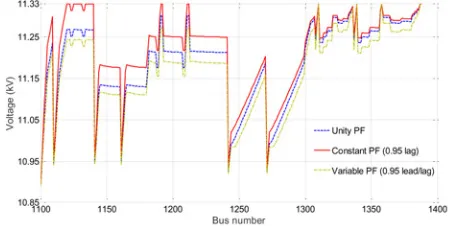
[image:5.595.46.549.403.521.2] [image:5.595.44.549.566.684.2]CPF control 0.95 lagging results in reduced energy yields by a total of 139 MWh. Operating the DGs in strictly inductive mode infl u-ences the network voltage profiles (Fig. 5), thereby forcing the OPF to reduce active generation to levels that maintain the con-straint. On the contrary, this mode of operation has greater benefits of reducing excessive VAr imports from the grid as reactive demands on the network are predominantly met by the DGs. In the case of CPF control 0.95 leading, the total energy levels increased by 160 MWh. However, DGs operating in strictly capaci-tive mode absorbs a great deal of reaccapaci-tive power from the network to control their voltage. This poses negative loads on the network and may require some form of agreement with the DNO to justify this mode of operation. By adopting a VPF control approach, the DGs enhance their scope for greater VC capabilities and allows for a fair reactive power exchange with the network. At 0.98lead and 0.95lag VPF modes, the energy levels have increased by a total of 124 MWh. In the case of operating the DGs between 0.95lead and 0.95lag VPF modes, the results obtained showed the most benefit of greater energy yields with a total increase by 194 MWh when compared with the rest of the control strategies. By allowing greater flexibility of the generator’s P-Q capability limit can result in improved performance of the DGs to effectively mitigate the voltage rise problem and maximise their output. Fig.5
shows a comparison of the maximum voltage profiles recorded drawn from a single time-step measurement during the optimisa-tion. Here, it is seen that operating the DGs at VPF mode between 0.95lead and 0.95lead effectively mitigates the voltage rise problem with minimum points reaching the upper maximum limit implying reduced frequencies in DG curtailments.
6 Conclusion
In this paper, a detailed case-study assessment of distribution VC that fully utilises the reactive power capabilities of modern wind generators have been presented. The results successfully reveal that operating the wind generators within a flexible reactive power capability limit effectively mitigates the voltage rise problem and maximises DG connection capacities, enhancing the economic benefit of wind integration in distribution networks.
7 Acknowledgments
This work have been funded by the UK’s Engineering and Physical Science Research Council, reference number EP/G037728/1.
8 References
[1] Walling R.A., Saint R., Dugan R.C.,ET AL.:‘Summary of distributed resources impact on power delivery systems’,IEEE Trans. Power Deliv., 2008,23, (3), pp. 1636–1644
[2] Masters C.L.: Voltage rise: the big issue when connecting embedded generation to long 11 kV overhead lines,16, pp. 5–12
[3] Liew S.N., Strbac G.:‘Maximising penetration of wind generation in existing distribution networks’,IEE Proc. - Gener. Transm. Distrib., 2002,149, (3), p. 256
[4] Strbac G., Jenkins N., Hird M.,ET AL.:‘Integration of operation of em-bedded generation and distribution networks’, Manchester Cent. Electr., 2002, pp. 1–95
[5] Energy Network Association: ‘Smarter networks portal’, 2014. Available at: http://www.smarternetworks.org/site.aspx. Technical report number – K/EL/00262/REP URN 02/1145, Accessed: 03-June-2017
[6] Energy Networks Association:‘Active network management good practice guide’, 2015
[7] Sansawatt T., O’Donnell J., Ochoa L.F.,ET AL.: Decentralised voltage control for active distribution networks, 44th International Universities Power Engineering Conference (UPEC), Glasgow, United Kingdom, 2009, pp. 1–52009
[8] Kiprakis A.E., Wallace A.R.:‘Maximising energy capture from dis-tributed generators in weak networks’,IEE Proc. - Gener. Transm. Distrib.,151, 2004, pp. 611–618
[9] Vovos P.N., Kiprakis A.E., Wallace A.R.,ET AL.:‘Centralized and dis-tributed voltage control: impact on disdis-tributed generation penetra-tion’,IEEE Trans. Power Syst., 2007,22, (1), pp. 476–483 [10] Carvalho P.M., Correia P.F., Ferreira L.A.F.M.:‘Distributed reactive
power generation control for voltage rise mitigation in distribution networks’,IEEE Trans. Power Syst., 2008,23, (2), pp. 766–772 [11] Carpentier J.:‘Optimal powerflows’,Int. J. Electr. Power Energy
Syst., 1979,1, (1), pp. 3–15
[12] Dommel H., Tinney W.:‘Optimal powerflow solutions’,IEEE Trans. Power Apparat. Syst., 1968,PAS-87, (10), pp. 1866–1876 [13] Zimmerman R.D., Murillo-Sanchez C.E.: ‘Matpower 6.0b1’, vol.
22203, February 2016
[14] UKGDS: ‘UK Generic Distribution System’, 2015. Available at:
https://github.com/sedg/ukgds Fig. 4 Total energy generation
[image:6.595.48.288.58.210.2] [image:6.595.54.279.252.365.2]![Fig. 1 11 kV radial distribution network (HV_UG_OHb) [14]](https://thumb-us.123doks.com/thumbv2/123dok_us/1372953.90617/3.595.307.545.512.753/fig-kv-radial-distribution-network-hv-ug-ohb.webp)