ACKNOWLEDGEMENT
First of all, praise to Allah s.w,t almighty god that allowed me to complete the my final year project successfully . My great appreciation dedicated to my beloved parent Ismail Bin Zakaria and Zah Binti Mohamed because they always support me no matter what happen and also thank you to them because give me opportunity to study at Universiti Teknikal Malysia Melaka.
ABSTRACT
ABSTRAK
TABLE OF CONTENT
CHAPTER TITLE PAGE
ABSTRACT ii
TABLE OF CONTENT iv
1 INTRODUCTION 1
1.0 Introduction 1
1.1 Motivation 3
1.2 Problem Statement 4
1.3 Objective 4
1.4 Scope of Project 5
2 LITERATURE REVIEW 6
2.0 Introduction 6
2.1 Theory and Basic Principles 6
2.1.1 Power Factor Correction 6
2.1.2 Total Harmonic Distortion 8
2.1.3 Type of Household Load 10
2.1.4 TNB Electricity Bills 11
2.1.5 Energy Saver Device 13
2.2 Summary of Review 16
3 METHODOLGY 17
3.0 Introduction 17
3.1 Gantt Chart 17
3.2 Methodology Flowchart 19
3.3 Experimental Test 24
3.3.2 Test 2 (Test on energy saver device 2) 29 3.3.3 Test 3 (Test on energy saver device 1 + device ) 30
4 RESULT AND DISCUSSION 31
4.0 Introduction 31
4.1 Result 32
4.1.1 Experimental Test 1 I Pure Resistive Load II Pure Inductive Load
III Resistive Parallel with Inductive Load IV Resistive Series with Inductive Load
32 32 35 37 44 4.1.2 Experimental Test 2
I Pure Resistive Load II Pure Inductive Load
III Resistive Parallel with Inductive Load IV Resistive Series with Inductive Load
50 50 52 55 61 4.1.3 Experimental Test 3
I Pure Resistive Load II Pure Inductive Load
III Resistive Parallel with Inductive Load IV Resistive Series with Inductive Load
67 67 69 71 77
4.2 Overall Discussion 83
4.3 Summary of Data 84
5 CONCLUSION AND RECOMMENDATION 85
5.1 Conclusion 85
5.2 Recommendation 86
LIST OF TABLES
TABLE TITLE PAGE
2.1 Tariff rate for residential customers [8]. 12
3.1 Gantt Chart 18
3.2 Reliability of data for fluke 43B power quality analyzer [13]. 22
4.1 Measurement data for pure resistive load. 32
4.2 Measurement data for pure inductive load. 34
4.3 Measurement data for resistive load equal to inductive load. 36 4.4 Measurement data for resistive load greater than inductive load. 38 4.5 Measurement data for inductive load greater than inductive load. 40 4.6 Measurement data for resistive load equal to inductive load. 42 4.7 Measurement data for resistive load greater than inductive load. 44 4.8 Measurement data for inductive load greater than inductive load. 46
4.9 Measurement data for pure resistive load. 48
4.10 Measurement data for pure inductive load. 50
4.11 Measurement data for resistive load equal to inductive load. 52 4.12 Measurement data for resistive load greater than inductive load. 54 4.13 Measurement data for inductive load greater than inductive load. 56 4.14 Measurement data for resistive load equal to inductive load. 58 4.15 Measurement data for resistive load greater than inductive load. 60 4.16 Measurement data for inductive load greater than inductive load. 62
4.17 Measurement data for pure resistive load. 64
4.18 Measurement data for pure inductive load. 66
LIST OF FIGURES
FIGURE TITLE PAGE
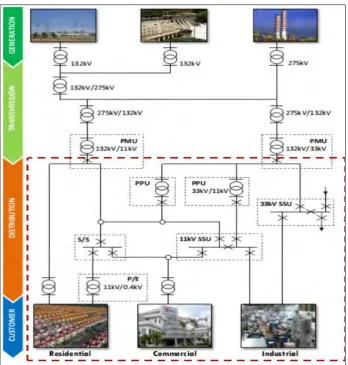
1.1 Example of electricity provider network system. 2
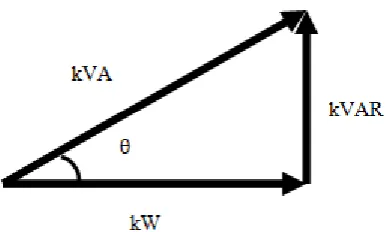
2.1 Power Triangle. 6
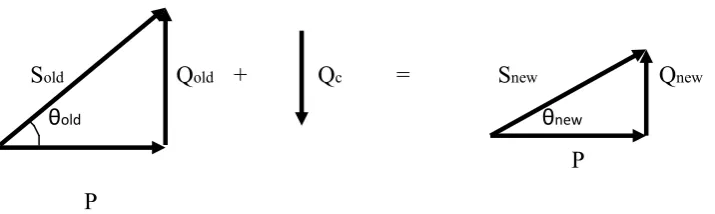
2.2 Illustration when capacitor is added to the system 12
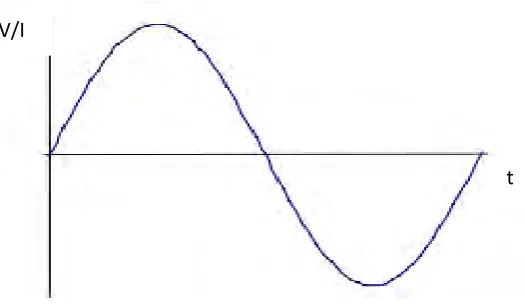
2.3 Ideal sinusoidal waveform 13
2.4 Types of voltage distortion: (a) Non-harmonic distortion, (b) flat-top harmonic distortion, (c) notching harmonic distortion. [4]
9
2.5 Energy saver device. 13
2.6 Equipment of energy saver device. 13
2.7 Schematic circuit of energy saver device. 14
2.8 Full wave bridge rectifier [9]. 14
2.9 Band pass filter circuit [10]. 15
2.10 Band pass filter [10] 15
3.1 Flowchart of Methodology. 19
3.2 Block diagram of design system. 20
3.3 Actual Circuit System Imitate to Residential Load. 21
3.4 Power quality analyzer meter. 21
3.5 Distribution box. 22
3.6 Resistive and Inductive load bank. 23
3.7 Energy saver device 1 and device 2. 23
3.8 Block diagram of design system. 25
3.9 Block diagram of resistive load bank install in system. 26 3.10 Block diagram of resistive load bank install in system. 26 3.11 Block diagram of resistive load bank in parallel with inductive load
bank install in system.
27
3.12 Block diagram of resistive load bank in series with inductive load bank install in system.
28
3.13 Block diagram of design system. 29
3.14 Block diagram of design system. 30
CHAPTER 1
1.0INTRODUCTION
The history of electricity had been found hundred years ago by Benjamin Franklin
famous kite experiment in 1752 [1]. This experiment have shown just how little we know
about electricity and afterwards a revolution of electricity grown tremendously to find new
ways to use it in order to improve our lives. In 1831, one of first breakthrough in electricity
occurred when British scientist Michael Faraday discovered the basic principles of
electricity generation [1]. Based on the experiment of Franklin and others, he created
induce electric current by moving magnet inside coils of copper wire. The discovery of this
principle has revolution and this principle is used in our modern power plant today to
produce much stronger currents on much larger scale of generation.
There are several ways to produce electricity which is, some of the stations run on the
power of coal and steam, while others run on the power of the wind or falling water. Some
even use the power of the sun alone to generate electricity. In order to produce electricity it
needed energy resources. Energy resources can be classified as renewable energy and non
renewable energy. Basically to distribute electricity to the consumer it needs to undergo a
several steps as show in figure 1.1. Firstly electricity needs to generate at power station.
Then the transmission process will take place due to the most power stations far away from
consumer. The length of transmission process normally hundreds kilometre away before
arrive at distribution. At distribution process, it will distribute the electricity to the
Figure 1.1: Example of electricity provider network system.
To generate electricity and to transfer it to consumer will cause high expenditure.
As we know, electrical power system is the expensive in term of capital investment and
operating cost contrast to other systems. In order to refund this capital, the electricity
provider will charge the consumer base on electricity tariff rate based on kW/hour of their
usage. In Malaysia, there are several types of Tenaga Nasional Berhad (TNB) customers
which are residential, commercial and industrial. The tariff rate will be different for all of
As conclusion, the bills of electricity base on tariff rate and the power usage by the
consumer. Nowadays the power usage by consumer was increasing and the electricity tariff
is unpredictable. All of this will make the increasing bills for the consumer. In order to
reduce electricity bills, consumers start to find ways to reduce their electricity bills.
Because of this problem, energy saving device had emerged in our market. The ability of
this device still in questionable. Base on retailer website, it claim the energy saver can be
reduce 330% of currently electricity bills [11][12].
1.1 MOTIVATION
Population in human race is always rising. As the population rise, the demand for
electricity also increases as well. So, electricity provider needs to generate more electric to
fulfil the demand by the customers. The cost to generate high scale electric power is very
expansive because almost all of the sources power is limited and the cost is unpredictable.
It’s also costly to transfer electric power to the consumer. However, the cost will be
responsibility by the electric consumer through to billing charges by the tariff rate that was
set by electric power provider.
The change in climate also affected the increasing of the electricity bills. For
example, during el-nino that cause increasing in ambient temperature or global warming
will make many households use their air conditioners more than usual. Due to this action,
their electricity bills are increase more than usual. Hence, there’s demand for a start to find
a way to control or reduce electricity consumption among consumers. Peoples are willing
to invest to reduce the electricity bills by purchasing the energy saver that already exist in
our market even they did not know the true capability of that device whether it can save
electricity bill or not. Another that, the effect of energy saver to the system is also
To ensure the investment that made by consumers is worthy, study on energy saver
device need to be conduct to prove the real capability of the energy saver device in order
to make sure the people are not be fooled by the claim of the energy saver can reduce an
electricity bills.
1.2 PROBLEM STATEMENT
There are tons of product that been claimed as the 'energy saver' had been released
in the market nowadays. The availability of the power/energy saver in the market had
caused for mixed reaction from the consumers. Some claimed that it can be reduce up to
30% of the electricity bills which seem to be a really smart saving. The other half claimed
that the device does not serve its purpose at all, which is not worth the hype at all. This
research hence tries to demystify the two contrasting consumer responses with practical
experimental approach
1.3 OBJECTIVE
1. To identify the working mechanism/operation of the commercial energy saver.
2. To determine the effectiveness of the energy saver on the different type and sizes of loads (R, L, R+L)
1.3 SCOPE OF PROJECT
The research will focus on the following scope:
a. The focus of this research will be for single phase residential only.
b. This research will be conducted on two different brands of energy saver available in the market.
CHAPTER 2
LITRATURE REVIEW
2.0 Introduction
This chapter covers the research theoretical part that relate on this research work. Information from the literature review is very important on this research to explain briefly about theoretical part that relate on this research.
2.1 Theory and Basic Principles
2.1.1 Power Factor Correction
[image:22.595.213.407.575.691.2]Power factor is the ratio between active power (kW) to apparent power (kVA) that exists in electrical equipment or in complete electrical installation system [2]. High of power factor means how effective electrical power is being used. Power factor also can be defining the cosine of the phase angle between active power (kW) and apparent power (kVA). The following figure 2.1 will show the power triangle and the relationship of power factor between active power and apparent power.
Power Factor = Cos θ =
(2.1)
In order to improve the efficiency and to reduce losses, power factor correction need to be apply. Power factor correction is the ways to restore the power factor to unity in order to reduce losses and meanwhile it supposed to reduce electricity bills [2]. In real world, usually power factor correction form in capacitors to neutralize magnetizing current. If capacitor connected to the circuit that nominally lagging power factor it will reduce the circuit lags proportional to make the circuit become nearly of unity power factor [2]. When apparent power (kVA) is greater than real power (kW), the utility must supply the excess reactive current plus the working current, for this case capacitors will work as reactive current generators by providing the reactive current to reduce the total amount of current in system must draw from the utility [3]. In figure 2.2 illustrate that when capacitor is connected into the nominally lagging system, it will reduce the lagging power factor to become near to unity.
Sold Qold + Qc = Snew Qnew
θold θnew
[image:23.595.106.464.514.621.2]P P
Figure 2.2: Illustration when capacitor is added to the system
2.1.2 Total Harmonic Distortion
[image:24.595.166.429.387.539.2]Most of our electrical system from generation to distribution, electricity is produce in alternating current (AC). A pure sinusoidal voltage sinusoidal voltage produced by an ideal AC generator built with finely distributed stator and field winding that operate in a uniform magnetic field since the first AC generator evolve hundreds years ago, electrical systems have experienced harmonics [5]. Harmonic distortion is the change of waveform of the supply voltage from the ideal sinusoidal [4]. When different waveform distortion together in power supply system, a new reference waveform called Total Harmonic Distortion (THD) is produced. An ideal of single phase of voltage supply 240V at frequency 50Hz with a sinusoidal waveform shown in figure 2.3.
Figure 2.3: Ideal sinusoidal waveform
The actual of electricity system can be departing from the ideal sinusoidal waveform in several respects. In figure 2.4 (a) shows a distortion of one cycle occasionally due to the switching of power factor correction capacitor on the power system and this not harmonic distortion [4]. Figure 2.4 (b) and (c) shows the form of harmonic distortion, giving flat-topped and notching effects respectively [4].
V/I