BIO-ANALYTICAL METHOD DEVELOPMENT AND
VALIDATION FOR THE ESTIMATION OF
CLOTRIMAZOLE IN HUMAN PLASMA
BY RP-HPLC METHOD
D
D
i
i
s
s
s
s
e
e
r
r
t
t
a
a
t
t
i
i
o
o
n
n
S
S
u
u
b
b
m
m
i
i
t
t
t
t
e
e
d
d
t
t
o
o
T
T
h
h
e
e
T
T
a
a
m
m
i
i
l
l
N
N
a
a
d
d
u
u
D
D
r
r
.
.
M
M
.
.
G
G
.
.
R
R
.
.
M
M
e
e
d
d
i
i
c
c
a
a
l
l
U
U
n
n
i
i
v
v
e
e
r
r
s
s
i
i
t
t
y
y
,
,
C
C
h
h
e
e
n
n
n
n
a
a
i
i
.
.
I
I
n
n
p
p
a
a
r
r
t
t
i
i
a
a
l
l
f
f
u
u
l
l
f
f
i
i
l
l
l
l
m
m
e
e
n
n
t
t
f
f
o
o
r
r
t
t
h
h
e
e
a
a
w
w
a
a
r
r
d
d
o
o
f
f
t
t
h
h
e
e
D
D
e
e
g
g
r
r
e
e
e
e
o
o
f
f
M
M
AS
A
ST
TE
ER
R
O
OF
F
P
PH
HA
A
RM
R
M
AC
A
C
Y
Y
(
(P
Ph
ha
ar
rm
ma
a
ce
c
eu
ut
ti
ic
ca
a
l
l
A
A
na
n
al
ly
ys
si
is
s)
)
APRIL-2014
DEPARTMENT OF PHARMACEUTICAL ANALYSIS
KMCH COLLEGE OF PHARMACY
BIO-ANALYTICAL METHOD DEVELOPMENT AND
VALIDATION FOR THE ESTIMATION OF
CLOTRIMAZOLE IN HUMAN PLASMA
BY RP-HPLC METHOD
D
D
i
i
s
s
s
s
e
e
r
r
t
t
a
a
t
t
i
i
o
o
n
n
S
S
u
u
b
b
m
m
i
i
t
t
t
t
e
e
d
d
t
t
o
o
T
T
h
h
e
e
T
T
a
a
m
m
i
i
l
l
N
N
a
a
d
d
u
u
D
D
r
r
.
.
M
M
.
.
G
G
.
.
R
R
.
.
M
M
e
e
d
d
i
i
c
c
a
a
l
l
U
U
n
n
i
i
v
v
e
e
r
r
s
s
i
i
t
t
y
y
,
,
C
C
h
h
e
e
n
n
n
n
a
a
i
i
I
I
n
n
p
p
a
a
r
r
t
t
i
i
a
a
l
l
f
f
u
u
l
l
f
f
i
i
l
l
l
l
m
m
e
e
n
n
t
t
f
f
o
o
r
r
t
t
h
h
e
e
a
a
w
w
a
a
r
r
d
d
o
o
f
f
t
t
h
h
e
e
D
D
e
e
g
g
r
r
e
e
e
e
o
o
f
f
M
M
AS
A
ST
TE
ER
R
O
OF
F
P
PH
HA
A
RM
R
M
AC
A
C
Y
Y
(
(P
Ph
ha
ar
rm
ma
a
ce
c
eu
ut
ti
ic
ca
a
l
l
A
A
na
n
al
ly
ys
si
is
s)
)
APRIL-2014
Submitted by
(Reg. No.261230752)
Under the Guidance of
Mrs. N.Tamilselvi, M.Pharm., Asst.Professor
DEPARTMENT OF PHARMACEUTICAL ANALYSIS
KMCH COLLEGE OF PHARMACY
Prof. Dr. A. Rajasekaran, M. Pharm, Ph.D.,
Principal,
K.M.C.H. College of Pharmacy,
Kovai Estate, Kalapatti Road,
Coimbatore -641048. (T.N)
CERTIFICATE
This is to certify that, the work embodied in the thesis entitled
“BIO-ANALYTICAL METHOD DEVELOPMENT AND VALIDATION
FOR THE ESTIMATION OF CLOTRIMAZOLE IN HUMAN
PLASMA BY RP-HPLC METHOD”
is a bonafide research work
carried out by
Reg. No:
261230752, Student in Master of Pharmacy,
Department of Pharmaceutical Analysis, K.M.C.H. College of Pharmacy,
Coimbatore, Tamilnadu under the guidance of
Mrs. N.Tamilselvi,
Asst professor
,
Department of Pharmaceutical Analysis, K.M.C.H.
College of Pharmacy during the academic year 2013-2014.
Date:
SignaturePlace: COIMBATORE
Dr. A. Rajasekaran, M. Pharm, Ph.D.,
PRINCIPAL
Mrs. N.Tamilselvi, M.Pharm.
Asst.Professor,
Dept. of Pharmaceutical analysis,
K.M.C.H. College of Pharmacy,
Coimbatore -641048.
CERTIFICATE
This is to certify that, the work embodied in the thesis entitled
“BIO-ANALYTICAL
METHOD
DEVELOPMENT
AND
VALIDATION FOR THE ESTIMATION OF CLOTRIMAZOLE IN
HUMAN PLASMA BY RP-HPLC METHOD”
is a bonafide research
work carried out by
Reg. No: 261230752,
Student in Master of
Pharmacy, Department of Pharmaceutical Analysis, K.M.C.H. College of
Pharmacy, Coimbatore, Tamilnadu, under my supervision and guidance
during the academic year 2013-2014.
I am fully satisfied with her performance and work with great
pleasure. I forward this Dissertation work for evaluation.
Date:
Signature,Place: Coimbatore.
Mrs. N.Tamil Selvi M.Pharm.,
Asst.Professor.
DECLARATION
I am here by stating that, to the best of my knowledge and belief,
the
project
report
entitled
“BIO-ANALYTICAL
METHOD
DEVELOPMENT AND VALIDATION FOR THE ESTIMATION OF
CLOTRIMAZOLE IN HUMAN PLASMA BY RP-HPLC METHOD”
being submitted for the partial fulfillment of Master of Pharmacy in
Pharmaceutical Analysis for the academic year 2013-2014 of KMCH
College of Pharmacy affiliated to The Tamilnadu Dr. M.G.R. Medical
University carried out under the guidance of
Mrs. N.Tamilselvi,
M.Pharm, Asst.professor
, at the Department of Pharmaceutical Analysis,
KMCH College of Pharmacy, Coimbatore.
I abide that all the data presented in this report will be treated with
almost confidentiality
.
Date:
Signature,
EVALUATION CERTIFICATE
This is to certify that, the work embodied in the thesis entitled
“BIO-ANALYTICAL
METHOD
DEVELOPMENT
AND
VALIDATION FOR THE ESTIMATION OF CLOTRIMAZOLE IN
HUMAN PLASMA BY RP-HPLC METHOD”
submitted by
Reg. No:
261230752,
to The Tamilnadu Dr. M.G.R. Medical University, Chennai,
in partial fulfillment for the Degree of
Master of Pharmacy
, in
Pharmaceutical Analysis
, is a bonafide research work carried out by the
candidate at K.M.C.H. College of Pharmacy, Coimbatore, Tamilnadu,
the same was evaluated by us during academic year 2013-2014.
Examination Center:
KMCH College of Pharmacy, Coimbatore.
Date:
Internal Examiner
External Examiner
ACKNOWLEDGEMENT
My dissertation entitled “BIO-ANALYTICAL METHOD
DEVELOPMENT AND VALIDATION FOR THE ESTIMATION OF
CLOTRIMAZOLE IN HUMAN PLASMA BY RP-HPLC METHOD” would
not have been a feasible one without the grace of god almighty who gave me
morale till the completion of my project.
I am extremely thankful to my Academic Guide
Mrs. N.Tamilselvi, M.Pharm, Asst Professor., Department of Pharmaceutical
Analysis, KMCH. College of Pharmacy, for his constant insight, guidance,
countless serenity, encouragement and painstaking efforts in my project work. I
am indebted to his kindness and never failing co – operation.
To begin with I would like to thank Dr. A. Rajasekaran,
M. Pharm, Ph.D., Principal, K.M.C.H. College of Pharmacy for his constant
encouragement, support and the facilities provided.
My esteemed and beloved staff Prof. J. Dharuman, M.pharm, Department
of Pharmaceutical Analysis, K.M.C.H. College of Pharmacy for their sensible
help and suggestions.
I will always remain indebted to Dr Nalla G. Palanisamy, Chairman,
and Dr. Thavamani D. Palanisamy, Managing Trustee, K.M.C.H. College of
Pharmacy, Coimbatore for all the facilities, which have been provided to us at
the institution, enabling me to do work of this magnitude.
My special thanks to all teaching and non-teaching staff members of
KMCH College Pharmacy, Coimbatore, Library and computer lab faculties
who directly or indirectly gave a helping hand during the course of study.
This project would not be a resplendent one without the timely help
and my M.Pharm juniors and I take this opportunity to acknowledge them
with thanks.
Finally I would like to express my sincere thanks to all those people
who directly or indirectly helped me to complete this work successfully.
Above all I dedicate myself before the unfailing presence of GOD and
constant love and encouragement given to me by my beloved Father, Mother,
Brothers, Sisters and all of my family members who deserves the credit of
success in whatever work I did.
ABBREVATIONS
HPLC High Performance Liquid Chromatography
UV Ultra violet
BA Bioavailability
MW. Molecular weight
e.g. Example
i.e. That is
% Percentage
PDA Photo Diode Array
IS Internal Standard
ACN Acetonitrile
MET Methanol
RF Response Factor
Mg Milligram
mL Milliliter
mM Milli molar
µg Microgram
w/w Weight by weight
v/v Volume by volume
µg/ml Microgram per milliliter
ng /ml Nanogram per milliliter
pH Hydrogen ion concentration
T Time
Abs. Absorbance
Conc. Concentration
Fig. Figure
Tab. Table
M.P. Melting Point
AUC Area under curve
CV Coefficient of variance
RSD Relative standard deviation
L/h Liter per hour
L/kg Liter per kilogram
Rpm Revolution per minute
Rt Retention time
INDEX
CHAPTER
CONTENT
PAGE
1
Introduction
2
Literature review
3
Drug profile
4
Aims and objectives
5
Plan of work
6
Methodology
7
Results and discussion
8
Summary and conclusion
Introduction
Dept. of Analysis, KMCH College of Pharmacy Page 1
1.
INTRODUCTION
Pharmaceutical Analysis(1-2) is the branch of chemistry involved in
separating, identifying and determining the relative amounts of the components
making up a sample of matter. It is mainly involved in the qualitative identification or
detection of compounds and quantitative measurements of the substances present in
bulk and pharmaceutical preparation.
Analytical instrumentation plays an important role in the production and
evaluation of new products and in the protection of consumers and the environment.
This instrumentation provides the lower detection limits required to assure safe foods,
drugs, water and air.
TYPES
There are mainly two types of chemical analysis:
1. Qualitative (Identification)
2. Quantitative (Estimation)
1. Qualitative analysis is performed to establish composition of
natural/synthetic substances. These tests are performed to indicate whether the
substance or compound is present in the sample or not. Various qualitative
tests are detection of evolved gas, formation of precipitates, limit tests, color
change reactions, melting point and boiling point test etc.
2. Quantitative analytical techniques are mainly used to quantify any
compound or substance in the sample. These techniques are based on (a) the
quantitative performance of suitable chemical reaction and either measuring
the amount of reagent added to complete the reaction or measuring the amount
of reaction product obtained. (b) The characteristic movement of a substance
through a defined medium under controlled conditions. (c) Electrical
measurement. (d) Measurement of some spectroscopic properties of the
compound.
Introduction
Dept. of Analysis, KMCH College of Pharmacy Page 2
ROLE OF BIOANALYSIS IN PHARMACEUTICAL DRUG DEVELOPMENT (6)
Quantitative determination of drugs and their metabolites in biological fluids is
termed as bioanalysis. This technique is used very early in the drug development
process to provide support to drug discovery programs on the metabolic fate and
pharmacokinetics of chemicals in living cells and in humans.
Bioanalytical methods play a major role in estimating the drugs, interferences,
metabolites from various matrices such as pure drug, dosage form, intermediates and
biological fluids. Drug assay technology is now sufficiently advanced for it to be
possible to measure the plasma concentration of majority of drugs used in clinical
practices. They are useful to measure plasma concentration of drugs to confirm
adequate dosage, to identify signs of possible drug toxicity, the response of patients to
drug therapy and drug interactions.
When a drug is administered orally it passes through the GIT and enters the
systemic circulation undergoes metabolism, finally it is excreted as such or in the
form of its metabolites. The studies on biological fluids is very challenging and time
consuming , but these studies are necessary and utmost important because biological
fluids like blood, urine, cerebrospinal fluid and milk etc containing a relative quantity
of drug and their metabolites can be known. Bio-analytical method which gives
accurate and reproducible results has been increased significantly now a day.
Therapeutic efficacy of the particular drug can be known by bioanalysis. In
Pharma field bioanalysis plays a significant role .Bioanalysis involves the following
steps.
Selection and collection of biological fluid.
Preparation of sample –Analyte extraction from biological matrix.
Analyte detection done by various methods.
In bioanalytical drug analysis, common matrices are venous blood and
plasma. Venous blood, with anticoagulant, is after centrifugation separated into
plasma and blood cells. Centrifuged blood consists of 55% plasma and 45% blood
cells. The plasma matrix is composed of some 90% water with remaining 10% being
Introduction
Dept. of Analysis, KMCH College of Pharmacy Page 3 analytical chain, and these samples must regularly be stored in a cooler or freezer
before assay. When the samples have arrived at the laboratory, they need to be
prepared for analysis. The aim is to improve the assay by removing interferences in
the matrix, and often also concentrating the analyte. The need of sample preparation
is determined by the complexity of the samples and by the application of the
analytical method.
Detection of drug or its metabolite in biological media is usually complicated
by the matrix. Because of this, various types of cleanup procedures involved i.e.
solvent extraction and chromatography are employed to effectively separate drug
components form endogenous biological materials. The sensitivity and selectivity of
the assay method was limited by the efficiency of the clean up methodology (7).
If the blood is allowed to clot and is then centrifuged, about 30 to 50% of the
original volume is collected as serum (upper level). Thus, plasma generally is
preferred because of its greater yield from blood. Blood, serum or plasma samples can
be utilized for bioanalytical studies and may require protein denaturation steps before
further processes.
If plasma or serum is used for the analytical procedure, the fresh whole blood
should be centrifuged immediately at 5000 rpm for approximately 5 to 10 min, and
the supernatant should be transferred by means of a suitable device, such as pasture
pipette, to a clean container of appropriate size of storage.
DIFFERENT TERMINOLOGY USED IN BIOANALYTICAL DEPARTMENT
Accuracy: The degree of closeness of the determined value to the nominal or known
true value under prescribed conditions. This is sometimes termed trueness.
Analyte: A specified chemical moiety being measured or which can be intact drug,
biomolecule or its derivative, metabolite and/or degradation product in a biological
matrix.
Analytical run (or batch): A complete set of analytical and study samples with
Introduction
Dept. of Analysis, KMCH College of Pharmacy Page 4 batches) may be completed in one day, or one run (or batch) may take several days to
complete.
Biological matrix: A discrete material of biological origin that can be sampled and
processed in a reproducible manner. Examples are blood, serum, plasma, urine, feces,
saliva, sputum and various discrete tissues.
Calibration Standard: A biological matrix to which a known amount of analyte has
been added or spiked. Calibration standards are used to construct calibration curves
from which the concentrations of analytes in QCs and in unknown study samples are
determined.
Internal standard: Test compound(s) (e.g. structurally similar analog, stable labeled
compound) added to both calibration standards and samples at known and constant
concentration to facilitate quantification of the target analyte(s).
Matrix effect: The direct or indirect alteration or interference in response due to the
presence of unintended analytes (for analysis) or other interfering substances in the
sample.
Method: A comprehensive description of all procedures used in sample analysis
Precision: The closeness of agreement (degree of scatter) between a series of
measurements obtained from multiple sampling of the same homogenous sample
under the prescribed conditions.
Processed: The final extract (prior to instrumental analysis) of the sample that has
been subjected to various manipulations (e.g., extraction, dilution, concentration).
Recovery: The extraction efficiency of an analytical process, reported as a percentage
of the known amount of an analyte carried through the sample extraction and
processing steps of the method.
Reproducibility: The precision between two laboratories. It also represents precision
Introduction
Dept. of Analysis, KMCH College of Pharmacy Page 5
Sample: A generic term encompassing controls, blanks, unknowns and processed
samples as described below.
Blank: A sample of a biological matrix to which no analytes have been added that is
used to assess the specificity of the bioanalytical method.
Quality control sample (QC): A spiked sample used to monitor the performance of a
Bioanalytical method and to assess the integrity and validity of the results of the
unknown samples analyzed in an individual batch.
Unknown: A biological sample that is the subject of the analysis.
Selectivity: The ability of the Bioanalytical method to measure and differentiate the
analytes in the presence of the components that may be expected to be present. These
could include metabolites, Impurities, degradants or matrix components.
System suitability: Determination of instrument performance (e.g., sensitivity and
chromatographic retention) by analysis of a reference standard prior to running the
analytical batch.
VALIDATION:
Full validation: Establishment of all validation parameters to apply to sample
analysis for the Bioanalytical method for each analyte.
Partial validation: Modification of validated bioanalytical methods that do not
necessarily call for full validation.
Cross-validation: Comparison validation parameters of two bioanalytical methods.
STORAGE REQUIREMENTS FOR BIOLOGICAL SAMPLES (8)
In order to avoid decomposition or other potential chemical changes in the
drugs to be analyzed, biological samples should be frozen immediately upon
collection and thawed before analysis. When drugs are susceptible to plasma esterase,
the addition of esterase inhibitors, such as sodium fluoride was immediately added
Introduction
Dept. of Analysis, KMCH College of Pharmacy Page 6
When collecting and storing biological samples, the analyte should be
contaminated with storage vessels. For example, plastic –ware frequently contains
high boiling liquid bis (2-ethylhexyl) phthalate; similarly, the plunger-plugs of
vacutainers are known to contain tri-butoxyethyl phosphate, which can be interfering
certain drug analysis.
EXTRACTION PROCEDURE FOR BIOLOGICAL SAMPLE
Sample preparation is a technique used to clean up a sample before analysis
and/or to concentrate a sample to improve its detection. When samples are biological
fluids such as plasma, serum or urine, this technique is described as bioanalytical
sample preparation.
Objectives of Bio-analytical sample preparation:-
1. Removal of unwanted matrix components (primarily protein) that would
interfere with analyte determination.
2. Concentration of analyte to meet the detection limits of the analytical
instrument.
3. Exchange of the solvent or solution in which the analyte resides so that it is
compatible with mobile phase for injection into a Chromatographic system.
4. Dilution to reduce solvent strength or avoid solvent incompatibility.
5. Stabilization of analyte to avoid hydrolytic or enzymatic degradation.
Blood, serum and plasma contain approximately 10,000 different proteins with
a total concentration of 6–8 g/dL, and urine contains 50–100 mg of protein/dL.
Plasma also contains approximately 3 mg/mL of sodium, 0.2 mg/mL of potassium,
15–38.5 mg/dL of urea, and many other organic and inorganic compounds. With
such complex mixtures and the dynamic ranges of proteins, fatty acids, lipids and
salts, it is clear that it is important to remove these components from the analysis, as
these factors could confound the analysis and flood the detector with irrelevant ions.
GENERAL TECHNIQUES FOR SAMPLE PREPARATION (9):-
Many different sample preparation techniques are available for choosing a
method to perform bioanalytical sample preparation. These techniques vary in many
regards, such as simplicity, time requirement (in terms of speed and hands-on analyst
time), ease of automation, extraction chemistry expertise, concentration factor and
Introduction
Dept. of Analysis, KMCH College of Pharmacy Page 7 Typical choices of sample preparation techniques useful in bioanalysis
Dilution followed by injection
Solid Phase extraction
Protein precipitation
Filtration
Liquid-liquid extraction
Restricted access media
Solid phase extraction
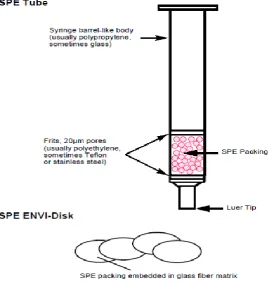
Solid phase extraction (SPE) is one of the most common bio-analytical extraction
methods in publication literature, a search of journal articles using the science direct
search engine for the term “SPE” yielded 151,017 hits, with 4,657 hits for the year
2010 alone. SPE involves a solid-liquid phase separation of the analytes from the
biological sample, by the selective transfer between a liquid and solid state (9). The
analyte is physically separated from the biological matrix by the differential
interacting with a solid phase sorbent material. These sorbents, packed primarily into
either disposable cartridges or discs, can be polar, non-polar or ionic depending on the
[image:18.596.178.450.460.748.2]experimental requirements.
Introduction
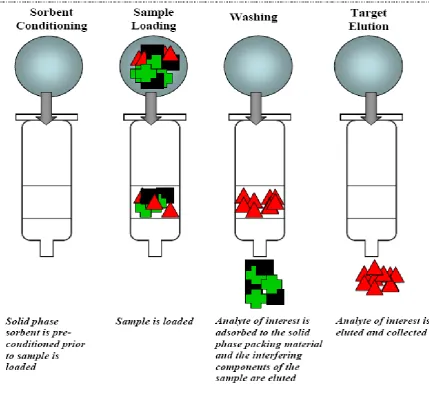
Dept. of Analysis, KMCH College of Pharmacy Page 8 Solid phase extraction is based on four distinct protocol steps as illustrated in Fig 2.
Step 1: Sorbent Conditioning
Prior to the addition of the sample conditioning and packing of the cartridge is done.
In order to remove the impurities a conditioning strong solvent like methanol is
passed through cartridge which allows sorbent to be solvated.
Step 2: Sample Loading
In a weak solvent the sample is dissolved and passed through the cartridge. Sample is
applied with a syringe or pipette or pumped into cartridge .This weak solvent helps in
retention of strong analyte.
Step 3: Washing
In order, to remove the interferences and impurities the cartridge is washed with water
or buffer.
Step 4: Analyte Elution
Strong elution solvent is passed through the cartridge and it gives 100% collection of
analyte from this method.
The availability of commercially available solid phase extraction material,
cartridges or sorbents, has led to uniformity in analysis and makes method replication
and transfer from one lab to another more straightforward. SPE is also frequently used
in on-line extraction. Automation of sample clean-up is advantageous as it
decreases the high level of manual handling and error associated with manual
extraction procedures. Though on-line SPE is faster and allows for increased
through-put injections and offers high recoveries, extensive method development is
Introduction
[image:20.596.114.544.74.471.2]Dept. of Analysis, KMCH College of Pharmacy Page 9
Fig 2: Schematic of solid phase extraction procedure
SOLID PHASE EXTRACTION THEORY
How Compounds Are Retained by the Sorbent
1) Reversed Phase
(polar liquid phase, nonpolar modified solid phase)
Hydrophobic interactions
nonpolar-nonpolar interactions
van der Waals or dispersion forces
2) Normal Phase
(nonpolar liquid phase, polar modified solid phase)
Hydrophilic interactions
Introduction
Dept. of Analysis, KMCH College of Pharmacy Page 10
pi-pi interactions
dipole-dipole interactions
dipole-induced dipole interactions
3) Ion Exchange
Electrostatic attraction of charged group on compound to a charged group on
the sorbent’s surface
4) Adsorption
(interactions of compounds with unmodified materials) Hydrophobic and
hydrophilic interactions may apply Depends on which solid phase is used
Reversed Phase SPE
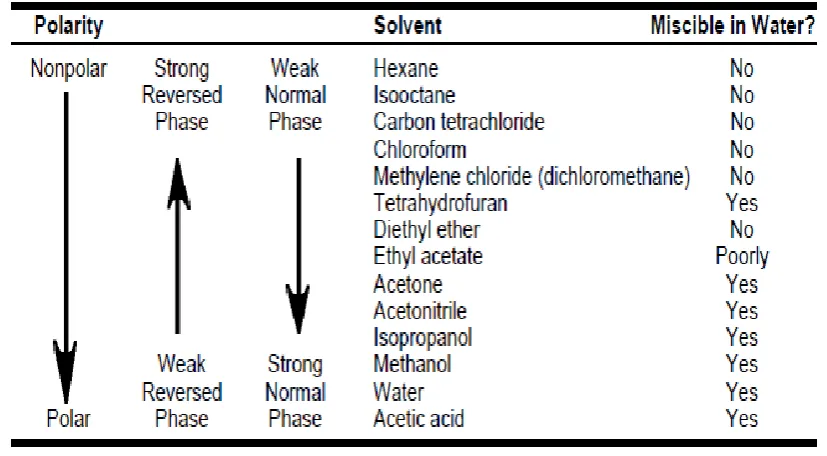
Reversed phase separations involve a polar (usually aqueous; see Table An on
page 8) or moderately polar sample matrix (mobile phase) and a no polar stationary
phase. The analyte of interests typically mid- to no polar. Several SPE materials, such
as the alkyl- or aryl-bonded silicas (LC-18, ENVI-18, LC-8, ENVI-8, LC-4, and
LC-Ph) are in the reversed phase category. Here, the hydrophilic silanol groups at the
surface of the raw silica packing (typically 60Å pore size, 40μm particle size) have
been chemically modified with hydrophobic alkyl or aryl functional groups by
reaction with the corresponding silanes.
The Role of pH in solid phase extraction
Solutions used in SPE procedures have a very broad pH range. Silica-based
packings, such as those used in HPLC columns, usually have a stable pH range of 2 to
7.5. At pH levels above and below this range, the bonded phase can be hydrolyzed
and cleaved off the silica surface, or the silica itself can dissolve. In SPE, however,
the solutions usually are in contact with the sorbent for short periods of time. The fact
that SPE cartridges are disposable, and are meant to be used only once, allows one to
use any pH to optimize retention or elution of analytes. If stability of the SPE
cartridge at an extreme pH is crucial, polymeric or carbon-based SPE materials such
Introduction
Dept. of Analysis, KMCH College of Pharmacy Page 11 range of 1-14.
For reversed phase SPE procedures on bonded silicas, if trapping the analyte in
the tube is desired, the pH of the conditioning solution and sample (if mostly or
entirely aqueous) should be adjusted for optimum analyte retention. If the compound
of interest is acidic or basic you should, in most cases, use a pH at which the
compound is not charged. Retention of neutral compounds (no acidic or basic
functional groups) usually is not affected by pH. Conversely, you can use a pH at
which the unwanted compounds in the sample are retained on the SPE packing, but
the analyte of interest passes through unretained. Secondary hydrophilic and cation
exchange interactions of the analyte can be used for retention at a proper pH. (For
more detail, see Secondary Interactions).
For adsorption media (e.g. ENVI-Carb and ENVI-Chrom P) that are used under
reversed phase conditions, a pH should be chosen to maximize retention of analytes
on the sorbent as with reversed phase bonded silicas. Elution is usually done with an
organic solvent, so pH is usually not a factor at this point. Surprisingly, phenols retain
better on ENVI-Chrom P when applied in solutions at a neutral pH, where phenols
can be charged, than at an acidic pH levels where they are neutral. This shows that
adsorption media may have different selectivities than the bonded silicas for certain
compounds, and that a range of pH levels of the sample and conditioning solutions
[image:22.596.106.520.529.757.2]should be investigated when using these materials.
Introduction
Dept. of Analysis, KMCH College of Pharmacy Page 12
Determination of solid phase extraction procedure by sample characteristics
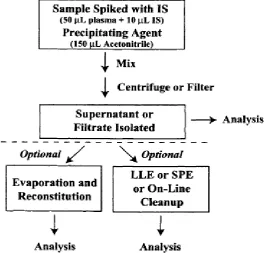
Protein precipitation
Protein precipitation is based on the interaction between the precipitation
reagent and protein groups. Soluble proteins generally have a hydrophobic core
surrounded by a hydrophilic surface including ionic groups that are not involved in
intra-molecular binding. Organic solvents interfere with the intra-molecular
hydrophobic interactions of proteins. (10)
The addition of a volume of solvent (frequently acetonitrile) to the serum
Introduction
Dept. of Analysis, KMCH College of Pharmacy Page 13 the solvent, which can either be injected directly or dried down and
reconstituted in a smaller volume to concentration before injection. While this is the
fastest and simplest method for sample preparation, it is the most likely to cause ion
suppression issues, especially in ESI, where the co-elution of endogenous compounds
such as lipids, phospholipids and fatty acids affect the ESI droplet desolvation
[image:24.596.182.450.207.460.2]process. (11)
Fig 3: Schematic diagram of Protein precipitation technique.
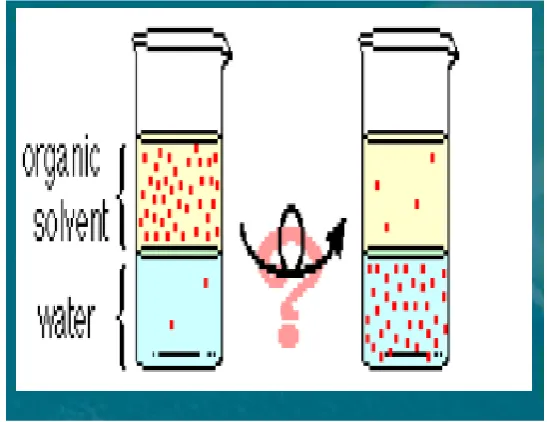
Liquid-Liquid Extraction (12)
Liquid-liquid extraction (LLE) is the simplest form of the extraction and
purification of analytes from liquid samples. The basic principle is the tendency of an
analyte to prefer one solvent over another immiscible solvent. The often-quoted
partitioning coefficient of a species is Log P. This is defined as the ratio of the
concentration in octanol divided by the concentration in water. The Log-P values of a
vast number of species have been calculated, and there are computer programs that
will calculate Log P and Log D simply from the chemical structure of the species. The
use of high-purity solvents can make this technique expensive, especially if large
volumes are required and then there is the disposal of these solvents. Carrying out
LLE requires the use of two immiscible liquids and soluble samples. It is very useful
Introduction
Dept. of Analysis, KMCH College of Pharmacy Page 14 two immiscible liquids or phases. Typically, with LLE one phase will be aqueous
(often the denser or heavier phase) and the second phase is an organic solvent (usually
the lighter phase). Hydrophilic compounds prefer the polar aqueous phase, whereas
hydrophobic compounds will prefer the organic solvent. Analytes extracted into the
organic phase are recovered relatively easily by evaporation of the solvent, whereas
analytes extracted into the aqueous phase are often amenable to direct analysis by
high-performance liquid chromatography (HPLC). Extraction efficiency can be
improved by solvent selection, solvent volume, pH, and by using the salting-out
effect.
[image:25.596.179.453.258.469.2]
Fig 4: Schematic representation of Liquid – Liquid Extraction
Positive –
Known and standard technique.
Relatively simple to do as a routine.
Trend to micro LLE.
Low LOD’s are possible.
Negative –
Moderate selective (limited in solvent selections).
Examine and use pH / ionic strength / temperature to get a selective extraction
process.
Multiple extractions needed to get the recovery.
Often evaporation steps needed.
Introduction
Dept. of Analysis, KMCH College of Pharmacy Page 15
Difficult to automate, semi-automated steps.
As routine method labor intensive.
Analytical methods for quantitative determination of drugs in biological fluids:
There are different types of methods for quantitative determination of drugs in
biological fluids. According to biological fluid and drug to be quantitated these
methods are selected. They are:
a) Methods based on immunoassay procedure
Radioimmunoassay (RIA).
Enzyme-multiplied immunoassay technique.
Enzyme-linked immunosorbent assay (ELISA).
b) Microbiological methods.
c) Capillary electrophoresis.
d) Chromatographic methods.
Gas chromatography (GC).
High performance liquid chromatography (HPLC).
Liquid chromatography-mass spectroscopy (LC-MS).
Gas chromatography –mass spectroscopy (GC-MS).
Chromatographic methods are mostly used and important for the estimation of drugs
in biological samples. Chromatography derived from “chroma” means “color” and
“graphein” means “to write”. Separation of required analyte from the compounds by
using the mobile phase and stationary phase is known as chromatography. Advanced
methods for separation of samples from biological fluids are HPLC and their
hyphenated methods like LC-MS; GC-MS.
Drugs estimation in biological samples by HPLC
Most of the drugs in biological samples can be analyzed by High performance
Liquid Chromatography method because of several advantages like accuracy,
precision, rapidity, and specificity, ease of automation and elimination of tedious
extraction methods and isolation procedure. Some of the advantages are:
Speed (analysis can be completed in 20 min or less)
Higher sensitivity (various detectors can be employed)
Good resolution (wide variety of stationary phase)
Re-usable column (expensive columns but can be used for many Samples)
Introduction
Dept. of Analysis, KMCH College of Pharmacy Page 16
Sample recovery, handling and maintenance were easy
Instrumentation leads itself to automation and quantization
Precise and accurate,
Calculation are done by integrator and
Suitable for preparative liquid chromatography on a much larger scale.
The different models of separation are in HPLC. Normal phase mode, Reverse
phase mode, reversed phase ion pair chromatography, ion exchange chromatography,
affinity chromatography and size exclusion chromatography (gel permeation and gel
filtration chromatography).
HPLC is historically divided into two different sub classes based on the
polarity of the mobile and stationary phases.
1. Normal phase high performance liquid chromatography.
2. Reverse phase high performance liquid chromatography.
Normal phase high performance liquid chromatography:
Techniques in which the stationary phase is more polar than the mobile phase
is call normal phase high performance liquid chromatography.
Stationary Phase –Polar nature
e.g.: Sio2, Al2O3.
Mobile Phase – Non-polar nature
e.g.: Heptane, hexane, cyclohexane, CHCL3, CH3OH
Mechanism:
Polar compounds travels slower and eluted slowly due to higher affinity b/w
solute and stationary phase.
No polar compound travels faster and eluted first due to lower affinity b/w solute
and stationary phase.
This technique is not widely used in pharmaceutical separation.
Reverse phase high performance liquid chromatography:
Techniques in which the mobile phase is more polar than the stationary phase is called
reverse phase high performance liquid chromatography.
Stationary phase – Non-polar nature.
e.g.: n-octadecyl, n-octyl, ethyl, phenyl diol, hydrophobic polymers.
Introduction
Dept. of Analysis, KMCH College of Pharmacy Page 17 e.g.: Methanol or Acetonitrile/water or buffer sometimes with additives of THF or
dioxane.
Mechanism:
A polar compound travels faster and eluted first due to lesser affinity b/w solute
and stationary phase.
Non polar compounds travel slower and eluted slowly due to higher affinity b/w
solute and stationary phase.
Principle:
The principle of separation is normal phase mode and reverse phase mode is
adsorption. When mixtures of components are introduced in to a HPLC
column, they travel according to their relative affinities towards the stationary
phase. The component which has more affinity towards the adsorbent travels
slower.
The component which has less affinity towards the stationary phase travels
faster. Since no two components have the same affinity towards the stationary
phase, the components are separated.
Most of the drugs in multicomponent dosage forms can be analyzed by HPLC
method because of the several advantages like rapidity, specificity, accuracy,
precision and ease of automation in this method. HPLC method eliminates
tedious extraction and isolation procedures.
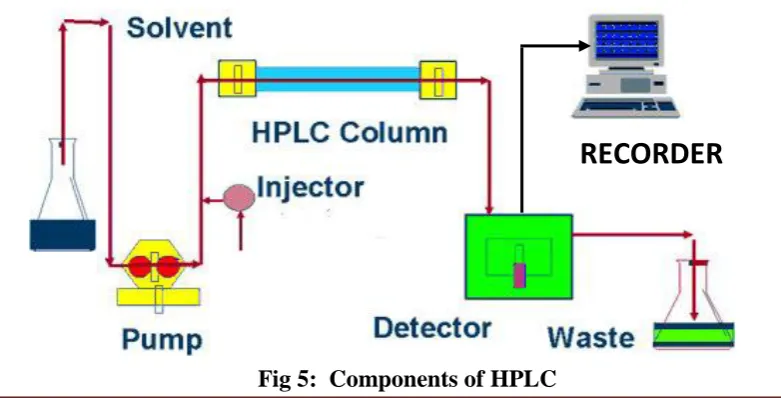
The various component of HPLC are pumps (solvent delivery system), mixing
unit, gradient controller and solvent degasser, injector (manual or auto), guard
column, analytical column, detector, recorder, and /or integrators. Recent models are
[image:28.596.130.521.573.772.2]equipped with computers and software for data acquisition and processing.
Fig 5: Components of HPLC
Introduction
Dept. of Analysis, KMCH College of Pharmacy Page 18 The choice of the column should be made after a careful consideration of the
mode of the chromatographic technique. Three types of column are available based
upon types of packing and particle size, namely, rigid solid, hard gels, and porous and
peculiar layer beds, the column of smaller particles (3-10µ) are always preferred
because they offer high efficiency(number of theoretical plates /meter) and speed of
analysis.
The different types of detection used in HPLC method based on ultraviolet
(UV), fluorescence, refractive index, mass spectrophotometric detector or a diode
array detector (DAD) Chemical derivatisation procedure for HPLC are performed in
order to improve detectability, to improved selectivity (or specificity), to modify the
chromatographic properties, and in some cases to provide favorable mass spectral
fragmentation pattern for structural elucidation when a mass spectrometer is used
either as an off or on line detector.
Approaches to HPLC derivatisation involve both pre and post column
methodology. In pre column procedures, derivatisation occurs in vitro before injection
of the sample. In post column procedure, the reaction occurs after column separation
by adding reagent to the mobile phase and /or by utilizing thermal, UV, catalytic or
other effects. Among the chemical reagent employed in precolumn procedure are
dansyl chloride, NBD chloride, o-phthaldehyde, and fluorescamine for drugs
containing amino group, danshydrazine, NBD-hydrazine, and phenyl hydrazine for
keto groups and aldehydes and p-nitro benzoyl chlorides for hydroxyl groups. Almost
all of these reagents provide highly fluorescent derivative (called fluorophors) of a
drug or metabolites except for phenyl hydrazine and p-nitrobenzoyl chloride, which
are used to create a strong absorbing chromophores for better detection of a
compound in the UV or visible region.
When a drug or metabolite is difficult to derivatise but possess reasonable
Lewis acid or base properties, an ion pair reagent is added to the mobile phase to form
an ion–pair with compound, thereby enhancing detection and chromatographic
properties. Ion pair technique such as this can be approached with both pre and post–
column methodology. Both chromogenic and fluorescing counter ions can be
employed depending on the sensitivity requirements of the assay.
Methods for analyzing drug in biological sample can be developed, provided
one has knowledge about the nature of the sample, namely, its molecular weight,
Introduction
Dept. of Analysis, KMCH College of Pharmacy Page 19 however cannot be provided because method development involves considerable trial
and error procedure. The most difficult problem usually is where to start, what type of
column is worth trying with what kind of mobile phase. In general one begins with
reverse phase chromatography, when the compounds are hydrophilic in nature with
many polar groups and are water soluble.
The organic phase concentration required for the mobile phase can be
estimated by gradient elution method. For aqueous sample mixtures, the best way to
start is with gradient reversed phase chromatography. Gradient can be started with
5-10% organic phase in the mobile phase and the organic phase concentration
(acetonitrile or methanol) can be increased up to 100% within 20-30 min. Separation
can then be optimized by changing the initial mobile phase composition and slope of
gradient according to the chromatogram obtained from preliminary run. The initial
mobile phase composition can be estimated on the basis of where the compounds of
interest were eluted, namely, at what mobile phase composition.
Elution of drug molecules can be altered by changing the polarity of mobile
phase. The elution strength of mobile phase depends upon its polarity, the stronger the
polarity, higher is the elution. Ionic sample (acidic or basic) can be separated; if they
are present in un-dissociated form. Dissociation of ionic sample may be suppressed by
proper selection of pH.
The pH of mobile phase has to be selected in such a way that the compounds
are not ionized. If the retention time is too short, the decrease of mobile phase
concentration in the mobile phase can be in steps of 5%. If the retention times are too
long, an increased in 5% steps of the organic phase concentration is needed.
Whenever acidic or basic are to be separated it is strongly advisable to control
mobile phase pH by adding a buffer, pH of the buffer be adjusted before adding
organic phase. The buffer selected for a particular separation should be used to control
pH over the range of ≈ pKa ± 1.0 the buffer should transit light at or below 220 nm so
as to allow low UV detection.
Optimization can be started only after a reasonable chromatogram has been
obtained. A reasonable chromatogram means that the entire compounds are detected
by more or less symmetrical peaks on the chromatogram. By a slight change in mobile
phase composition, the shifting of the peaks can be expected. From a few
Introduction
Dept. of Analysis, KMCH College of Pharmacy Page 20 range of investigated changes. An optimizing chromatogram is the one in which all
the peaks are symmetrical and are well separated in less run time.
The peak resolution can be increased by using a more efficient column
(column with high theoretical plate number, N), which can be achieve by using a
column of smaller particle size, or a longer column these factor, however will
increased the analysis time. Flow rate does not influence the resolution, but it has a
strong effect on the analysis time.
The parameter that are affected by the changes in chromatographic condition
are,
Resolution (Rs)
Capacity factor(K’),
Selectivity (α),
Column efficiency (N) and
Peak asymmetry Factor (As).
High-performance liquid chromatography [HPLC] is now one of the most powerful
tools in analytical chemistry. It has the ability to separate, identify and quantitated the
compounds that are present in any sample that can be dissolved in a liquid. Today,
compounds in trace concentrations as low as parts per trillion (ppt) may easily be
identified. HPLC can be and has been applied to just above any sample, such as
pharmaceuticals, food, nutraceuticals, cosmetics, environmental matrices, forensic
samples and industrial chemicals.
Mobile phases used in HPLC
In HPLC a broad variety of mobile phases can be used. According to the mode of
HPLC mobile phase can be selected like polar nature or non-polar. Mobile phase
selection depends on many factors like purity, sample solubility, chemical inertness,
detector compatibility and low viscosity. Mostly organic solvents like acetonitrile,
methanol, ethanol, formic acid etc are used. Sometimes these solvents are mixed with
water and also can be used. These mobile phases should be selected according to the
properties of drug to be estimated in HPLC, so its selection should be done carefully.
Based on the mobile phase only the drug elutes and chromatogram of that drug comes
Introduction
Dept. of Analysis, KMCH College of Pharmacy Page 21
LISTS OF STEPS NEEDED BEFORE ANY RUN BY HPLC (14):
Filter the solvents with membranes with cut off 0.22-0.45m.
Precipitates and colloids can be distinguished by using clean and transparent
reservoirs.
Make sure that the solvents will be easily mixed with the previous solvents in
the same inlets. For example methanol or water should not be placed instead of
hexane directly, or any organic solvent should not be placed directly instead of
a buffer reservoir.
Degas the solvents and remove by cleansing all the tubing that leads to the
pump.
Connect the column according to the flow direction indicated on it (do not
connect directly to the detector).
At a low flow rate stream the appropriate the solvents through the column
(0.1-0.5 ml/min) or reach the composition gradually using the appropriate
gradient.
Wait for a stable baseline and select an appropriate wavelength in the detector.
Prepare the set of methods in the workstation: Instrument method for the
control on the system, processing method for the data processing and the
report method for the report of final results.
A blank run should be performed to test the system and verify that it is clean
from interferences when the methods are ready.
Minimum requirement for HPLC: (15)
A).Temperature:
Room temperature is the first choice. Elevated temperatures are sometimes used
to reduce column pressure are enhancing selectivity. Typically, temperatures in excess
of 60oC are not used.
B).Retention time mechanism:
In general, HPLC is a dynamic adsorption process. Analyte molecules, while
moving through the porous packing bead, tend to interact with the surface adsorption
sites. Depending on the HPLC mode, the different types of the adsorption forces may
be included in the retention process:
Hydrophobic (non-specific) interactions are the main ones in Reversed-Phase
Introduction
Dept. of Analysis, KMCH College of Pharmacy Page 22
Dipole-dipole (polar) interactions are dominated in normal phase mode.
Ionic interactions are responsible for the retention in ion-exchange Chromatography.All
these interactions are competitive. Analyte molecules are competing with the eluent
molecules for the adsorption sites. So, the stronger analyte molecules interact with the
surface and the weaker the eluent interaction, the longer analyte will be retained on
the surface.
Significance of drug analysis in body fluids:
Bioanalytical studies have many important applications in pharmacy field. They
are mainly:
Bioequivalence studies.
Forensic and toxicological studies.
Drug –drug interaction and Bioavailability.
Therapeutic drug monitoring (TDM).
Adverse effect.
Over dose.
Drug abuse in sports.
Pharmacokinetic studies and In clinical trials.
Quantitative Analysis by HPLC (16):-
Three methods are generally used for quantitative analysis in HPLC. They are the
external standard method, the internal standard method and standard addition method
External standard method
The external standard method involves the use of single standard or up to three
standard solutions. The peak area or the height of the sample and the standard used are
compared directly or the slope of calibration curved based on standards that contain
known concentration of the compound of interest.
Internal standard method
A widely used technique of quantitation involves the addition of an internal
standard to compensate for various analytical errors. In this approach, a known
compound of a fix concentration is added to the known amount of sample to give
separate peak in the chromatograms, to compensate for the losses of the compound of
Introduction
Dept. of Analysis, KMCH College of Pharmacy Page 23 be accompanied by the loss of an equivalent fraction of internal standard. The
accuracy of this approach obviously depends on the structural equivalence of the
compounds of interest and the internal standard.
The requirement for an internal standard must
Give a completely resolved peak with no interferences
Elute close to the compound of interest
Behave equivalent to the compound of interest for analysis like pretreatment,
derivative formation, etc.
Be added at a concentration that will produce a peak area or peak height ratio
of about unity with the compound of interest.
Not be present in original sample
Be stable, unreactive with the sample components, column packing and the
mobile phase and
Be commercially available in high purity
The internal standard should be added to the sample prior to sample preparation
procedure and homogenized with it .Response factor is used to determine the
concentration of a sample component in the original sample. The response factor (Rf)
is the ratio of peak area of sample component (Ax) and the internal standard (AIS)
obtained by injecting the sample quantity.
Standard addition method:
In this method for the sample solution known amount of standard is added.
By plotting calibration curve graphically the quantitative analysis is carried out. This
method is used for sample which contains which contains very small quantity of
element to be analyzed. In trace analysis also this method is used. By adding the
standard to sample solution the peak area is increased and concentration of sample
will be computed by interpretation.
Validation:
Validation is a process of stabling documented evidence, where high degree of
assurance can be provided, that a specific activity will consistently produce a desired
result or product meeting its predetermined specifications and quality
Introduction
Dept. of Analysis, KMCH College of Pharmacy Page 24
Validation is very important for a method. This has to be compulsory done after
the method development. In order, to prove that process is consistently doing
1. What it is supposed to do.
2. To determine the process variable and acceptable limits for those variables and
to set up appropriate in- process control.
3. To assure the quality and to see that product is prepared in the reasonable
amount of time.
Although there are various stages in the development and validation of an
analytical procedure, the validation of the analytical method can be envisaged to be to
consist of two distinct phases:
a) The pre-study phase which comes before the actual start of the study and
involves the validation of the method on biological matrix human plasma
samples and spiked plasma samples.
b) The study phase in which the validated bioanalytical method is applied to the
actual analysis of the samples from bioavailability and bioequivalence studies
mainly to confirm the stability, accuracy and precision.
Bioanalytical method validation (BMV)(18)
For quantitative determination of drugs and their metabolites in the in biological
matrix bioanalytical method validation (BMV) is done and this gives information
about various things like pharmacokinetic, bioequivalence, bioavailability, toxicology
studies. For regulatory filings these studies will support. It is necessary to emphasize
well-characterized and fully validated analytical methods to produce reliable results
that can be satisfactorily interpreted. For each analytical method has its own
characteristics which may vary from analyte to analyte in these instances. So, specific
validation criteria is essential, to be developed for each analyte. Most of the
procedures, principles, and requirements for quantitative bioanalytical method
validation are common to all types of analytical methods. In bioanalytical method
validation two phases are present. They are:
1. The bioanalytical method development phase in which the assay is defined and
validated.
2. The application to actual analysis of samples from pharmacokinetic,
Introduction
Dept. of Analysis, KMCH College of Pharmacy Page 25
In bioanalytical method validation (BMV) validation is done by three different
levels/types of validation are done. They are Full validation, Partial validation, Cross
validation.
Full validation:
It is done when developing bioanalytical method for first time for a new drug.
Full validation is performed when an existing assay for quantification was added by
metabolites.
Partial validation:
These are modifications to bioanalytical methods for which Full validation is not
necessary. Modifications done for bioanalytical methods such as, small changes like
change in species with matrix (from rat plasma to mouse plasma),change in matrix
with in a species (from human urine to human plasma) change in laboratories or
analysts, instruments, change in sampling process procedures, change in analytical
method like changing detector.
Cross validation:
In this two bioanalytical methods are compared. The “reference” method which is
original one is compared with the revised one “comparator”. This is done where two
bioanalytical methods are compared and from that same data is prepared for study.
This is done in two ways. Spiked matrix samples and subjected samples validation
done at sane site or done at different sites i.e. different laboratories or by using
different techniques in same laboratory.
FDA guidance on bioanalytical method validation (19):
For bioanalytical method validation FDA had given some guidelines. These
guidelines are given the validation performed was to be accurate. They are:
Analyte stability in biological matrix at intended storage and operating
conditions should be kept.
Standard curve for matrix-based one should contain minimum 5 standards
without including blank and it should cover the entire range of concentrations
Introduction
Dept. of Analysis, KMCH College of Pharmacy Page 26
Essential parameters that are performed for acceptability of bioanalytical
method are precision, accuracy, selectivity, sensitivity and reproducibility.
For lowest concentration on the standard curve the lower limit of
quantification can be used and that is not confused with limit of detection.
During the Full validation of a bioanalytical method the below parameters
should be defined.
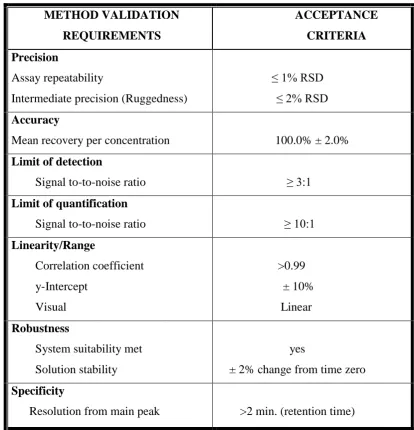
Validation parameters (20):
Different Types of Validation characteristics:
Precision
Repeatability
Intermediate Precision
Reproducibility
Accuracy
Specificity Selectivity
Linearity Range
Limit of Detection (LOD)
Lower Limit of Quantification (LLOQ)
Robustness
Ruggedness.
System Suitability
1)
Precision:When the procedure is applied repeatedly to multiple samplings of single
homogenous sample under prescribed conditions then precision, is a closeness of
individual measurements of the analyte. It is done at three levels such as repeatability,
intermediate precision, and reproducibility.
Repeatability: It expresses precision under same operating conditions i.e. with in the
laboratory same analyst using same equipment over a short period of time.
Intermediate precision: It is the precision under different laboratory conditions i.e.
varying only in different analyst, on different days, or using different equipments
Introduction
Dept. of Analysis, KMCH College of Pharmacy Page 27 Reproducibility: It is the precision between different laboratories and is often
determined in method transfer experiments
Acceptance Criteria:
Percentage Relative deviation (%RSD) NMT 1 % (Instrument precision)
(%RSD) NMT -2% (Intra- assay precision)
2)
Accuracy:It is the closeness of mean tests results obtained by the method to true
concentration of analyte. It is also named as trueness. Accuracy is determined by
replicate analysis of samples containing known amounts of the analyte. Most
commonly used method for determination of accuracy is recovery studies. The usual
range is being 10% above or below the expected range of claim. The % recovery was
calculated using the formula,
100 ) ( cov Re % bX a b a ery
Where,
a – Amount of drug present in sample
b – Amount of standard added to the sample
Acceptance Criteria:
In assay method, mean recovery will be 100% ± 2% at each concentration between
the ranges of 80-120% of the target concentration.
In impurity method, mean recovery will be 0.1% absolute of the theoretical
concentration or 10% relative, whichever is greater for impurities between the ranges
of 0.1-2.5 % (V/W).
3)
Limit of detection (LOD):The limit of detection is the lowest concentration of analyte in the sample
which can be detected but not quantified under given experimental conditions. The
lowest concentration which can be distinguished from the background noise with a
certain degree of confidence is defined as limit of detection. Prepare the blank
solution as per test method and inject six times into the chromatographic system.
Introduction
Dept. of Analysis, KMCH College of Pharmacy Page 28 analyte to 150 % (or as per protocol) of target concentration and establish the linearity
curve.
The detection limit (DL) may be expressed as:
LOD = 3.3 X Standard deviation of the response of the blank (σ)
Slope
The slope shall be estimated from the calibration curve of the analyte.
4)
Lower Limit of quantification (LLOQ):It is also the lowest concentration of analyte in the sample but quantitatively
determined with suitable accuracy and precision.
In calibration curve it is the lowest concentration point. It is determined by accuracy
by the presence of background signal and by precision i.e. reproducibility of analyte
in the method.
LOD = 10 X Standard deviation of the response of the blank (σ)
Slope
Acceptance Criteria:
In Pharmaceutical application, the LOQ is typically set at minimum 0.05% for
active pharmaceutical ingredients.
LOQ defined as the lowest concentration providing a RSD of 5%.
LOQ should be at least 10% of the minimum effective concentration for
clinical applications.
5)
Specificity:A method is said to be specific when it produces proper response only for a
single analyte. It can be demonstrated by performing Placebo / blank interference and
forced degradation studies. If the expected impurities or related substances are
available, then they should be analyzed along with the analyte or sample to check the
system suitability, retention factor, tailing factor and resolution etc. In this peak purity
Introduction
Dept. of Analysis, KMCH College of Pharmacy Page 29
6)
Linearity:As per ICH definition “the ability to obtain test results which are directly
proportional to the concentration of an analyte within given range is known as
linearity of an analytical procedure”. By using correlation coefficient this can be
tested. Using correlation coefficient is a benefit as it is a relationship between
concentration and response data. In this data is analyzed by linear least square
regression co-efficient and b of the linear equation,
Y= aX + b
By the above equation regression r value can be known. For the method to be linear
the r value should be close to1. Where Y is the measured output signal, X is the
concentration of sample, a is the slope, b is the intercept.
Acceptance criteria:
Coefficient of correlation should be NLT 0.99.
7)
Robustness:It is the measure of its capacity to remain unaffected by small, but deliberate
variations in method parameters and provides an indication of its reliability during
normal usage.
8)
Ruggedness:Ruggedness according to the USP is “the degree of reproducibility of test results
obtained by the analysis of the same samples under a variety of normal test
conditions, such as different labs, different analysts, and different lots of reagents. The
following are the typical method parameters need to test during method validation:
Analyst-to-Analyst variability.
Column-to-Column variability.
On different days.
Introduction
Dept. of Analysis, KMCH College of Pharmacy Page 30
APPLICATION OF A VALIDATED BIOANALYTICAL METHOD TO
ROUTINE DRUG ANALYSIS (21)
Many of the above principles under method establishment and validation are
relevant to within study validation. This section will emphasize the validation
parameters that should be evaluated during routine application of a validated
bioanalytical method to a particul