Development of a Decision Support System for Furrow
and Border Irrigation.
A Dissertation submitted by David McClymont, B Eng (hons)
For the award of Doctor of Philosophy
Furrow and border irrigation practices in Australia and around the world are typically inefficient. Recent advances in computer-based surface irrigation decision support technology have the potential to improve performance, but have had little uptake. Despite considerable academic achievements with individual components of the technology, the implementation of this knowledge into usable tools has been immature, hindering adoption. In particular, there has been little progress in encapsulating the different decision support components into a standalone system for surface irrigation. Therefore, the research problem addressed in this dissertation aims to develop a new decision support system for furrow and border irrigation aimed at increasing the usability of the technology, and improving decision making capabilities. Specifically the research hypothesis is:
“That calibration, optimisation, and parameter analysis capabilities can be developed and integrated with an accurate and robust simulation model into a decision support system to improve furrow and border irrigation performance.” Six research objectives have been identified to support the hypothesis including: (RO1) investigate existing surface irrigation modelling technology to determine a model and solution technique structure suitable for incorporating into a decision support system; (RO2) develop a robust reliable simulation engine for furrow and border irrigation for automation within a decision support system under optimisation and systematic response evaluation; (RO3) investigate and develop parameter estimation (calibration) capabilities for the decision support system; (RO4) investigate and develop optimisation capabilities for the decision support system; (RO5) investigate and develop parameter response (design charts) capabilities for the decision support system; and (RO6) develop an object-oriented framework to combine the components developed in Research Objectives 2 to 5 with data management facilities and a graphical user interface.
Successful completion of these objectives has resulted in the development of a decision support system for furrow and border irrigation featuring an automation-capable hydrodynamic simulation engine, automated full-hydrodynamic inverse solution, automated optimisation of design and management variables, and automated user-definable real-time generation of system response. This was combined with a highly flexible object-oriented program structure and web-browser-like graphical user interface. Each of these components represents a unique implementation of the required functionalities, differing from the established software packages (such as SIRMOD and WinSRFR) that use alternate technologies with no automation or optimisation capabilities.
simulation engine, with robustness and reliability tested through tens of thousands of simulations under optimisation and automated system response evaluation.
The calibration facilities demonstrated that the inverse-solution using the full-hydrodynamic model is a viable and robust methodology for the unique identification of up to three infiltration/roughness parameters. Two optimisation-methods were investigated during this research with objective-functions based upon either a volume-balance time-of-advance equation, or complete simulations of the hydrodynamic model. A simple but robust optimisation algorithm was designed for this purpose. While the volume-balance method proved fast and reliable, its accuracy is reduced due to the underlying assumptions and simplistic model structure. The hydrodynamic method was shown to be accurate, although it suffered slow execution times. It was therefore decided to use the two methods in tandem during the solution process where the faster volume-balance method is used to provide starting estimates for the more accurate hydrodynamic method. Response-surface investigation for the advance-based objective function identified a unique solution when solving for three parameters. It was found that the automated unconstrained optimisation of design and management practices is limited to the selection of one solution variable (time to cut-off) due to non-unique multi-variable solutions. Nevertheless, the developed facilities provide a unique benchmarking of irrigation performance potential. This research has used the earlier-developed optimisation algorithm to automate simulations using a prototype objective-function based upon user-defined weightings of key performance measures. A study of the response-surfaces of different configurations of the objective-function identified parabolic ridges of alternate solutions, so, in practice, the optimisation process simplifies down to optimising only one parameter: time-to-cutoff. It was also recognized that the performance-based objective functions are highly sensitive to numerical discretisation inconsistencies that occur between simulations, which impede solution convergence.
develop the FIDO (Furrow Irrigation Decision Optimiser) decision support system. There were three focus areas during this marriage of components; firstly, an object-oriented structure was developed to accommodate program elements concentrating on separating the graphical user interface components from other task related objects for flexible future development; secondly, a database was developed using XML-based technologies to store property, paddock, event and model information; and thirdly, a user-friendly graphical user interface was created with web-browser-like functionality. The software design evolved through many different prototypes with its current design being heavily influenced from the successes and mistakes of the previous attempts.
I certify that the ideas, experimental work, results, analyses, software and conclusions reported in this dissertation are entirely my own effort, except were otherwise acknowledged. I also certify that the work is original and has not been previously submitted for any other award, except where otherwise acknowledged.
Signature of Candidate Date
ENDORSEMENT
Signature of Supervisor Date
I shall take this opportunity to thank and acknowledge those who provided valuable assistance and inspiration throughout the duration of this research. Firstly, I am particularly grateful to Professors Rod Smith and Steve Raine for their forward vision with the irrigation research being conducted at USQ. Rod stimulated my initial research efforts and taught me the concepts of researching and presenting the work. His background in hydraulic and irrigation engineering was regularly tested whenever technical problems arose in refining the simulation engine. Steve has provided the practical guidelines for developing the decision support system, and continually managed to lift my enthusiasm for the project when other work was dominating.
I would like to thank Professor Wynn Walker of Utah State University for introducing me to Borland C++ Builder, without which, this project (and my career) would have had an entirely different outcome. Professor Walker was also gracious in providing the source code of his own software SIRMOD for us to review and study in the early stages of this project.
In addition, my mother Mrs Grace McClymont has been a continual source of inspiration, support and encouragement.
Finally I would thank my loving friend and wife Hoda for her patience, love and support while enduring significant absence of my time over the eight years we have been together during development of this dissertation.
This dissertation has covered a wide range of topic areas in developing a decision support system for furrow and border irrigation. A summary of the major contributions to theory and practice arising from this research include:
• Development of a robust, reliable and flexible hydrodynamic simulation engine for furrow and border irrigation for automation within a decision support system under optimisation and systematic response evaluation. This includes:
o Refinement of existing simulation technologies including the simplification of the algebraic equations for the Preismann double-sweep solution technique;
o Development of an object-oriented structure to simplify operation and improve flexibility and future development; and
o Identification and solution to convergence problems associated with hydrodynamic modelling.
• Development of an automated hydrodynamic inverse solution technique for estimating soil infiltration (and roughness) parameters. This includes:
o Development of a simple reliable optimisation algorithm;
o Development of a simple volume-balance-based inverse technique for calibrating with a minimum of field data, and for generating initial parameter estimates for the hydrodynamic solution; and
o Investigation of parameter response-surfaces for the inverse problem identifying a unique solution when estimating three infiltration parameters.
• Development of an automated optimisation technique for design and management practices, with an emphasis on quantifying the potential of irrigation performance. This includes:
o Development of a user-defined objective-function for optimisation of irrigation design and management practices;
o A study of the system response for optimising irrigation performance identifying that an unlimited range of management options exists to achieve an optimum level of performance;
o The subsequent recommendation of optimisation on only one design or management parameter due to the non-unique solution and noise in the system response; and
o Provides and automated facility for benchmarking the performance potential of an irrigation.
• Development of an automated guideline generation facility for design and management of surface irrigation, and system response evaluation, based on repeated runs of the hydrodynamic simulation. This includes:
o Evaluation of a range of alternative design and management guidelines that emphasise the sensitivity of temporal variations in infiltration; and
o Development of highly configurable user interface tools for selection of design and management variables/parameters, configuration of charts, and filtering of results.
changes;
o Development of an object-oriented program structure focusing on adaptability for future enhancements and inclusions; and
o Development of a simple to use web-browser-like graphical user interface, emphasising progressive-disclosure concepts, to help improve adoption of the technology to more users.
Publications arising from this research
This dissertation is the culmination of ten years of research. The majority of the research was undertaken in the first four years until work and family commitments intervened and very little output was generated for a period of four to five years. Publications produced during the initial years of this research include:
McClymont, DJ & Smith, RJ 1996, ‘Infiltration parameters from optimisation on furrow irrigation advance data’, Irrigation Science, 17(1): 15-22.
Smith, RJ & McClymont, DJ 1996, ‘Toward real time control of surface irrigation: Estimation of soil infiltration parameters under surface and surge irrigation’, Proc. AgEng96, the European Conference on Agricultural Engineering, Madrid, Sept 1996.
McClymont, DJ 1996, ‘A simple reliable nonlinear optimisation /solution technique suitable for agricultural applications’, Proc. of Conference on Engineering in Agriculture and Food Processing 24-27 November 1996, University of Queensland, Gatton College. SEAg 96/063
Smith, RJ & McClymont, DJ 1996, ‘Surge irrigation infiltration parameters from surge advance data’, Proc. of Conference on Engineering in Agriculture and Food Processing 24-27 November 1996, University of Queensland, Gatton College. SEAg 96/051
McClymont, DJ, Raine, SR & Smith, RJ 1996, ‘The prediction of furrow irrigation performance using the surface irrigation model SIRMOD’, Proc. of Irrigation Australia Conference and Exhibition - Australian Solutions, May 14-16 1996, Adelaide Convention & Exhibition Centre South Australia
Smith, RJ & McClymont, DJ 1996, ‘Towards real time control of surface irrigation: Estimation of soil infiltration parameters under surface irrigation and surge irrigation’, Proc. of Irrigation Australia Conference and Exhibition - Australian Solutions, May 14-16 1996, Adelaide Convention & Exhibition Centre South Australia
Smith, RS, Raine, SR, & McClymont, DJ 1997, ‘Design for improved efficiency of surface irrigation applications: A best management practice’, Proc. AWWA Regional Conference
Raine, SR, McClymont, DJ, & Smith, RJ 1997, ‘The development of guidelines for surface irrigation in areas with variable infiltration’, Proc. Aust. Soc. Sugar Cane Technologists, 29 April-1st May, Cairns.
on Multi-Objective Decision Support Systems, 1-6 August, Brisbane.
Abstract ... iii
Certification of dissertation ... vii
Acknowledgements ... ix
Contributions to theory and practice from this research ... xi
Publications arising from this research... xiii
Table of contents ... xv
List of figures ... xxi
List of tables... xxvii
List of symbols... xxix
Chapter 1 Introduction: Towards the development of a decision support system for furrow & border irrigation ... 1
1.1 Introduction...1
1.2 Background...1
1.3 The research problem ...3
1.4 Justification of research...4
1.5 Definitions...5
1.5.1 Defining surface irrigation practices...5
1.5.2 Defining design and management of surface irrigation...5
1.5.3 Defining surface irrigation modelling...6
1.5.4 Defining decision support systems for furrow and border irrigation. ...6
1.6 Delimitations of scope ...6
1.6.1 Focus upon Australian furrow and border irrigation practices...7
1.6.2 Focus upon engineering aspects of in-field design and management ..7
1.6.3 Focus upon conceptual design of a decision support system. ...7
1.6.4 Focus on irrigators, consultants and researchers. ...7
1.6.5 Focus upon validation against existing proven technology...7
1.7 Outline of dissertation...8
1.8 Conclusions...9
Chapter 2 Background to surface irrigation decision support ... 11
2.1 Introduction...11
2.2 Surface irrigation background ...11
2.2.1 History ...11
2.2.2 Techniques ...12
2.2.3 Phases of the irrigation cycle ...12
2.2.4 Design and management practices...13
2.3.3 The need for decision support systems... 15
2.3.4 Research for decision support systems... 15
2.4 Background to simulation modelling... 16
2.4.1 Model equations... 16
2.4.2 Simplification of the model... 16
2.4.3 Infiltration model ... 18
2.4.4 Numerical solution techniques ... 19
2.4.5 Dimensionless solution formulations ... 20
2.5 Simulation model development... 20
2.5.1 The evolution of volume-balance models... 21
2.5.2 The evolution of kinematic wave models ... 23
2.5.3 The evolution of zero-inertia models... 26
2.5.4 The evolution of hydrodynamic models ... 28
2.6 “Inverse” methodologies... 30
2.6.1 Graphical solution techniques for the “inverse problem” ... 31
2.6.2 Numerical approximation techniques for the “inverse problem” ... 33
2.6.3 Optimisation-based techniques for the “inverse problem” ... 35
2.7 Optimisation of furrow and border irrigation design and management ... 39
2.7.1 Human based learning for optimising design and management ... 39
2.7.2 Design charts for optimising design and management... 40
2.7.3 Computer optimised practices for design and management... 41
2.7.4 Real time automated control... 43
2.8 Decision support software for furrow and border irrigation ... 44
2.9 General discussion ... 46
2.10 Direction for developing a new decision support system for furrow and border irrigation... 47
2.11 Conclusions ... 47
Chapter 3 Development of a simulation engine for furrow and border irrigation decision support ...49
3.1 Introduction... 49
3.2 Background to simulation engine design... 49
3.2.1 What is a simulation engine? ... 49
3.2.2 Elements of the simulation engine ... 50
3.2.3 Objectives of simulation engine development ... 51
3.2.4 Model and solution technique considerations... 52
3.2.5 Software algorithm design considerations... 53
3.2.6 Programming complexity issues... 53
3.3 Model and solution technique formulation... 54
3.3.1 Choosing the underlying model... 54
3.3.2 Choosing a numerical solution technique ... 55
3.3.3 Solution grid formation ... 57
3.3.4 Input requirements ... 58
3.3.5 Simulation engine outputs... 58
3.3.6 Solution node outputs... 58
3.3.7 Summary outputs... 59
3.4 Refinement of the numerical method ... 61
3.4.5 Lateral flow conditions...74
3.4.6 Boundary conditions ...74
3.4.7 Initial parameter estimates ...75
3.4.8 Parameter constraints ...76
3.5 Computer algorithm development...77
3.5.1 Developing a structure...77
3.5.2 Model algorithm ...79
3.5.3 Input parameter objects ...81
3.5.4 Output objects ...82
3.5.5 Phase switching ...82
3.5.6 Exception handling...84
3.6 Observations on simulation characteristics ...84
3.6.1 Cell sizes decrease downstream...84
3.6.2 Sources of volume-balance error...84
3.6.3 Sources of instability...85
3.6.4 Effect of solution grid structure...87
3.6.5 Recession approximations can cause instability...88
3.6.6 Transition to runoff ...89
3.7 Achieving simulation robustness...90
3.7.1 Early time-step calculations ...90
3.7.2 Parameter monitoring during iterations ...90
3.7.3 Pre-testing time-step to remove collapsing cells ...91
3.7.4 Automatic time-step management ...92
3.8 Validation ...92
3.8.1 Accuracy of results...93
3.8.2 Operation speed...94
3.9 Conclusions...94
Chapter 4 Estimation of soil infiltration and hydraulic roughness parameters... 95
4.1 Introduction...95
4.2 Background to estimation of soil infiltration and roughness parameters...95
4.2.1 Objectives of calibration module development...96
4.2.2 Elements of the calibration module...96
4.2.3 Limitations of existing techniques ...98
4.3 Preliminary study – INFILT volume-balance solution technique ...99
4.3.1 Derivation of method ... 100
4.3.2 Optimisation technique ... 101
4.3.3 Comparison with other methods... 104
4.3.4 Volume-balance errors... 106
4.3.5 Objective-function response-surfaces ... 107
4.3.6 Data handling ... 109
4.3.7 Findings of the preliminary study... 111
4.4 FIDO hydrodynamic inverse technique... 112
4.4.1 Algorithm design considerations... 112
4.4.2 Derivation of FIDO hydrodynamic inverse method... 113
4.4.3 Developing an object-oriented structure ... 113
4.4.7 Response-surfaces... 120
4.5 Validation ... 120
4.6 Conclusions... 122
Chapter 5 Automatic optimisation of design and management parameters ...125
5.1 Introduction... 125
5.2 Background to optimising surface irrigation practices ... 125
5.2.1 What is the automatic optimisation of surface irrigation practices?. 126 5.2.2 Objectives of optimisation-module development... 126
5.2.3 Elements of the optimisation-module... 127
5.2.4 Methodology considerations ... 128
5.3 Objective-function formulation ... 129
5.4 Computer algorithm development... 130
5.4.1 Developing a structure... 130
5.4.2 Objective-function algorithm ... 132
5.4.3 Optimisation algorithm ... 132
5.4.4 Decision variable selection and constraints ... 132
5.5 Investigation of objective-function response... 133
5.5.1 Response of irrigation performance measures... 133
5.5.2 System response for different management strategies... 135
5.5.3 Closer examination of response-surface characteristics ... 136
5.5.4 Variations in system response for different field-lengths... 139
5.6 Optimisation validations... 140
5.7 Discussion... 142
5.8 Conclusions... 143
Chapter 6 Automated generation of field design and management guidelines...145
6.1 Introduction... 145
6.2 Background to automating the development of field design and management guidelines ... 145
6.2.1 What is automated generation of field design and management guidelines?... 146
6.2.2 Objectives for developing a system for automating field-guideline generation... 146
6.2.3 Elements of an automated system to generate field design and management guidelines ... 147
6.3 Accounting for infiltration variation ... 148
6.4 Preliminary Study: Development of guidelines for surface irrigation... 150
6.4.1 Field data ... 150
6.4.2 Pre-analysis of infiltration data ... 150
6.4.3 Evaluation of management strategies... 151
6.4.4 Investigation of design curves... 152
6.4.5 Finalisation of guidelines... 154
6.4.6 Discussion of case study ... 155
6.4.7 Recommendation from case study ... 157
6.6.1 Response-surfaces ... 161
6.6.2 Guidelines for design and management ... 161
6.7 Discussion of parameter-analysis facility ... 162
6.8 Conclusions... 163
Chapter 7 Software engineering a decision support system for furrow and border irrigation... 165
7.1 Introduction... 165
7.2 Decision support system design criteria... 165
7.2.1 What is the FIDO decision support system ... 165
7.2.2 Objectives of decision support system development ... 166
7.2.3 Software engineering tools... 166
7.3 Program framework... 167
7.3.1 Design methodology ... 167
7.3.2 Structural components ... 168
7.3.3 Structural connections... 172
7.4 Developing a surface irrigation database... 174
7.4.1 Design considerations ... 174
7.4.2 Schema representation of the data... 175
7.4.3 Database connections... 177
7.4.4 Programming implementation of the database... 177
7.4.5 Database development methodology... 180
7.5 Graphical user interface... 181
7.5.1 Principles of graphical user interface design... 181
7.5.2 Evaluation of existing interfaces ... 182
7.5.3 Prototyping the interface ... 186
7.5.4 Current interface functionality ... 188
7.5.5 Interface layout ... 188
7.5.6 Modules ... 189
7.6 Using the decision support system ... 199
7.7 Conclusions... 199
Chapter 8 Conclusions, implications and recommendations ... 201
8.1 Introduction... 201
8.2 Overview of previous chapters ... 201
8.3 Conclusions about the research problem... 204
8.3.1 Discussion of the research objectives... 205
8.3.2 Practical implications of this research ... 209
8.4 Limitations ... 211
8.5 Recommendations for further research and development ... 211
8.6 Concluding postscript... 212
List of References... 213
Appendix 2.1 Derivation of the Saint Venant Equations with lateral inflows and outflow ... 229
A2.1.1 Assumptions... 229
Appendix 2.2 Case study – evaluation of SIRMOD...235
A2.2.1 Outline of case study ... 235
A2.2.2 Rational for study ... 235
A2.2.3 Materials and methods... 235
A2.2.4 Validation of the model... 237
A2.2.5 Sensitivity analysis ... 239
A2.2.5 Mathematical convergence errors ... 243
A2.2.6 Results using empirically fitted infiltration parameters ... 243
A2.2.7 Discussion of results of case study... 244
Appendix 3.1 Simulation engine source code ...247
A3.1.1 C++ Header file ... 247
A3.1.2 C++ Source File ... 251
Appendix 3.2 Validation of FIDO Simulation Engine against SIRMOD Output...269
Appendix 4.1 Calibrated advance curves ...289
Appendix 5.1 Response-surface generation for different user-defined weightings of the objective-function ...297
Appendix 5.2 FIDO Optimisation Trial Results ...303
Appendix 7.1 Software engineering tools ...313
A7.1.1 Target operating system ... 313
A7.1.2 Programming languages... 313
A7.1.3 Database environment ... 314
A7.1.4 Development environments ... 315
A7.1.5 Components and libraries ... 316
Appendix 7.2 FIDO XML Data Structures...319
Appendix 7.3 Evolution of FIDO’s simulation GUI ...323
Appendix 7.4 Evolution of FIDO’s calibration GUI...329
Appendix 7.5 Evolution of FIDO’soptimisation GUI... 331
Appendix 7.6 Evolution of FIDO’s parameter analysis GUI ... 333
Figure 2.1: (a) Water surface profiles and (b) advance and recession
characteristic curves for different phases of the irrigation cycle... 13
Figure 3.1: Fundamental Components of the Simulation Engine. ... 50
Figure 3.2: Eulerian (a) and “deformable control volume (Lagrangian)” (b) grid structures... 57
Figure 3.3: Components used in calculating Application Efficiency... 59
Figure 3.4: Components used in calculating Storage Efficiency. ... 60
Figure 3.5: Components used in calculating Application Uniformity... 60
Figure 3.6: Eulerian Grid Cells and time-dependant (physical) representation... 62
Figure 3.7: First cell representation... 70
Figure 3.8: Two cell grid representation... 72
Figure 3.9: Basic linear or “Black Box” functionality of simulation engine... 77
Figure 3.10: Simulation Engine Object Structure ... 78
Figure 3.11: Parameter object and model-object interaction in the FIDO simulation engine... 78
Figure 3.12: Algorithm used in the simulation engine for running simulations. . 80
Figure 3.13: Structure of the object-oriented input parameter types used in FIDO.. ... 81
Figure 3.14: Memory allocation technique employed by theT2DGridParameter types... 82
Figure 3.15: Algorithm for adding/remove phase component to the "set"... 83
Figure 3.16: Typical iterations log for different irrigation phases... 85
Figure 3.17: Convergence Log for A and Q parameters during transition from depletion phase to recession phase. The surface water and infiltration profiles are shown in the top chart. Convergence was achieved in 12 iterations... 86
Figure 3.18: Example of convergence failure during the recession phase... 87
Figure 3.19: Effect of a sudden change in time-step on advance trajectory... 87
Figure 3.20: Problems with recession definition ... 89
Figure 3.21: Fluctuations in runoff hydrograph in (a) FIDO simulation engine and (b) SIRMOD output... 89
Figure 3.22: Repeating mirrored-oscillations... 91
Figure 3.23: Sample output of validation of FIDO simulation engine against SIRMOD results. Blue lines are the FIDO output; Red lines are the SIRMOD output. ... 92
Figure 3.24: Scatter-plot analysis of FIDO vs SIRMOD outputs... 93
Figure 4.1: Fundamental components of the calibration module. ... 97
Figure 4.2: Conceptual input/output functionality of the Calibration module... 98
Figure 4.3: Step-cycle involved for two parameters ... 102
Figure 4.4: (a) Response-surface of Rosenbrock's function; (b) Response trajectory of 25 sets of initial starting estimates. ... 103
Figure 4.5: Cumulative infiltration curves for the Flowell wheel, Flowell nonwheel, Kimberly wheel, Kimberly nonwheel furrows, comparing the results of the method to that of Walker and Busman (1990)... 106
Figure 4.8: Cumulative infiltration curves for original and smoothed Flowell nonwheel advance data of Walker and Busman (1990)... 110 Figure 4.9: Effect of flow measurement errors on cumulative infiltration of Flowell
nonwheel furrow of Walker and Busman (1990) at t=432 min ...111 Figure 4.10: Object-oriented components for calibration module...114 Figure 4.11: Calibration module algorithm ... 115 Figure 4.12: Objective-function algorithm for advance data...116 Figure 4.13: Objective-function algorithm for runoff data...117 Figure 4.14: Objective-function algorithm for combination advance and runoff
data. ...118 Figure 4.15: Advanced calibration output showing parameter and objective-function variations during optimisation. Arrow indicates the transition from the INFILT method to the hydrodynamic-based objective function. ...119 Figure 4.16: Hydrodynamic response-surface investigation for different values of
Kostiakov fo... 121 Figure 4.17: Sample calibration output. The red advance curves result from the
INFILT calibration, while the blue curves result from the hydrodynamic
calibration. ... 122 Figure 5.1: Fundamental elements of the optimisation component...127 Figure 5.2: Conceptual input/output functionality of the optimisation-module.128 Figure 5.3: Object-oriented components for optimisation algorithm... 131 Figure 5.4: Objective-function algorithm ...132 Figure 5.5: Response-surfaces for irrigation performance measures...134 Figure 5.6: Response-surface for equal weightings of the objective-function
components... 137 Figure 5.7: Dependence of volume-balance error on time-to-cutoff. ...138 Figure 5.8: Influence of z-required on slope of maximum-ridge (a) z-req =0.075 m
and (b) z-req=0.15 m ... 139 Figure 5.9: Relationship between (a) and (c) peak objective-function values
(filtered) and (c) volume-balance errors. ...140 Figure 5.10: Sample output from optimisation validation in Appendix 5.2. Blue
lines denote optimised outputs, while red lines represent the measured condition. ... 141 Figure 5.11: Comparison of performance values for optimised versus measured
results. (where AE is application efficiency, SE is storage efficiency, and DU is application uniformity) ... 141 Figure 6.1: Fundamental components of the parameter-analysis module...147 Figure 6.2: Conceptual input/output functionality of the parameter–analysis
module ... 148 Figure 6.3: Infiltration range is calculated from high/low and average of paddock-
specific infiltration curves... 149 Figure 6.4: Objective-function algorithm for calculating average infiltration curve ... 149 Figure 6.5: Cumulative infiltration curve fitting results showing (a) “sticking point”
encountered in early research, and (b) correct curve fitting results... 150 Figure 6.6: Summary of infiltration information Jarvisfield site throughout the
water application rate of 2.6l/s and a range of irrigation periods from 190-270 mins. ... 153 Figure 6.8: The effect of field-length of the maximum application efficiency of the
soil with low, average and high infiltration characteristics when water is applied at 2.6l/s for a range of irrigation periods. ... 154 Figure 6.9: Design charts based on (a & d) high, (b & e) average and (c & f) low
infiltration characteristics... 155 Figure 6.10: Example of a design chart by Hornbuckle et al. (2003) for furrow
irrigated field on a self-mulching clay soil with furrow length 200m. The solid line in upper chart corresponds to distribution uniformity, and in the lower chart corresponds to the infiltrated volume... 156 Figure 6.11: Object-oriented components for design and management guideline
generation... 158 Figure 6.12: Storage and definition objects of Parameter Analysis Manager ... 159 Figure 6.13: Mapping of dimensions from the Response object to the data array
object. ... 160 Figure 6.14: Sample design chart output from the parameter-analysis module. ... 162 Figure 7.1: Conceptual view of FIDO program elements showing separation
between graphical user interface and other program code. Arrows represent communication lines between objects. ... 168 Figure 7.2: Main user-interface units in FIDO showing relative positions and
parent objects. Layers designate parent/child relationships and "OR" symbol suggests that either one element or another will be shown depending on current program conditions... 169 Figure 7.3: Derivation of manager objects used in FIDO. ... 170 Figure 7.4: Derivation of analysis classes in FIDO. ... 171 Figure 7.5: FIDO structure demonstrating interactions and connections between
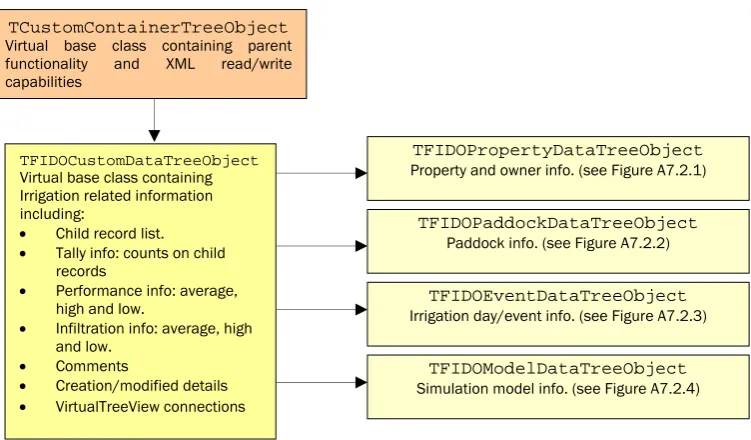
the central “user interface units”, “managers”, “tools” and “analysis” components. The project object is visible to all components. ... 173 Figure 7.6: Schema representation of main FIDO database connections. ... 177 Figure 7.7: Derivation of record object classes in FIDO... 178 Figure 7.8: Sequence of summary calculations performed by
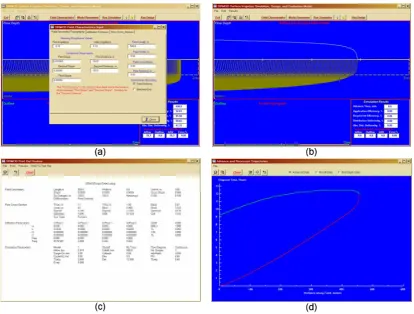
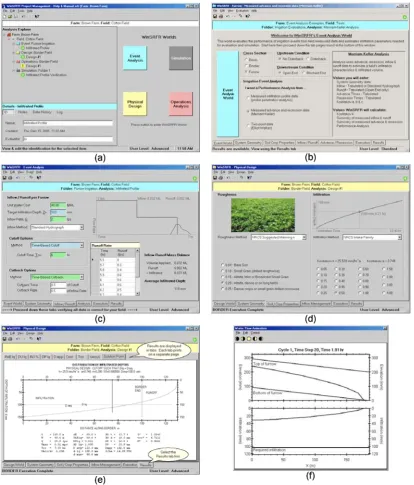
TFIDOCustomDataTreeObject children. ... 179 Figure 7.9: Parameter object design hierarchy as used in FIDO... 180 Figure 7.10: SIRMOD user-interface screenshots: (a) shows one of the many
input dialogs; (b) animation of water flowing along and infiltrating into furrow; (c) tabulated input parameters; and (d) plotted output of advance and recession characteristics... 183 Figure 7.11: Screenshots of the SRFR interface: (a) shows the main parameter
input dialog; (b) represents the animation of water flowing along and infiltrating into the furrow; (c) demonstrates curves of advance, recession, inflow, runoff, and infiltration; and (d) shows the infiltration distribution again, along with the performance summary figures. ... 184 Figure 7.12: Screenshots of the WinSRFR interface: (a) Project Management
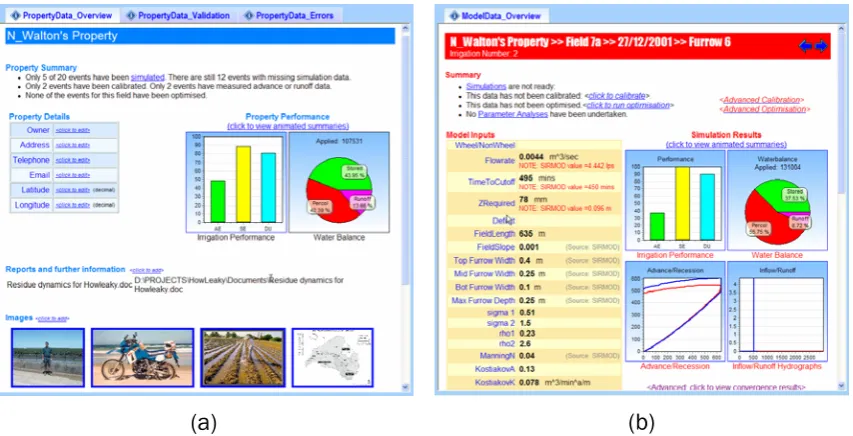
... 190 Figure 7.15: Sample database reports displayed in the database-reporting
window. (a) Property record report showing property statistics, and linked images. (b) Model record report showing simulation input data and results.
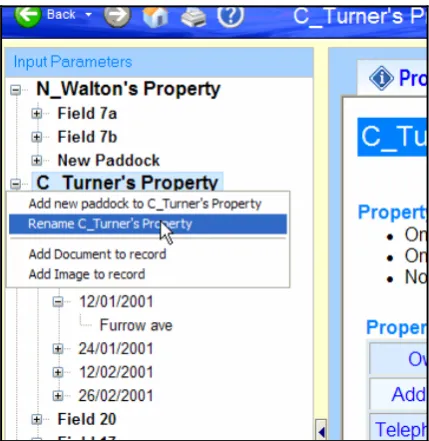
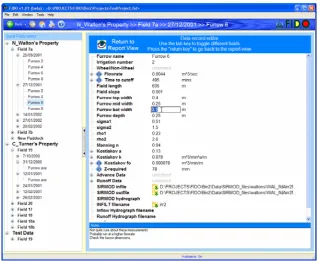
... 191 Figure 7.16: Database editing window showing the editing of the “Furrow bot
width” parameter. The database report window will be revoked once the user presses the “enter” key. ...192 Figure 7.17: (a) Performance and (b) infiltration summary analyses. (note:
screenshots are from an older version of FIDO, but the functionality is the same) ... 192 Figure 7.18: Simulation Summary Analysis... 193 Figure 7.19: Advanced comparison of (a) animated flow profiles, and (b)
simulation solution grid (advance/recession trajectories)...194 Figure 7.20: Advanced simulation convergence analysis. This is presented as a
popup dialog. ...194 Figure 7.21: Advanced calibration-monitoring analysis. (note: screenshot is from
an older version of FIDO)... 195 Figure 7.22: Optimisation objective-function priority setter...196 Figure 7.23: Parameter analysis configuration dialog...197 Figure 7.24: Response-surface generation for three design parameter. (a) Third
parameter is represented by setting of scroller-bar. (b) third parameter is expanded, showing a separate response-surface for each value of the parameter. ...198 Figure 7.25: Design and management guideline analysis showing setting up of
guideline grid. ...198 Figure 7.26: Response-surface filters for hiding/showing objective-function
parameter ranges. Objective-function weightings can be assigned using the setter at the bottom of the dialog. ...199 Figure A2.2.1: Comparison of measured and predicted advance times...238 Figure A2.2.2: Comparison of measured and predicted (a) runoff volumes and
(b) infiltrated volumes...238 Figure A2.2.3: Effect of changes in Manning n on (a) runoff and (b) infiltrated
volumes... 239 Figure A2.2.4: Effect of changes in field slope on (a) runoff and (b) infiltrated
volumes... 239 Figure A2.2.5: Effect of changes in inflow on; (a) runoff volume with constant
infiltration parameters; (b) infiltrated volume with constant infiltration parameters; (c) runoff volume with recalculated infiltration parameters; and (d) infiltrated volume with recalcul...240 Figure A2.2.6: Effect of changes in cross-sectional area of flow on; (a) runoff
volume with constant infiltration parameters; (b) infiltrated volume with constant infiltration parameters; (c) runoff volume with recalculated infiltration parameters; and (d) infiltrated volume with recalculated infiltration parameters. ...242 Figure A2.2.7: Effect of changes in final infiltration rate on (a) runoff and (b)
Figure A5.1.2: Response-surface for maximising storage efficiency. ... 297 Figure A5.1.3: Response-surface for maximising application uniformity... 298 Figure A5.1.4: Response-surface for minimising runoff... 298 Figure A5.1.5: Response-surface for minimising deep drainage... 299 Figure A5.1.6: Response-surface for maximising storage efficiency. ... 299 Figure A5.1.7: Response-surface for ignoring uniformity... 300 Figure A5.1.8: Response-surface for emphasising maximise storage efficiency. ... 300 Figure A5.1.9: Response-surface for emphasising maximise application
uniformity... 301 Figure A5.1.10: Response-surface for emphasising minimise runoff... 301 Figure A5.1.11: Response-surface for emphasising minimise drainage. ... 302 Figure A7.1.1: Borland C++ Builder has been used as the integrated
development environment for developing FIDO. ... 315 Figure A7.1.2: XML Spy 2004 has been used to develop the XML database
and reporting capabilities of FIDO... 316 Figure A7.1.3: Examples of TeeChart as used in FIDO: (a) 3D surface for
parameter analysis generation; (b) as a graphical animation of the simulation output; and (c) as a slider bar control. ... 317 Figure A7.1.4: Examples of VirtualTreeView throughout FIDO: (a) As a data
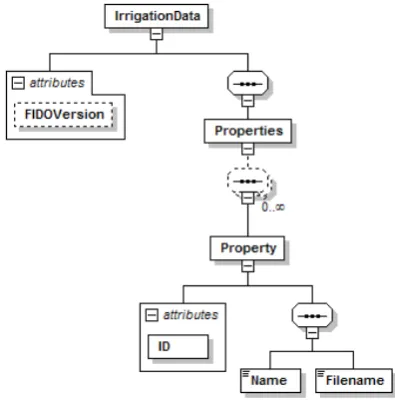
selector; (b) for data entry; and (c) as a grid control for data output. ... 317 Figure A7.2.1: Property Data Structure ... 319 Figure A7.2.2: Paddock Data Structure... 320 Figure A7.2.3: Event Data Structure... 321 Figure A7.2.4: Event Data Structure... 322 Figure A7.3.1: Main interface version 1. This is the very first version of FIDO
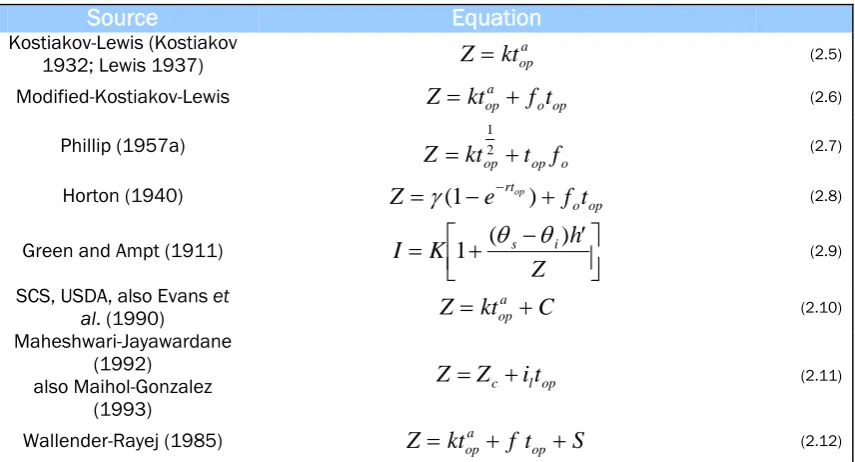
Table 2.1: List of commonly used infiltration equations in surface irrigation modelling ... 18 Table 3.1: Input variables required by the simulation engine. ... 58 Table 3.2: Boundary conditions for different phase combinations ... 75 Table 3.3: Initial parameter estimates for different irrigation phases. ... 76 Table 4.1: Parameter and objective-function values for the proposed method
compared to the results from Walker and Busman (1990) (σyAo and SSE values were calculated for each set). ... 105 Table 4.2: Effect of flowrate variations on the resulting parameter values for
Flowell nonwheel furrow data from Walker and Busman (1990). The measured inflow is varied by ±10%. ... 110 Table 5.1: Summary of response-surface results for different optimisation
weightings... 136 Table 6.1: Performance results for different management practices in the
Burdekin Delta Region... 152 Table A2.2.1: Site information for irrigation trials. ... 236 Table A2.2.2: Irrigations tested in sensitivity analysis. ... 237 Table 2.2.3: Summary of validation results. ... 237 Table A2.2.2: Coefficients of variation for power curve regressions of the nine
1
σ ,σ2,ρ1,ρ2 Furrow shape parameters i
i i i
i b c d e
a , , , , Partial derivative terms of residual of continuity i
i i i
i q r s u
p , , , , Partial derivative terms of residual of momentum
σz (Dimensionless) is subsurface storage shape parameter
fo (m3/min/m) is the steady-state or basic infiltration rate for the
soil in
Q Flow rate (m3/sec)
0 , t
Z Infiltration depth at the top end of the furrow (m)
VI Volume of water infiltrated (m3)
VS Volume of water temporarily stored on the surface. (m3) C
R Residual of continuity M
R Residual of momentum
φ Space-averaging coefficient σy Surface storage shape parameter
θ Time-averaging coefficient. c
t Time-to-cutoff (min)
req
Z Z-required (m)
n C
R 1
Δ , n M
R 1
Δ Difference matrices )
1 (
T to T(7) Temporary variables used in double sweep calculation n
C
R 1
∇ , n M
R 1
∇ Jacobian matrices
Ao. Average cross-sectional area of surface water at the upstream
end of the furrow or bay
A Cross-sectional area of flow (m2)
a Kostiakov infiltration exponent (dimensionless) AE Application efficiency (%)
At,x Cross-sectional area of flow at node (m2)
AU Application uniformity (%)
DPV Deep percolation volume (m3) dt Simulation time step (sec)
E, H and F Auxiliary coefficients used in double sweep calculation fo Steady state infiltration rate (m3/s/m)
g Gravitational constant h’ Suction at the wetting front
i Cell index
I Infiltration rate (m3/s/m)
il Saturated hydraulic conductivity of restricting layer
J, M, L and R Grid cell subscripts
K Hydraulic conductivity in the wetted zone
k Kostiakov infiltration equation coefficient (m3/mina/m)
L Field-length (m)
n Manning roughness parameter
OFV Objective function value P Hydrostatic pressure (N/m2) p Power advance curve multiplier q Inflow rate per unit width (m3/sec/m) Q, Flowrate (m3/sec)
r Power advance curve exponent (dimensionless) RV Runoff volume (m3)
S Volume of cracks per unit area
S0 Furrow slope
SE Storage efficiency (%)
Sf Energy slope
SSE Sum square error
t Irrigation time (mins)
top Opportunity time for infiltration to occur (min)
TV Total applied volume (m3)
U,V, Z, and W: Auxiliary coefficients used in double sweep calculation v Velocity of the surface flow (m/s)
x Distance along the furrow (m) Xt,x Node location (m)
y Depth of flow (m)
Z Cumulative infiltration (m)
Z Infiltrated volume/unit length (m3/m)
z Rate of infiltration per unit length (m3/sec/m) z(dt) Incremental infiltrated volume for the time-step (m)
Zc Initial depth of infiltration required for crack filling and
absorption (m)
Zt,x Cumulative infiltration depth at node (m)
γ Cumulative infiltration at top=0 if steady state had been reached at top=0 (m)
θi Initial moisture content θs Saturated moisture content
τ Time that water is available for infiltration into the soil, otherwise known as the opportunity time (min)
Qt,x Flowrate at node (m3/sec)
Chapter 1
Introduction: Towards the development of a
decision support system for furrow & border irrigation
1.1
Introduction
Surface irrigation, including furrow and border irrigation, is the simplest and most common method of irrigating crops used throughout the world today. In Australia it accounts for 57% of the total irrigated area (Australian Bureau of Statistics 2005). These systems have the potential to be very efficient, but in practice, they are probably the most inefficient method of irrigation with typical water use efficiencies ranging from 30% to 60% (Raine and Backer 1996; Smith 1988). Computer software programs developed over the last twenty years can potentially increase these efficiencies through helping irrigators improve design and management decisions. However, few irrigators or extension officers currently use any form of simulation model or decision support tool to optimise performance (Raine and Walker 1998). Complexity, limited functionality and reliability problems are possible barriers to the adoption of these tools.
The goal of this chapter is to introduce and discuss the research problem of developing a new decision support system aimed at improving the practices of furrow and border irrigation, which are the prevalent forms of surface irrigation in Australia. This chapter has five main objectives: (1) it will present the background to this research; (2) the research question and hypotheses are introduced; (3) justification for this research is presented; (4) the methodology used in this research is discussed; and (5) the outline of this dissertation is presented.
1.2
Background
Surface irrigation is the technique of artificially applying water to agricultural soils where the soil is used to transmit and infiltrate the water over the field. The water is transported along the field in furrows or borders utilising gravity and hydrostatic pressure differences as the transport mechanisms. Water infiltrates into the soil during this process, which serves to supply moisture for plant growth and provides a delivery mechanism for essential nutrients while leaching and diluting salts in the soil.
Similarly, typical application efficiencies of 40% to 80% were measured for irrigated vineyards (Smith 1988). In the Australian sugar industry, a review of surface irrigation practices revealed that application efficiencies averaged from 31% to 62%, with individual irrigations ranging from 14% to 90% (Raine and Bakker 1996). Factors most effecting efficiency includes field-length, irrigation cut-off times, water application rates, furrow shape, soil type and amount of cultivation.
However, these studies have also shown that significant improvements can easily be achieved through the adoption of better design and management practices, to minimise losses caused by tail-water runoff and deep percolation. Optimising these practices through the use of computer simulation models has revealed that irrigation water-use efficiencies of over 90% can be achieved at the field level (Raine et al. 1995; Anthony 1995; Smith et al. 2005).
Therefore, computer simulation models offer considerable potential to aid in the decision-making processes of irrigation design and management. They represent a cheap and accessible means to experiment, trial and optimise surface irrigation practices. This was proven in many studies that have shown that they are sufficiently accurate to be used in practical applications (Maheshwari et al. 1993a, 1993b; Hornbuckle et al. 2003; Abbasi et al. 2003; Ismail & Depeweg 2005). Also, as an added bonus of their use, they force the irrigator to account for, and measure, his existing management practices.
However, despite more than twenty years of research and development, these tools are yet to reach their potential for improving on-field irrigation performance, having seldom been used in engineering practice (Playan et al. 2000). In Australia (and around the world), the adoption of this technology by irrigators and consultants has been poor (Raine and Walker 1998), despite recent workshops
and training) to promote their use. While
model-developers promote the virtues of their products, the reality is that these software applications have been developed as research tools and not practitioner tools, using primitive software engineering technologies. General opinion indicates that the existing models are complex, not robust, sensitive to input data and difficult to operate. Also, they typically perform only the task of performance-evaluation and neglect other decision support requirements such as data management, infiltration parameter estimation, automatic design optimisation, and design-chart generation.
A fundamental cause of all of these limitations and problems lies not in the science of the models, but in deficiencies in structural and interface design. Typically, these programs are developed by engineers and scientists who have been researching the simulation mathematics, and who have limited software engineering experience. Modern software engineering methodologies can potentially overcome these problems by simplifying the complexities of the design task (including solution of the model) while greatly improving the utility of the product.
assumes that a thorough understanding of both irrigation hydro-informatics and modern software engineering is a prerequisite to design a decision support tool that will see practical use, and consequently improve surface irrigation practices. Therefore, the research problem for this dissertation is designed to investigate surface irrigation decision support technologies; develop strategies for overcoming gaps in the existing technologies; and incorporating these strategies into a new decision support system for furrow and border irrigation.
1.3
The research problem
In brief, the research problem is to develop an integrated decision support system for furrow and border irrigation aimed at increasing the usability of the technology to improve decision-making capabilities. Specifically the research hypothesis is:
“That calibration, optimisation, and parameter analysis capabilities can be developed and integrated with an accurate and robust simulation model into a decision support system to improve furrow and border irrigation performance.” Six specific objectives have been designed to support this hypothesis and solve the research problem:
Research Objective 1: Investigate existing surface irrigation modelling technology to determine a model and solution technique structure suitable for incorporating into a decision support system. Determine why existing surface irrigation software tools have been poorly adopted by industry. It aims to identify, describe and analyse the processes used by surface irrigation researchers in simulating the processes of furrow and border irrigation, and interfacing this technology with decision makers.
Research Objective 2: Develop a robust, reliable simulation engine for furrow and border irrigation for automation within a decision support system under optimisation and systematic response evaluation. Based upon the findings of Research Objective 1, develop a simulation engine for furrow and border irrigation that is reliable, flexible and reusable to incorporate into the decision support system, and that can cope under the rigors of automation.
Research Objective 3: Investigate and develop parameter estimation (calibration) capabilities for the decision support system. This facility will allow for the automatic determination of any combination of soil infiltration parameters and/or roughness parameter. This includes calibration on irrigation advance and/or runoff hydrographs.
Research Objective 4: Investigate and develop optimisation capabilities for the decision support system. This involves developing a user-defined objective-function for irrigation design and management. Optimisation capabilities should allow for inclusion of any input parameter combination.
tools to allow design and management charts to be automatically generated for a range of infiltration conditions. This facility should also allow response-surfaces of simulation parameter interactions to be generated for sensitivity, parameter, and objective-function analyses.
Research Objective 6: Develop an object-oriented framework to combine the components developed in Research Objectives 2 to 5 with database facilities and a graphical user interface. The objective is concerned with interfacing the science with the user in the simplest way possible. This will ultimately effect how well the software will be adopted by users of various levels.
1.4
Justification of research
This research is justified on four interrelated bases. Firstly, decision support for furrow and border irrigation is an under-researched area. A review of the literature provided no evidence of a holistic approach to combining the field-level decision support requirements. Instead, research has focused on the individual components of decision support such as; simulation and performance evaluation (e.g. Walker and Skogerboe 1987; Katopodes 1994; Singh and Bhallamudi 1996); infiltration parameter estimation (e.g. Khatri and Smith 2005; Gillies and Smith 2005); optimisation of practices (e.g. Bautista and Wallender 1993; Ito et al. 1999; Valiantzas 2001); and design chart generation (e.g. Zerihun et al. 1993; Hornbuckle et al. 2003). Questions then arise as to what constitutes a decision support system for furrow and border irrigation, and how the individual components of the system should be combined and interact.
estimation, automatic optimisation of design variables, parameter response investigation, and sensitivity analysis of design variables.
Finally, the simplicity, utility, flexibility and reliability of decision support tools could be greatly enhanced through the use of modern software engineering practices. These practices offer the potential to simplify the transformation of the modelling mathematics into computer equivalent code, with associated benefits including improved readability of code, powerful debugging capabilities, interchangability of components, enhanced exception handling, faster operating speeds, flexible inputs and outputs, and accessibility for reuse. New software engineering tools allow simple yet powerful graphical user interfaces to be developed using advanced third party libraries, which are intuitive to use, progressively disclose advanced capabilities, and are compatible with other software and the operating system.
1.5
Definitions
This section will define the key terms and concepts of this research so that the direction and focus of the dissertation can be established. These key terms and concepts include: terminology of surface irrigation; design and management of surface irrigation; surface irrigation modelling; and decision support systems for surface irrigation. The importance of these definitions warrants detailed discussion.
1.5.1 Defining surface irrigation practices
Surface irrigation in the context of this dissertation pertains to the practices of furrow and border irrigation. In particular, the software tool that is developed is most suitable for both of these practices, even though most of the validation produced in this following chapters is for the special case of furrow irrigation. In the context of this dissertation, the term “surface irrigation” will be used to imply both furrow and border irrigation, but not practices such as basin irrigation, which would require a different modelling approach. It also doesn’t include surge or cutback irrigation (even though these are forms of furrow irrigation) since the technology is not widely used in Australia.
1.5.2 Defining design and management of surface irrigation.
1.5.3 Defining surface irrigation modelling
A surface irrigation model is a computer based simulation tool used in aiding the design and management of a surface irrigation event. The model consists of a series of mathematical equations that simulate the physical hydraulic processes of the irrigation event. These equations are linked to an interface through which the user manipulates the simulation by entering data representing the physical properties of the irrigation system. The equations are usually solved at discrete time and distance intervals using a suitable finite difference or finite element technique. Operation of the model produces a series of graphical or textural outputs representing the simulated performance of the event.
The term “model” can be used to define both the mathematical constructs used to simulate irrigation, and the computer program in which these equations reside. To differentiate between the two, the term “simulation engine” will hereafter be used interchangeably with the term model to define the mathematical components; while the software program will be referred to as the “decision support system”.
1.5.4 Defining decision support systems for furrow and border irrigation.
A decision support system for furrow and border irrigation integrates a surface irrigation model (simulation engine) with a range of other design and management tools into a single software package.
The principal role of the decision support system is to simulate an irrigation event given a set of measured inputs; that is, to predict quantities that are time-dependent and difficult or impractical to measure, given a set of time independent measured input quantities. During a typical simulation, the flow rate and cross-sectional area of flow are predicted at various locations along the furrow length for each time interval. As well, the advance is predicted during the initial phase of the event.
However, if the advance is known, the model can be used to obtain estimates of other parameters, which are normally measured; for instance, infiltration. The solution of the infiltration parameters from a measured advance is known as the inverse solution. This is an important technique, as infiltration is a property that is very difficult to physically measure due to the temporal and spatial variability of the soil.
Lastly, the model should contain an optimisation algorithm allowing automatic solution of the irrigation design parameters; that is parameters that the irrigator has direct control over such as time to cut-off and inflow rate. Absence of this algorithm leads to excessive operator input while manually trying different design parameters configurations in repeated trial simulations.
1.6
Delimitations of scope
system; focus upon a target audience of irrigators, consultants and researchers; and focus on validation against existing technology. These will be discussed in turn.
1.6.1 Focus upon Australian furrow and border irrigation practices.
This research focuses upon the two most predominant forms of surface irrigation in Australia; furrow and border irrigation. Both of these practices can be modelled using the same set of 1D-algorithms with modifications to the furrow geometry parameters. Other forms of surface irrigation such as basin and bay irrigation are more suited to a 2D modelling approach (although the 1D approach has been commonly used in the past), and will not be considered in this dissertation. Also, surge and cutback irrigation will not be considered, as they are currently not widely used in Australia. Even though the tools developed in this dissertation will work for both furrow and border irrigation, validation will predominantly focus on furrow irrigation, since the research focus is at risk of becoming too broad. Also blocked furrow conditions were also not validated for the same reason.
1.6.2 Focus upon engineering aspects of in-field design and management
This research is concerned with the in-field related irrigation design and management issues such as field and furrow design, and determination of optimal inflow rates and cut-off times. This includes all aspects related to the hydraulic modelling of water flowing down along a furrow. This does not include management issues such as irrigation scheduling, or the economic assessment of irrigation performance. Decision support capabilities will be targeted at the field level, and does not include on-farm factors such as distribution in channels, farm storages and agronomic considerations.
1.6.3 Focus upon conceptual design of a decision support system.
This research aims to present a conceptual design of a decision support system for furrow and border irrigation. A prototype decision support system will be developed as part of the research to validate and test the design effectiveness. Nevertheless, the emphasis of this dissertation will be focused upon design concepts rather than the physical product. Unfortunately, it is beyond the scope of this dissertation to study the adoption of the newly developed technology by irrigators and consultants.
1.6.4 Focus on irrigators, consultants and researchers.
The design of the decision support system targets a wide range of user types including irrigators, consultants and researchers. Appropriate and innovative software engineering principles must be adhered to in order to avoid biasing the software towards any particular group.
1.6.5 Focus upon validation against existing proven technology.
SIRMOD, which has been the subject of several previous studies, including a case study as part of this dissertation (which was based on actual field-data).
1.7
Outline of dissertation
This research in this dissertation is presented in eight parts. It follows a structure resembling that of the decision support system being developed. After a brief introduction and literature review, different components of the decision support system are presented in individual chapters. This includes component topics such as the simulation engine; calibration module; optimisation module; parameter analysis module; and program structure and user interface. Finally, the conclusions arising from this research are presented in the last chapter along with implications of this research and recommendations for future work.
Chapter 1 (this chapter): An introduction to the dissertation is presented. Firstly, a brief background is given into the research problem before the research hypotheses are proposed. The subsequent sections are based upon defining the terminology, basic theory and limitations faced during the research.
Chapter 2: A literature review of existing surface irrigation modelling techniques and limitations is presented. It focuses on four modelling technologies used in surface irrigation; that is, the volume-balance, hydrodynamic, zero-inertia, and volume-balance models. Finally, it presents a case study of SIRMOD, which is one of the most successful models used for furrow and border irrigation decision support.
Chapter 3: A new simulation “engine” for furrow and border irrigation modelling is developed. This engine aims to overcome the limitations of existing models outlined in Chapter 2. This will form the “central core” of the decision support system being developed in this dissertation. The chapter presents a redevelopment of the most commonly used simulation methodology into a simpler form. These techniques are then incorporated into a new object-oriented structure designed to coexist inside a modern user-friendly decision support system. Techniques are discussed to achieve simulation robustness. The engine is validated against the SIRMOD model that was studied in Chapter 2.
Chapter 4: The parameter estimation or “calibration” requirements of a decision support system for furrow and border irrigation are investigated. Not all input parameters used in a simulation model can be directly measured in the field. Soil parameters representing infiltration and roughness need to be estimated indirectly through some form of “inverse” modelling. A simple volume-balance “inverse” technique (INFILT) was developed in the stages of this research and presented in this chapter. This work is then followed up with the development of a more powerful hydrodynamic-model technique for incorporation into the decision support system, which uses the INFILT methodology to provide starting estimates. The method is validated against real field data while objective-function response-surfaces are generated providing insight into the complexities of the solution process.
objective-function equation is derived for optimising irrigation management and design practices. Different formations of this function are examined with results highlighting ridges of constant objective-function value for different design combinations. This equation is linked with an optimisation engine using an object-oriented structure to create the optimisation module for the software. Because of the nature of the system response, it is recommended that only time-to-cutoff be included in the optimisation process which simplifies the operation in the presence of minute variations in the volume-balance caused by numerical discretisation errors.
Chapter 6: The concept of “decision support” in terms of design charts and guidelines is introduced in this chapter. An initial case study is undertaken as an early part of this research. A key feature of this work is the application of historical records to disseminate guidelines for low, average and high infiltration conditions. The design problem is then considered for the automatic generation of design charts within the decision support system. Features of the developed tool include; 4D analysis capabilities by incorporating the fourth variable through multiple charts, or slider-bar functionality; variable exchange functionality; and response-surface filtering. Sample charts are provided.
Chapter 7: The components developed in the previous four chapters are now combined with a database and a simple user interface to develop a new decision support system for furrow and border irrigation. Software engineering issues are initially discussed in this chapter before a suitable object-oriented program structure is developed to accommodate program elements. A new XML-based surface irrigation database is developed as the central core of the decision support system. Finally, a simple graphical user interface is developed with “hyperlinking” capabilities to mimic web-browser functionality.
Chapter 8: The conclusions and implications of this research are presented in this chapter. The work undertaken in the previous chapters is summarised in order to highlight the logical progression of ideas and issues studied in addressing the research hypotheses. Conclusions are presented for the research hypothesis, and associated research objectives. Practical Implications of this research are discussed along with limitations of the results. Finally, recommendations for future research and development are presented.
1.8
Conclusions
Chapter 2
Background to surface irrigation
decision support
2.1
Introduction
Computer-based decision support software has the potential to greatly improve surface irrigation design and management practices. Over the last fifty years, much research has been undertaken into the development of decision support tools focusing on the separate research areas of simulating irrigation events, estimating the soil infiltration parameters, and optimising current practices. However, very little of this research has been applied operationally indicating that there are problems with the current technology.
A major objective of this dissertation is to develop a new decision support system for surface irrigation that will overcome these problems in order to place this technology in more hands. Therefore, a comprehensive review of the literature is required to understand the strengths and weakness of the current technology. The goal of this chapter is to address this task in order to determine the structural and functional requirements of new software.
The research reported in this chapter focuses upon four main tasks: (1) to present the background theory for the decision support of surface irrigation practices; (2) to undertaken a comprehensive literature review of surface irrigation decision support technology, including simulating irrigation events, estimating the soil infiltration parameters, and optimising current practices; (3) to evaluate the most commonly used surface irrigation software through a literature review and case study; and (4) to consolidate these findings to establish a direction for the development of a new decision support system. This chapter is accompanied by two appendices containing a full derivation of the continuity and energy equations used in simulation modelling (Appendix 2.1), and a case study to evaluate the commonly used SIRMOD (Walker 2003) software package (Appendix 2.2).
2.2
Surface irrigation background
2.2.1 History
2.2.2 Techniques
Surface irrigation practices have evolved into a variety of configurations, although the distinctions between them are not always clear. Depending upon the way that the water is transported across the field, they can loosely be classified into furrow, border, basin, and wild flooding:
• Furrow irrigation involves the water being transmitted down the field via small channels or furrows. The crop is usually located between the furrows and the water is allowed to run freely from the end of the field (although blocked furrows do exist).
• Bay or border irrigation is the irrigation of long rectangular fields divided into graded borders, with longitudinal slope and free draining. Level borders, however, are not free draining.
• Basin irrigation is the irrigation of small, relatively flat enclosed areas, not allowing for runoff. Interest in level basin irrigation has resulted due to advantages of potentially high distribution uniformities, high efficiency (due to minimal deep percolation and no runoff), and reduced labour requirements (Hoffman and Martin 1993).
Inflow techniques add further dimension to this classification by distinguishing between continuous, cutback, and surge forms of irrigation practice:
• Continuous inflow involves a uniform inflow rate throughout the irrigation until termination.
• Cutback regimes involve an initially high inflow rate to advance the water to the end of the field as quickly as possible to improve application uniformity, and then a reduction in the inflow rate to reduce runoff losses.
• Surge irrigation is the intermittent application of water down a furrow or border in a series of on and off time periods. Surge irrigation is used as a management tool to improve efficiency and uniformity, although the mechanisms contributing to these improvements are not fully understood. It is known however that the soil’s infiltration rate is reduced during surge irrigation leading to a quickening of the advance in subsequent surges (Hoffman and Martin 1993). This is thought to result principally from surface sealing effects resulting in a reduction in deep percolation losses. Surge irrigation is largely confined to the United States with the practice not yet adopted by farmers in Australia.
2.2.3 Phases of the irrigation cycle
There are four distinguishable phases that occur during a typical surface irrigation event; namely the advance, storage, depletion, and recession phases:
• The advance phase occurs when water is introduced into the furrow or bay and flows downstream on initially dry soil.
• Storage occurs once the advance reaches the end of the field. There is a continuous volume of water on the surface of the furrow or bay.
• Once the inflow rate is cutoff, the depletion phase begins where the surface water level at the top end of the furrow or bay begins to fall. Some refer to this as the vertical recession phase.
then propagates along the furrow in the direction of flow. Sometimes this is known as the horizontal recession phas