P R O C E E D I N G S
Open Access
Stratify or adjust? Dealing with multiple
populations when evaluating rare variants
Robert C Culverhouse
1,2*, Anthony L Hinrichs
3, Brian K Suarez
3,4From
Genetic Analysis Workshop 17
Boston, MA, USA. 13-16 October 2010
Abstract
The unrelated individuals sample from Genetic Analysis Workshop 17 consists of a small number of subjects from eight population samples and genetic data composed mostly of rare variants. We compare two simple approaches to collapsing rare variants within genes for their utility in identifying genes that affect phenotype. We also compare results from stratified analyses to those from a pooled analysis that uses ethnicity as a covariate. We found that the two collapsing approaches were similarly effective in identifying genes that contain causative variants in these data. However, including population as a covariate was not an effective substitute for analyzing the subpopulations separately when only one subpopulation contained a rare variant linked to the phenotype.
Background
The Genetic Analysis Workshop 17 (GAW17) unrelated individuals sample is derived from the pilot3 study of the 1000 Genomes Project (http://www.1000genomes. org) and consists of genotypes of 697 subjects drawn from 8 populations. Of the 24,487 exomic single-nucleo-tide polymorphisms (SNPs) in the data, 9,433 (38.5%) occur only once in a single individual and 18,131 (74.0%) occur with less than 1% minor allele frequency (MAF). Phenotypes provided include sex, age, smoking (yes/no), ethnic population, three quantitative traits (Q1, Q2, and Q4), and the dichotomous trait Affected. A sin-gle genetic model based on additive genetic effects was used for all subjects. For a full description of the data simulation, see Almasy et al. [1]. As a result of these conditions, we took a gene-centric approach to our ana-lysis. We had two goals: (1) to determine whether any genes that contribute to the generating model could be detected using only rare variants in these extremely sparse data and (2) to determine whether population stratification would be better dealt with using stratified analyses or simply including population as a covariate.
We were blind to the generating model before the GAW17 meeting so that our analyses would not be biased by knowledge of the true model. The blind was broken at the GAW17 meeting, and our knowledge of the generating model was used for the evaluation of methods discussed in this paper.
Methods
Our analyses were based on 2,448 genes, each having at least 1 rare SNP (minor allele frequency [MAF] < 0.01) from the total 3,205 genes included in the data. This arbitrary threshold was chosen as a compromise between what is typically considered common (MAF ≥ 0.05) and the fact that the sample size in the provided data was modest. After inspecting the generating model, we discovered that 5 out of 39 causative variants for Q1 fell between these two thresholds, as did 2 of the 51 var-iants for affection status. We used a regression frame-work to examine the quantitative trait Q1 and the dichotomous trait Affected.
Collapsing rare variants
We generated two genetic variables based on related col-lapsing approaches. The first variable was simply a count of how many rare alleles an individual carried for a parti-cular gene. The second variable was dichotomous, indi-cating whether or not an individual carried at least one * Correspondence: [email protected]
1
Department of Medicine, Washington University School of Medicine, 660 South Euclid Avenue, Saint Louis, MO 63110, USA
Full list of author information is available at the end of the article
rare allele in a particular gene. Both of these collapsing approaches were previously discussed by Li and Leal [2] as part of a more sophisticated analytic approach that incorporates both rare and common variants.
Using multiple data replicates
Because of the sparseness of the information in the unre-lated individuals sample, we believed that a single data replicate would likely be underpowered for this analysis. Each replicate contains exactly the same genotypes, mak-ing most approaches to combinmak-ing information from multiple replicates prone to spurious associations. The focus on rare variants in this analysis exacerbates this problem. We chose to perform a meta-analysis of the multiple replicates. For these particular data, this approach provides a scalability feature that allows easy comparisons of differing sample sizes. For the full data, we examined single replicates, and meta-analyzed sequen-tial groups of 10 replicates each (e.g., replicates 1–10, 11– 20, etc.) and the first 50 replicates. For the much smaller subpopulation samples, we meta-analyzed sequential groups of 10 replicates each and the first 50 replicates.
An initial examination of the quantitative traits indicated that Q4 was largely determined by the covariates Sex, Age, and Smoking. This made Q4 a good candidate to use to evaluate the extent to which combining multiple replicates would lead to entirely extraneous false positives. We there-fore performed the same regression analyses and meta-analyses on Q4 as we did for Q1. The use of Q4 as a nega-tive control for false posinega-tives allowed us to evaluate the chances of the single set of genotypes giving rise to entirely spurious signals. We note that the use of a nega-tive control lets us evaluate only the extent to which entirely spurious signals might arise from the use of multi-ple copies of the same genotypes. However, this approach cannot provide an estimate of the extent to which small spurious signals, resulting from such things as rare var-iants in individuals with extreme phenotypes or modest correlations between a causative gene and a null gene, might be amplified when using multiple replicates.
Population stratification
We evaluated two methods for dealing with population stratification: (1) analyzing the strata in separate analyses and (2) pooling data from all strata, using population as a covariate. Through the use of meta-analyses of varying numbers of data replicates, we could also compare results from similarly sized single-population analyses and pan-population analyses.
Analyses
Our analyses for Q1 were based on linear regression using Sex, Age, Smoking, and Population as covariates and one of our two ways of coding the genes (quantitative count or
dichotomous indicator) as the predictor of interest. We noted that the dichotomous Affected phenotype was highly correlated with the quantitative traits. As a result, we believed that our top signals from a straightforward analysis of this trait might reveal only genes associated with Q1 or Q2. Therefore, to detect genes associated directly with the Affected phenotype, in our logistic regression analyses of affection status we included Q1, Q2, and Q4 as well as Sex, Age, Population, and Smoking as covariates.
We considered the possibility that if a causative var-iant were found in only one subpopulation, it might be advantageous to analyze that subpopulation separately. To evaluate this possibility, we conducted a second set of analyses, performed separately on each genetically distinct subpopulation. To determine whether any of the samples could be pooled, we first performed an EIGEN-STRAT analysis [3]. The results suggested that the Asian samples (Han Chinese, Denver Chinese, and Japa-nese) could be pooled, as could the European samples (European-descended Utah population [CEPH] and Tus-cans). The differences between the two African popula-tions were greater than any of the other groups but were still modest. As a consequence, we decided to separate them. A detailed plot of the two African popu-lations can be found in Hinrichs et al. [4].
Finally, we note that one of the CEPH subjects (NA7347) was an extreme outlier for Q1 across most of the data replicates. This subject was excluded from our analyses.
Our multireplicate analysis plan proceeded as follows: First, we analyzed k individual data replicates and retained thep-values. Then we performed meta-analyses using Fisher’s statistic,
F p
k = −2
∑
1
ln( ), (1)
which under the null hypothesis would be expected to have a chi-square distribution with 2kdegrees of free-dom (df). The nonindependence of the genotypes between the data replicates violates the distributional assumptions. However, our chief goal was to determine whether any of the true signals would stand out from the bulk of the noise in this sparse data.
Because of the large number of tests performed, we used 10−6as our threshold for statistical significance. All statistical analyses were performed in SAS [5].
Results
Q1 results
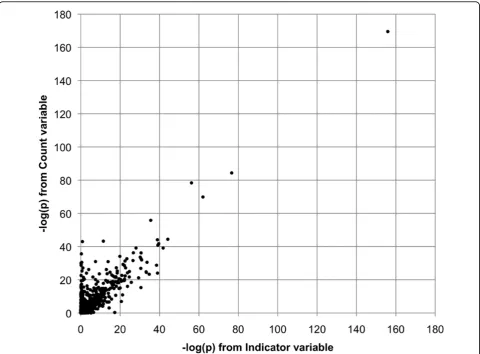
that the same four genes passed our significance thresh-old for both of the collapsing variables (Count and Indi-cator) and had similar p-values. The high degree of similarity between the two collapsing approaches held true throughout our analyses. As an example, Figure 1 illustrates the relationship between the −log(p) values for the genes in a meta-analysis of Q1 using the first 50 replicates. Each point represents the results of meta-analysis of a single gene. The horizontal position is−log (p) from the analysis based on the Indicator variable; the vertical position is−log(p) from the Count variable. The correlation between the values from the two collapsing methods is 0.92. If we eliminate the top four outlying values, the remaining values still have a correlation of 0.85. For this reason, we report only the results from the Count variable in the remainder of this paper.
A stratified analysis of the individual populations did not have any results that passed our significance thresh-old. However, the European sample (CEPH and Tuscan sample combined) hadFLT1as its top result, with p< 10−5
. The inability of any of these samples to pass the significance threshold was expected because of the small sample size. Results from meta-analyses of 10 replicates at a time are found in Table 2. In each case the top sig-nal passing the significance threshold is a gene modeled as contributing to the phenotype. In addition, although the top signal from the Luhya sample,VEGFA, did not quite pass the significance threshold (N= 1,080), it was a true positive, and the next ranked gene was three orders of magnitude less significant. This signal was consistent throughout the replicates and would become significant when more replicates were added to the meta-analysis. In contrast, we note that VEGFA was ranked 406th in the meta-analysis results for the com-bined population sample (N = 6,970) with medianp= 4.6 × 10⁻⁴.
Q4 results
In contrast, our analysis of the negative control pheno-type (Q4) resulted in no gene with a medianp< 0.05 in the combined population sample or any of the subpopu-lations. Furthermore, in none of our meta-analyses, even
including all 200 data replicates, did we achieve ap-value that passed our significance threshold (10−6) either in the combined data or in any subpopulation.
Affected phenotype results
For the combined population data no gene was signifi-cant in the individual data replicates. Only one gene,
PRKCA on chromosome 17, was significant in meta-analyses of 10 replicates (N= 6,970, median p= 2.1 × 10⁻⁹; range ofp, 9.0 × 10⁻¹³to 3.4 × 10⁻⁶).PRKCAwas a causative gene in the model. Another causative gene,
PIK3C2B, was ranked 5 out of 2,448 in the meta-ana-lyses of 10 replicates. However, it would not reach sig-nificance unless all 200 replicates were meta-analyzed.
In the stratified analyses none of the subpopulation samples passed the significance threshold, in single replicate analyses or in a meta-analysis of 10 replicates. However, if 50 replicates were meta-analyzed,PRKCA became significant in the Asian sample (N= 16,050,p= 3.4 × 10⁻¹¹) and in the Yoruba sample (N= 5,600,p= 5.6 × 10⁻⁹) and was trending toward significance in the Luhya sample (N = 5,400,p= 4.3 × 10⁻⁵). This signal was not seen in the combined European sample (N= 7,500,p= 0.35).
Discussion
Clearly, some contributing genes (FLT1, VEGFA,
PRKCA) could be detected by an examination of rare variants in the unrelated subjects. However, it turned out that our second goal (determining whether stratified analyses or a population covariate would be more effec-tive in dealing with population stratification in these data) gave rise to the most interesting results.
FLT1contained multiple rare variants with large effect on Q1. The signals from this gene were strong in the European and Yoruba populations and present in the Asian populations. (The rare variants in FLT1were not significant in the Luhya sample, even if 200 replicates were meta-analyzed.) Because the signal was present in subsamples representing more than 84% of the data, pooling the data and using population as a covariate maximized power.
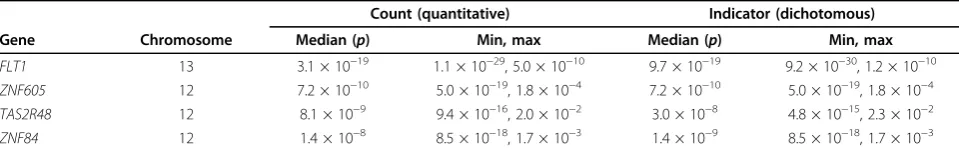
Table 1 Q1 single replicate results for combined populations (200 replicates,N= 697 each)
Count (quantitative) Indicator (dichotomous)
Gene Chromosome Median (p) Min, max Median (p) Min, max
FLT1 13 3.1 × 10⁻¹⁹ 1.1 × 10⁻²⁹, 5.0 × 10⁻¹⁰ 9.7 × 10⁻¹⁹ 9.2 × 10⁻³⁰, 1.2 × 10⁻¹⁰ ZNF605 12 7.2 × 10⁻¹⁰ 5.0 × 10⁻¹⁹, 1.8 × 10⁻⁴ 7.2 × 10⁻¹⁰ 5.0 × 10⁻¹⁹, 1.8 × 10⁻⁴ TAS2R48 12 8.1 × 10⁻⁹ 9.4 × 10⁻¹⁶, 2.0 × 10⁻² 3.0 × 10⁻⁸ 4.8 × 10⁻¹⁵, 2.3 × 10⁻² ZNF84 12 1.4 × 10⁻⁸ 8.5 × 10⁻¹⁸, 1.7 × 10⁻³ 1.4 × 10⁻⁹ 8.5 × 10⁻¹⁸, 1.7 × 10⁻³
Linear regression results from using two collapsing approaches for rare variants in a gene. Analyses used population as a covariate. The median, minimum (min), and maximum (max)p-value for each gene that passed our threshold of 10−6
In contrast,VEGFA, found in an analysis of the Luhya sample, was not near the top of the list in the combined analysis. It was not until we meta-analyzed 50 replicates of the full data (total N= 34,850) that this gene sur-passed the 10−6 significance threshold (p= 1.4 × 10⁻¹⁴). In contrast, meta-analysis of the first 50 replicates of the Luhya subjects alone (total N = 5,400) resulted in an extremely lowp-value (p= 2.1 × 10−94). This is because the rare variant for VEGFA is private to the Luhya population. As a result, including samples from other populations merely introduces noise into the signal. It is interesting to note thatVEGFAcorresponds to the high-est linkage signal found in a linkage analysis of the family data [4].
We note that the phenotypes were modeled identically for the different populations. As a consequence, one might have believed a priori that a combined analysis (perhaps not even using population as a covariate)
might be the most powerful approach. However, as illu-strated by the results for VEGFA, this need not be the case. This suggests that it might be worthwhile to ana-lyze multipopulation data both ways (stratified and adjusted), despite the multiple testing penalty.
In these data we also found that the two tested approaches to collapsing performed similarly, particu-larly for the top signals. This simply suggests that in these data the outliers in phenotype were not also out-liers in terms of the count variable for any genes. Clearly, this cannot be generalized to other genetic models.
Finally, although our top signal in each analysis result was a true signal, there were many more highly signifi-cant false positives than we would have expected. We learned from the analysis of Q4 that it is unlikely that these spurious results were a completely random effect of using multiple replicates of the same genotypes. Two
other possible causes come to mind. First, rare variants carried by individuals with extreme phenotypes could give rise to such results. We tested this idea by perform-ing some analyses that included the individual from the CEPH sample (NA7347) who had an extreme Q1 value (>5 standard deviations above the mean) in nearly every replicate. We found that multiple genes that were not included in the model but for which this individual was the only carrier of rare variants became significant. Sec-ond, the signals could actually be in the data, although they were not included in the generating model. We note that many false positives in these data have been reported as consistently arising under a variety of analy-sis methods. For a detailed discussion of this aspect of the data, see Luedtke et al. [6].
Conclusions
In our analyses we found that in the GAW17 data, the two collapsing methods produced similar results. More important, these analyses showed that even with the identical genetic model applied to multiple subpopula-tions, sample size is not the only factor that determines power. If rare causative variants are private to a subpo-pulation, stratified analysis might be more powerful than a combined analysis, despite a considerable decrease in sample size.
Acknowledgments
The Genetic Analysis Workshops are supported by National Institutes of Health (NIH) grant R01 GM031575 from the National Institute of General Medical Sciences. Additional support came from NIH grants R03 DA023166 from the National Institute on Drug Abuse and K01 AA01572 from the National Institute on Alcohol Abuse and Alcoholism and from an award from the Urological Research Foundation.
This article has been published as part ofBMC ProceedingsVolume 5 Supplement 9, 2011: Genetic Analysis Workshop 17. The full contents of the supplement are available online at http://www.biomedcentral.com/1753-6561/5?issue=S9.
Author details
1Department of Medicine, Washington University School of Medicine, 660
South Euclid Avenue, Saint Louis, MO 63110, USA.2Division of Biostatistics,
Washington University School of Medicine, 660 South Euclid Avenue, Saint
Louis, MO 63110, USA.3Department of Psychiatry, Washington University School of Medicine, 660 South Euclid Avenue, Saint Louis, MO 63110, USA.
4
Department of Genetics, Washington University School of Medicine, 660 South Euclid Avenue, Saint Louis, MO 63110, USA.
Authors’contributions
RCC conceived of the study, participated in its design, performed the main statistical analysis, and drafted the manuscript. ALH participated in the design of the study and performed the EIGENSTRAT analyses. BKS participated in the design of the study and helped to draft the manuscript. All authors read and approved the final manuscript.
Competing interests
The authors declare that there are no competing interests.
Published: 29 November 2011
References
1. Almasy LA, Dyer TD, Peralta JM, Kent JW Jr., Charlesworth JC, Curran JE, Blangero J:Genetic Analysis Workshop 17 mini-exome simulation.BMC Proc2011,5(suppl 9):S2.
2. Li B, Leal SM:Methods for detecting associations with rare variants for common diseases: application to analysis of sequence data.Am J Hum Genet2008,83:311-321.
3. Price AL, Patterson NJ, Plenge RM, Weinblatt ME, Shadick NA, Reich D:
Principal components analysis corrects for stratification in genome-wide association studies.Nat Genet2006,38:904-909.
4. Hinrichs AL, Culverhouse RC, Suarez BK:Linkage analysis of three quantitative phenotypes in two African samples.BMC Proc2011,5(suppl 9):S81.
5. SAS/STAT [Unix]: Version 9.1. Cary, NC, SAS Institute Inc.;2002-2003. 6. Luedtke A, Powers S, Petersen A, Sitarik A, Bekmetjev A, Tintle NL:
Evaluating methods for the analysis of rare variants in sequence data. BMC Proc2011,5(suppl 9):S119.
doi:10.1186/1753-6561-5-S9-S101
Cite this article as:Culverhouseet al.:Stratify or adjust? Dealing with multiple populations when evaluating rare variants.BMC Proceedings
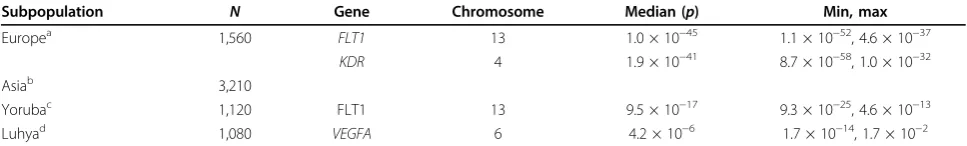
20115(Suppl 9):S101. Table 2 Q1 subpopulation results (20 meta-analyses, 10 replicates each)
Subpopulation N Gene Chromosome Median (p) Min, max Europea 1,560 FLT1 13 1.0 × 10−45 1.1 × 10−52, 4.6 × 10−37
KDR 4 1.9 × 10−41 8.7 × 10−58, 1.0 × 10⁻³²
Asiab 3,210
Yorubac 1,120 FLT1 13 9.5 × 10⁻¹⁷ 9.3 × 10⁻²⁵, 4.6 × 10⁻¹³
Luhyad 1,080 VEGFA 6 4.2 × 10⁻⁶ 1.7 × 10⁻¹⁴, 1.7 × 10⁻²
Linear regression results using the Count coding for rare variants in a gene. The median, minimum (min), and maximum (max)p-value for the top causative genes that passed our threshold of 10−6
for at least 50% of the replicates are listed, plus the top result from the Luhya sample, which does not quite meet the threshold.
a
There were 78 lower ranked false positives (p< 10−6
). The highest ranked false positive hadp< 10−40
.
b
There were no genes that passed the significance threshold of 10−6
. Top gene had medianp= 0.13.
c
There were 23 lower ranked false positives (i.e.,p< 10−6
). The highest ranked hadp> 10−14
.
d
No genes passed the significance threshold of 10−6
in at least 50% of the replicates. The second ranked gene hadp> 10−3